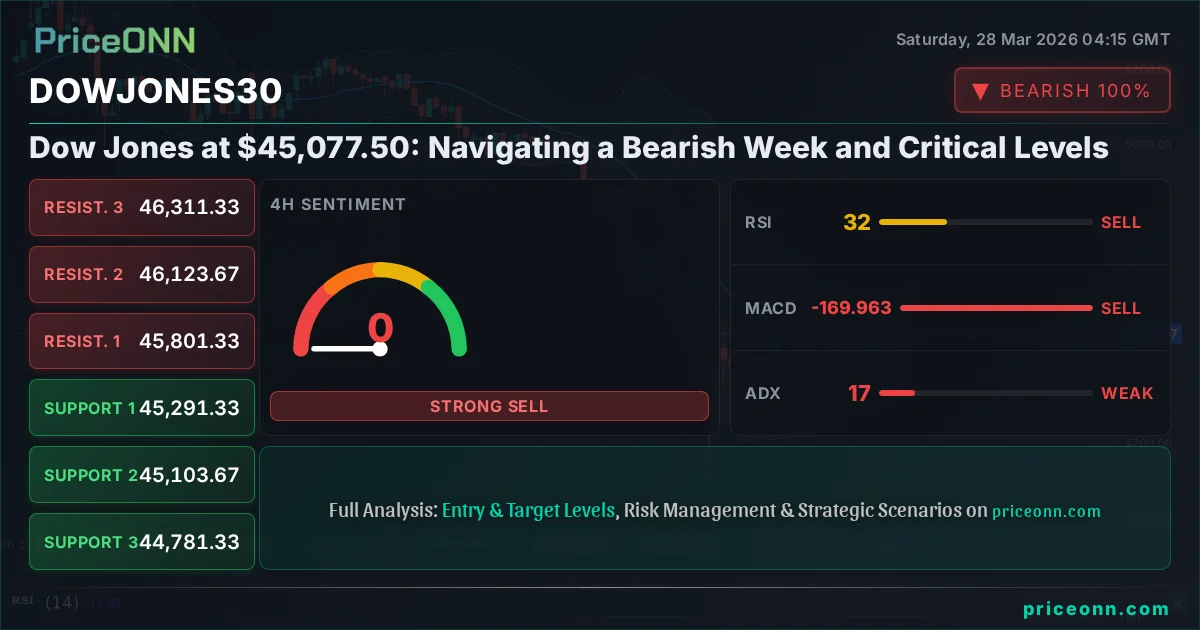
The Dow Jones Industrial Average (DJIA) experienced a significantly bearish week, concluding last Friday's trading session at precisely $45,077.50. This sharp decline, marked by a substantial 2.08% drop, or 957.5 points, from its previous close, paints a cautious picture for market participants heading into the new week. The index's daily range between $45,021 and $46,241 underscored the heightened volatility and directional pressure. As we analyze the technical landscape, understanding the confluence of indicator signals and key price levels becomes paramount for navigating the potential market movements. This analysis delves into the critical junctures that will likely dictate the Dow's trajectory in the coming days, providing a framework for understanding the underlying market sentiment and the potential for a shift in momentum.
- The Dow Jones closed Friday at $45,077.50, down 957.5 points (-2.08%) for the week, signaling strong bearish pressure.
- Critical support for the Dow Jones is located at $45,084.67 (S1), with further levels at $45,021 and $44,781.33.
- Resistance is now firmly established, with the first key level at $45,294.67 (R1), followed by $45,352.33 and $45,399.67.
- The ADX at 16.8 indicates a weak trend, suggesting choppy or ranging conditions, despite the recent sharp decline.
- Conflicting signals from RSI (22.17, oversold) and MACD histogram (negative momentum) require careful observation for confirmation of a sustained move.
The past week presented a stark reminder of market's inherent volatility. For the Dow Jones Industrial Average, this volatility manifested as a steep downturn, wiping out recent gains and challenging established support structures. The drop from a weekly high of $46,241 to a low of $45,021 signifies a significant shift in sentiment, likely driven by a combination of macroeconomic concerns and sector-specific headwinds impacting major components of the index. Examining the daily close at $45,077.50, we see the index teetering precariously close to the psychological $45,000 mark, a level that could serve as a crucial psychological and technical pivot point. The sheer magnitude of the weekly decline suggests that the bears have firmly seized control, at least in the short term, and any recovery attempt will face significant headwinds from overhead resistance.
Delving into the technical indicators provides a more granular view of the forces at play. On the 1-hour chart, the Average Directional Index (ADX) sits at a rather uninspiring 28.4. While this might seem contradictory to the sharp price drop, an ADX reading in this range often signifies a market that is either transitioning between trends or is in a choppy, range-bound state rather than exhibiting a strong, committed directional move. This is further echoed by the Stochastic Oscillator, which shows %K at 2.52 and %D at 10.07. Both are deep in oversold territory, suggesting that the selling pressure might be nearing exhaustion on this shorter timeframe, but without a clear bullish divergence or a confirmation from other indicators, this is merely a signal of potential oversold conditions, not a buy signal itself. The Relative Strength Index (RSI) at 22.17 reinforces this oversold narrative, indicating that the index has been sold off aggressively in the recent past.
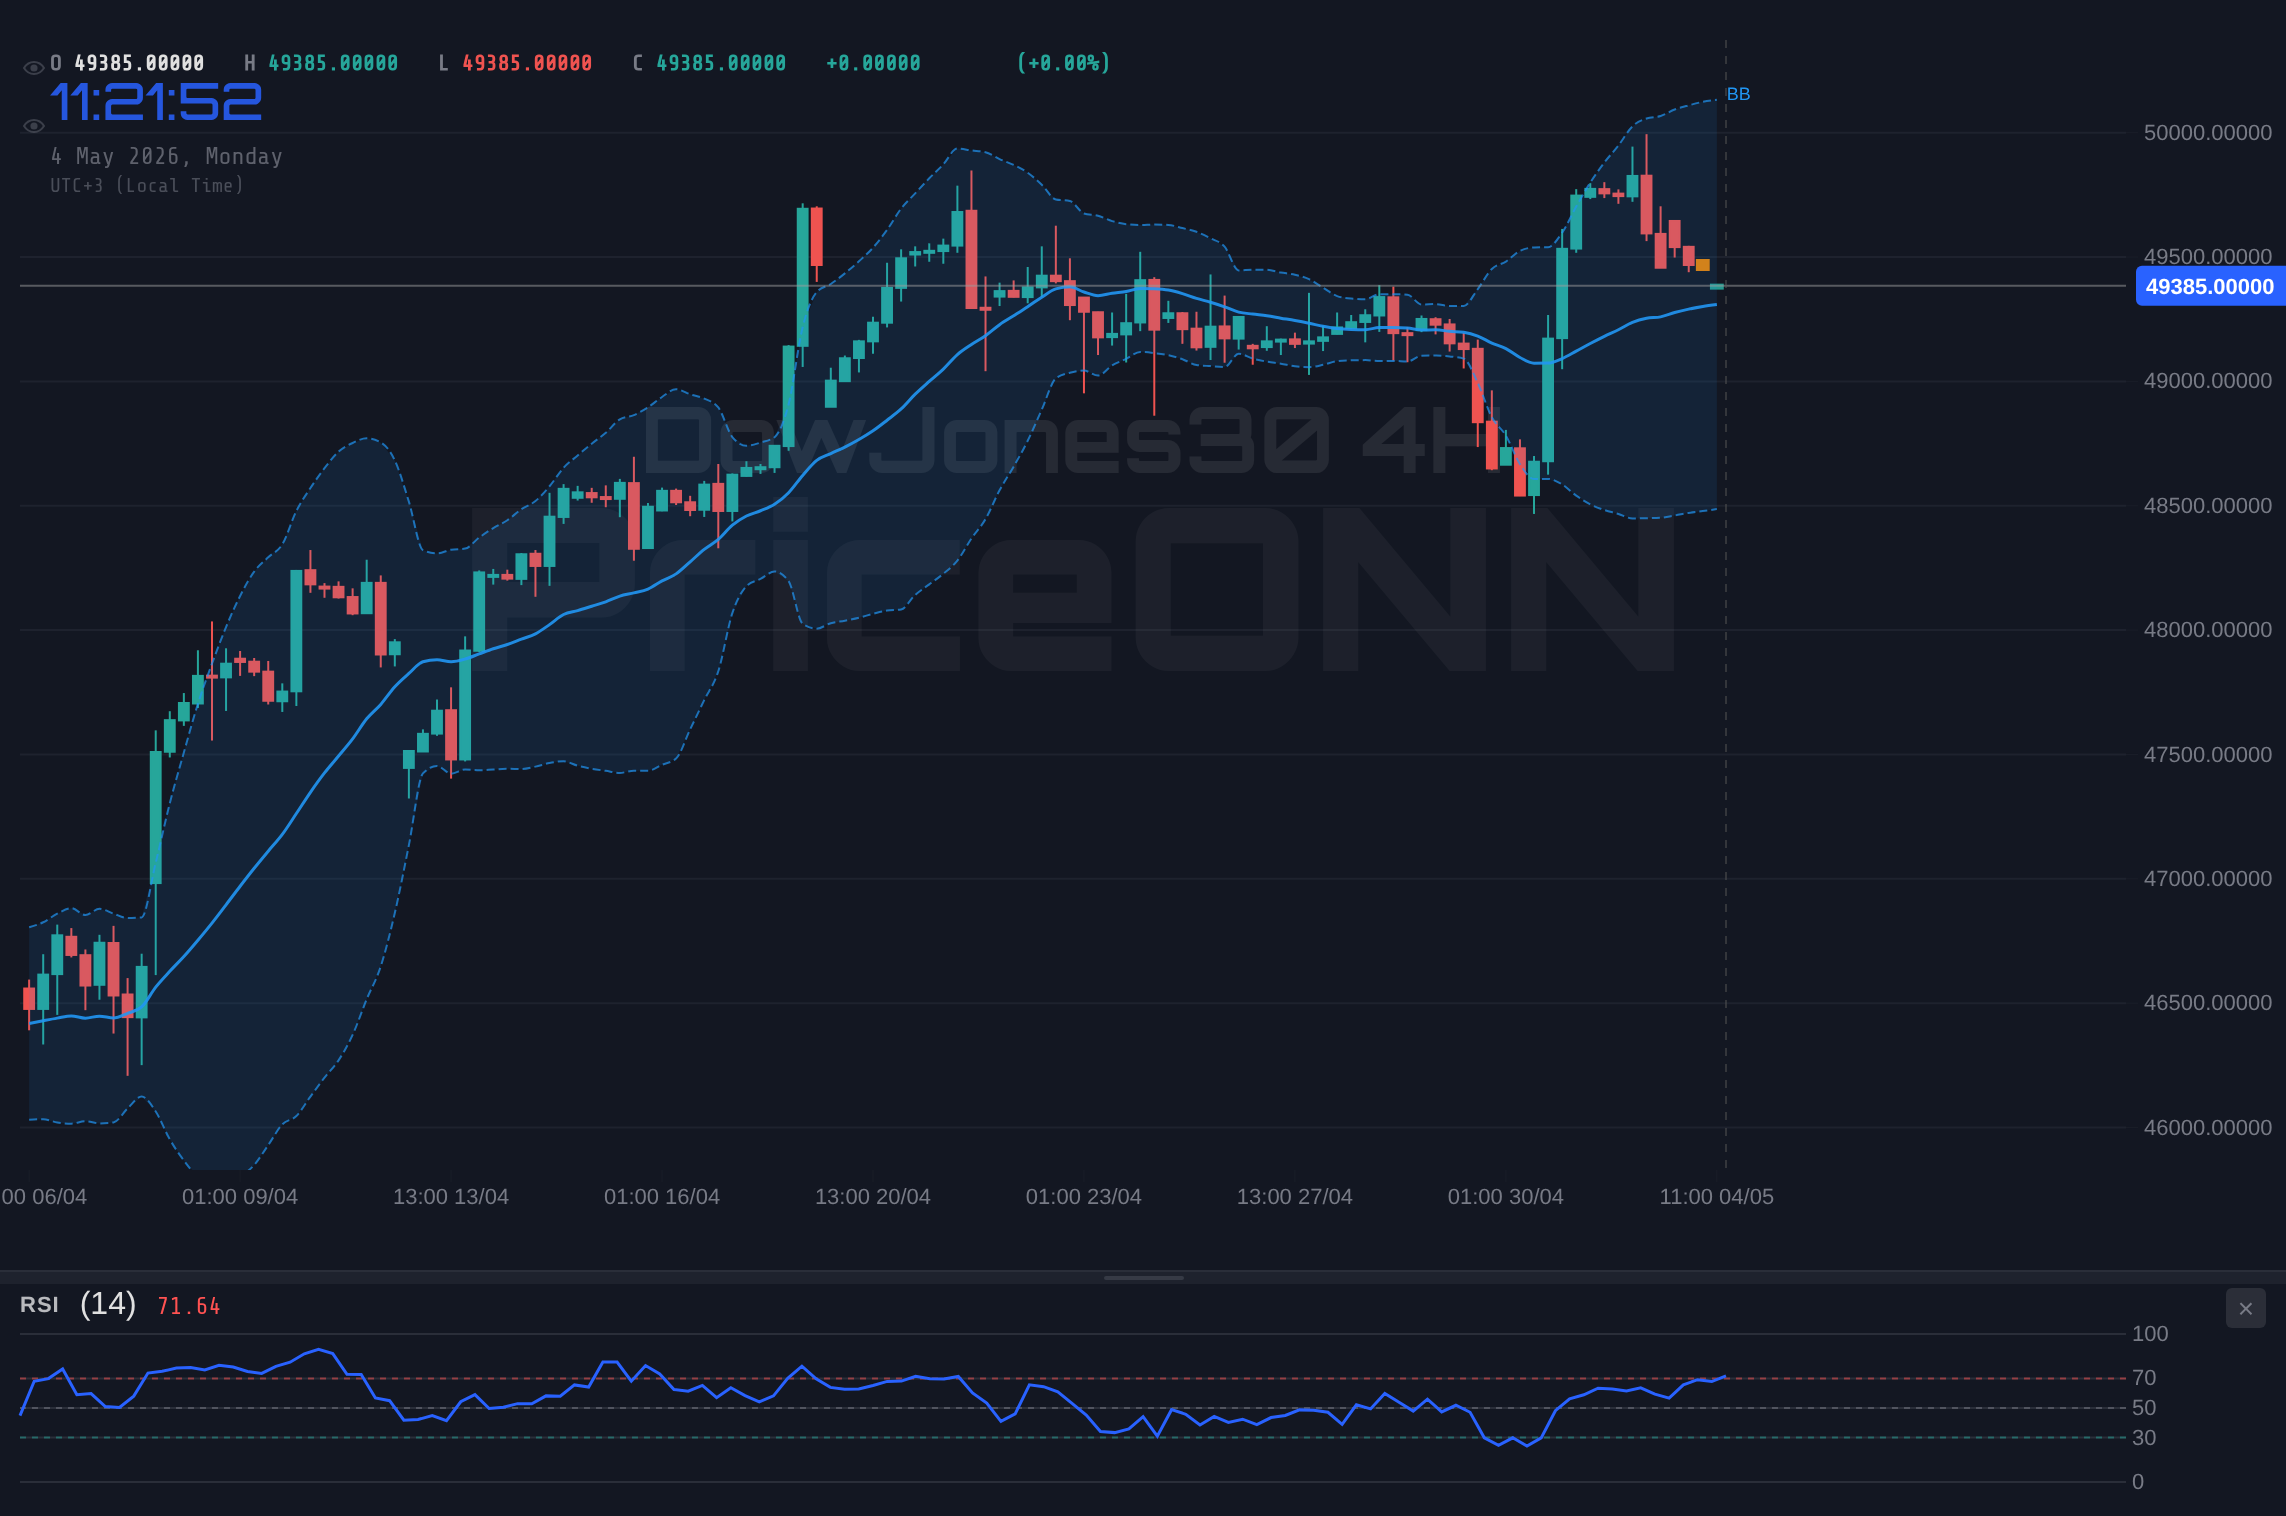
However, the picture painted by the 4-hour timeframe offers a slightly different perspective, albeit still bearish. The trend is identified as 'Düşüş' (Düşüş meaning Down/Bearish) with a strength of 93%. This reinforces the bearish sentiment observed on the daily chart. The ADX here is lower at 16.8, which, as mentioned, points towards a weaker trend or a consolidating market. This is where the market can become tricky; a weak ADX in a bearish trend can mean that the downside momentum is not robust, potentially leading to sharp, short-lived bounces or sideways chop. The Stochastic, with %K at 2.97 and %D at 21.26, remains deeply oversold, again suggesting a potential for a short-term relief rally. The MACD histogram, while negative, shows a slight flattening, hinting that the bearish momentum might be decelerating on this timeframe. This divergence between the strong daily downtrend and the weaker trend/oversold conditions on shorter timeframes creates a complex trading environment.
The daily chart presents the most formidable bearish outlook. The trend is unequivocally 'Düşüş' (Bearish) with a strength of 100%. The RSI at 26.8 is deeply oversold, a level historically associated with potential turning points, but not a direct buy signal in isolation. The MACD histogram is firmly negative, indicating sustained selling pressure. Crucially, the Bollinger Bands are showing the price trading below the lower band, a condition that often precedes a reversion to the mean or a continuation of the downtrend if momentum remains strong. The ADX at 41.99 is exceptionally high, signaling a very strong, established trend. This strong trend reading on the daily chart suggests that any short-term bounces might be opportunities for sellers to re-enter or for the market to consolidate before potentially resuming its downward move. The Stochastic %K at 32.25 and %D at 33.33 are also in oversold territory, but the gap between them is narrowing, which could precede a bullish crossover if buying pressure emerges.
The correlation with other market instruments is vital for a comprehensive view. The Dollar Index (DXY) closed last Friday at 99.91, showing a strong upward move of 0.34%. This strengthening dollar typically exerts downward pressure on commodities like gold and silver, and can also weigh on global equity markets as it makes dollar-denominated assets more expensive for foreign buyers. The SP500, a key risk appetite indicator, saw a significant drop of 2% to 6357.55, and the Nasdaq 100 also plunged 2.23% to 23092.5. This broad-based selloff in major US equity indices suggests a clear 'risk-off' sentiment prevailing in the market. When major indices like the S&P 500 and Nasdaq are falling sharply, it often signals a deleveraging event or a flight to safety, which can have cascading effects across all asset classes, including the Dow Jones. The correlation here is strong: a risk-off environment detrimental to equities is also likely to be bearish for the Dow Jones.
Oil prices, represented by Brent Crude, surged dramatically, closing at $110.64, up 6.77%. This spike in oil prices, potentially fueled by geopolitical tensions or supply concerns, adds another layer to the macroeconomic picture. Higher energy costs can contribute to inflation, which in turn influences central bank policy expectations. If inflation fears intensify due to rising energy prices, it could lead to expectations of tighter monetary policy, which is generally bearish for equities and indices like the Dow Jones. The market is currently grappling with the dual challenge of slowing growth, indicated by the equity selloff, and potentially resurgent inflation, signaled by the oil price surge. This creates a complex environment where traditional correlations might break down or become amplified.
Considering the technical levels, the closing price of $45,077.50 places the Dow Jones squarely between critical psychological and technical zones. On the downside, the first immediate support level (S1) identified on the 4-hour chart is at $45,291.33. However, the daily chart's S1 at $45,771.33 and the 1-hour chart's S1 at $45,189.67 highlight the immediate vicinity of the current price. The absolute support level to watch on the 4-hour chart is $44,781.33, a break below which could signal a more significant acceleration of the downtrend. On the upside, resistance is formidable. The 1-hour chart shows R1 at $45,294.67, with the 4-hour chart's R1 at $45,801.33 and the daily chart's R1 at $45,771.33. The price must convincingly break and hold above these levels to even consider a trend reversal. The current price of $45,077.50 sits below all these immediate resistance levels, reinforcing the bearish bias.
The overall market sentiment appears to be one of caution and risk aversion. The sharp decline in major equity indices, coupled with a strengthening dollar and rising oil prices, creates a conflicting macroeconomic backdrop. Investors are likely weighing the prospects of slower economic growth against persistent inflationary pressures, leading to uncertainty about future central bank policy. The technical indicators, while showing oversold conditions on shorter timeframes, are dominated by the strong bearish trend on the daily chart. The ADX readings present a dilemma: a strong daily trend suggests the move has legs, but weaker ADX on shorter timeframes and oversold stochastics indicate potential for pauses or bounces. This suggests that while the path of least resistance is currently to the downside, the market might be entering a phase where sharp reversals or consolidations are possible.
The recent news flow adds context to the prevailing market mood. Reports of widening losses in deep-sea mining and concerns over AngloGold's Nevada project, while specific to the commodities sector, contribute to a broader narrative of economic challenges. More directly relevant to the Dow Jones components, the warnings of force majeure on Russian oil shipments due to Ukrainian drone strikes underscore the ongoing geopolitical risks that can impact energy prices and global supply chains. India's move to slash fuel taxes and curb exports also reflects the pressure of high energy costs. Furthermore, the potential for Bitcoin to outperform stocks amidst renewed pressure on equities highlights the shifting dynamics of asset allocation in a risk-averse environment. These geopolitical and macroeconomic factors are feeding into the broader market sentiment, contributing to the selling pressure seen across the Dow Jones and other major indices.
For traders and investors, the current environment demands a high degree of discipline and patience. The strong bearish trend on the daily chart suggests that short positions might be favored, but the oversold conditions on intraday and 4-hour charts necessitate caution regarding entry timing and the potential for sharp, short-lived rallies. The ADX reading of 16.8 on the 4-hour chart is particularly noteworthy; it suggests that while a downtrend exists, it lacks strong directional conviction, increasing the risk of whipsaws. Therefore, waiting for clear confirmation - such as a decisive break below key support levels or a sustained move above resistance with confirming volume - is advisable. Trading against a strong daily trend is a high-risk strategy, and the current setup does not yet offer a clear, high-probability reversal signal.
Looking ahead, the economic calendar will be crucial. While specific dates for many high-impact events were not provided in the immediate data, typical releases like inflation figures (CPI), employment reports (NFP), and central bank commentary (Fed minutes, speeches) will be key drivers. The market will be dissecting any data that could influence the Federal Reserve's stance on interest rates. A hotter-than-expected inflation report or strong employment numbers could reinforce the bearish trend by signaling continued hawkishness from the Fed, while weaker data might spark a relief rally by increasing expectations of a policy pivot or rate cuts. The correlation between the Dow Jones and the DXY will remain a key theme; a sustained rise in the dollar could continue to pressure the index.
The price action around the $45,077.50 level is pivotal. A decisive close below this mark on the daily chart could trigger further selling, potentially targeting the $44,781.33 support. Conversely, any sustained move above the $45,294.67 resistance level, ideally on increased volume and with positive divergences in oscillators, could signal a short-term bottom or a retracement. However, given the prevailing bearish sentiment and the strong daily trend, the odds favor continued downside pressure unless significant bullish catalysts emerge. The market is currently in a 'show me' phase, where price action needs to provide concrete evidence of a trend change before significant capital is deployed from the sidelines. The current technical setup, dominated by the daily bearish trend and strong ADX, suggests that caution is the most prudent approach.
The confluence of technical signals paints a complex, yet predominantly bearish, picture for the Dow Jones Industrial Average as we move past last Friday's close at $45,077.50. The strong downtrend on the daily chart, supported by a high ADX reading of 41.99, indicates significant bearish momentum. However, oversold conditions on shorter timeframes, coupled with a weak ADX on the 4-hour chart, suggest that sharp bounces or periods of consolidation are possible. The market's reaction to upcoming economic data and geopolitical events will be critical in determining whether the current downtrend continues or if a short-term reprieve is on the horizon. For now, the levels to watch remain key resistance above $45,294.67 and support below $45,084.67, with a decisive break of either likely to dictate the next significant move.
Bearish Scenario: Downside Momentum Continues
65% ProbabilityNeutral Scenario: Choppy Trading and Consolidation
25% ProbabilityBullish Scenario: Oversold Bounce Potential
10% ProbabilityFrequently Asked Questions: DowJones30 Analysis
What happens if the Dow Jones30 breaks below the $45,084.67 support level?
A decisive break below $45,084.67 would invalidate the neutral scenario and likely confirm the bearish outlook. This could trigger further downside, with the next significant support target at $44,781.33 on the 4-hour chart.
Is the current RSI reading of 22.17 a buy signal for the Dow Jones30 at $45,077.50?
An RSI of 22.17 indicates oversold conditions on the 1-hour chart, suggesting selling pressure may be exhausting. However, it is not a direct buy signal, especially with the strong daily bearish trend. Confirmation, such as bullish divergence and a close above resistance, is needed.
How will the weak ADX reading of 16.8 on the 4-hour chart impact the Dow Jones30 trend analysis?
A low ADX like 16.8 suggests a weak or ranging trend on the 4-hour timeframe. This implies that despite the sharp price move, the directional conviction is not strong, increasing the risk of choppiness and potential for sharp, short-lived bounces or consolidations, making it harder to establish a clear directional trade.
How will upcoming economic data releases potentially affect the Dow Jones30's trajectory from $45,077.50?
Stronger-than-expected inflation or employment data could reinforce bearishness by suggesting continued Fed hawkishness, potentially pushing the Dow Jones30 lower towards $44,781.33. Conversely, weaker data might spark a relief rally by increasing rate cut expectations, with the index targeting resistance around $45,294.67.
Track markets in real-time
AI-powered analysis, technical indicators and real-time price data.
Join Our Telegram Channel
Breaking market news, AI analysis and trading signals instantly.
Join Channel