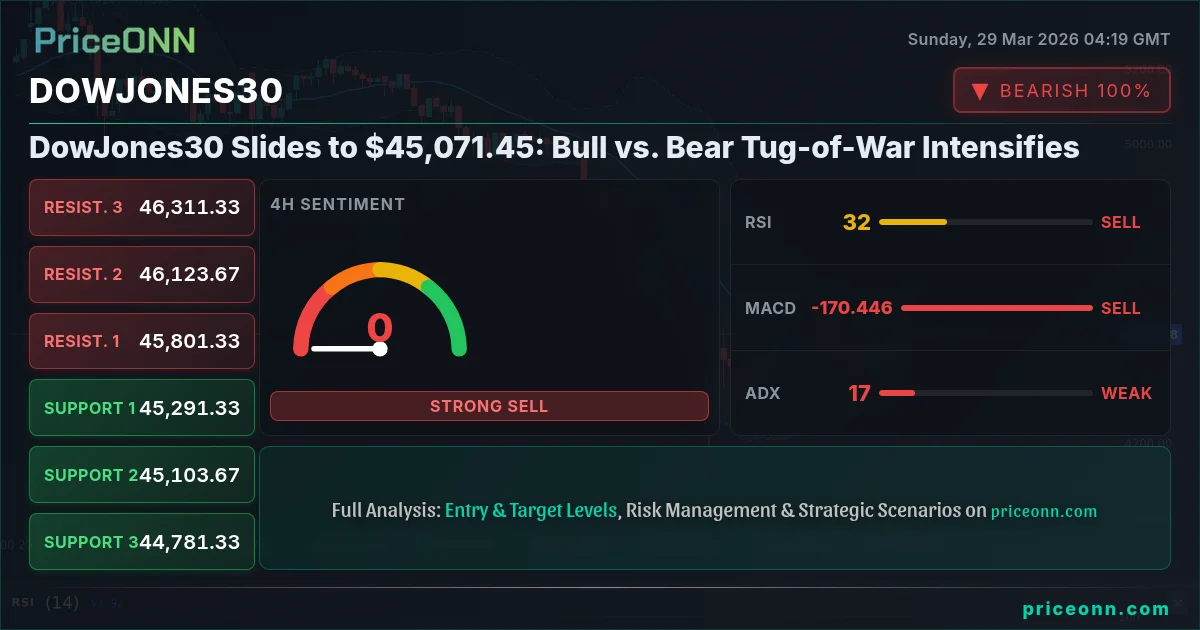
The DowJones30 is currently locked in a fierce battle, trading at $45,071.45, as the market grapples with conflicting signals. Last week's trading session saw a significant bearish push, with the index closing down considerably. This price action has intensified the debate between the bulls, who see potential for a rebound from oversold conditions, and the bears, who believe the downward momentum is poised to continue. Understanding the interplay between these forces, supported by detailed technical analysis and the broader macroeconomic backdrop, is crucial for navigating the current choppy waters. The tension at $45,071.45 is palpable, and the next move could set the tone for the coming weeks.
- The DowJones30 is currently trading at $45,071.45, with last week's close marking a significant bearish move.
- With RSI at 22.07 on the 1H chart, oversold conditions suggest potential for a short-term bounce, but the ADX at 28.4 indicates a strong downtrend is in play.
- Critical support sits at $45,071.33, tested multiple times, while immediate resistance is found at $45,189.67 on the 1H timeframe.
- The correlation with a strengthening DXY (99.79) and a falling SP500 (6355.66) points to a risk-off environment, which typically pressures indices like the DowJones30.
The Tug-of-War at $45,071: A Market Divided
The Case for the Bulls: Seeking a Reversal from Oversold Extremes
The persistent selling pressure that characterized last week's trading has pushed the DowJones30 down to $45,071.45. However, for the bulls, this sharp decline presents a potential opportunity. Looking at the technical indicators, especially on the shorter timeframes, there are signs that the market might be oversold. On the 1-hour chart, the Relative Strength Index (RSI) is hovering at 22.07. This level is deep into the oversold territory, which historically has often preceded a bounce. Traders looking for a quick snap-back might interpret this as a signal to enter long positions, anticipating a short-term recovery. The Stochastic Oscillator on the same timeframe is also deep in its oversold zone, with the %K line at 2.27 and %D at 10.03, further reinforcing the idea that the selling may have been overdone in the immediate term. The fact that the index has found some footing around the $45,071.33 support level on the 1-hour chart also lends credence to the bullish argument. This level has been tested, and a failure to break decisively below it could be interpreted as a sign of underlying buying interest emerging.
Furthermore, the broader market context, while currently risk-averse, could pivot. If inflation fears begin to subside or if central bank rhetoric shifts even slightly towards a more dovish stance - though unlikely given current trends - risk assets could see a swift repricing. The bulls are hoping for a catalyst, perhaps a surprisingly weak economic data point that cools interest rate hike expectations, or a geopolitical de-escalation, to spark a relief rally. They are watching the immediate resistance level on the 1-hour chart at $45,189.67. A decisive break above this level, coupled with increasing volume, would be the first confirmation that the bears' grip is loosening and that a short-covering rally could be gathering steam. The psychology of the market also plays a role; after such a sharp decline, some traders may feel compelled to step in, expecting a reversion to the mean, especially if the index has fallen too far, too fast without significant fundamental news to justify the move.
The Case for the Bears: Momentum and Macro Headwinds
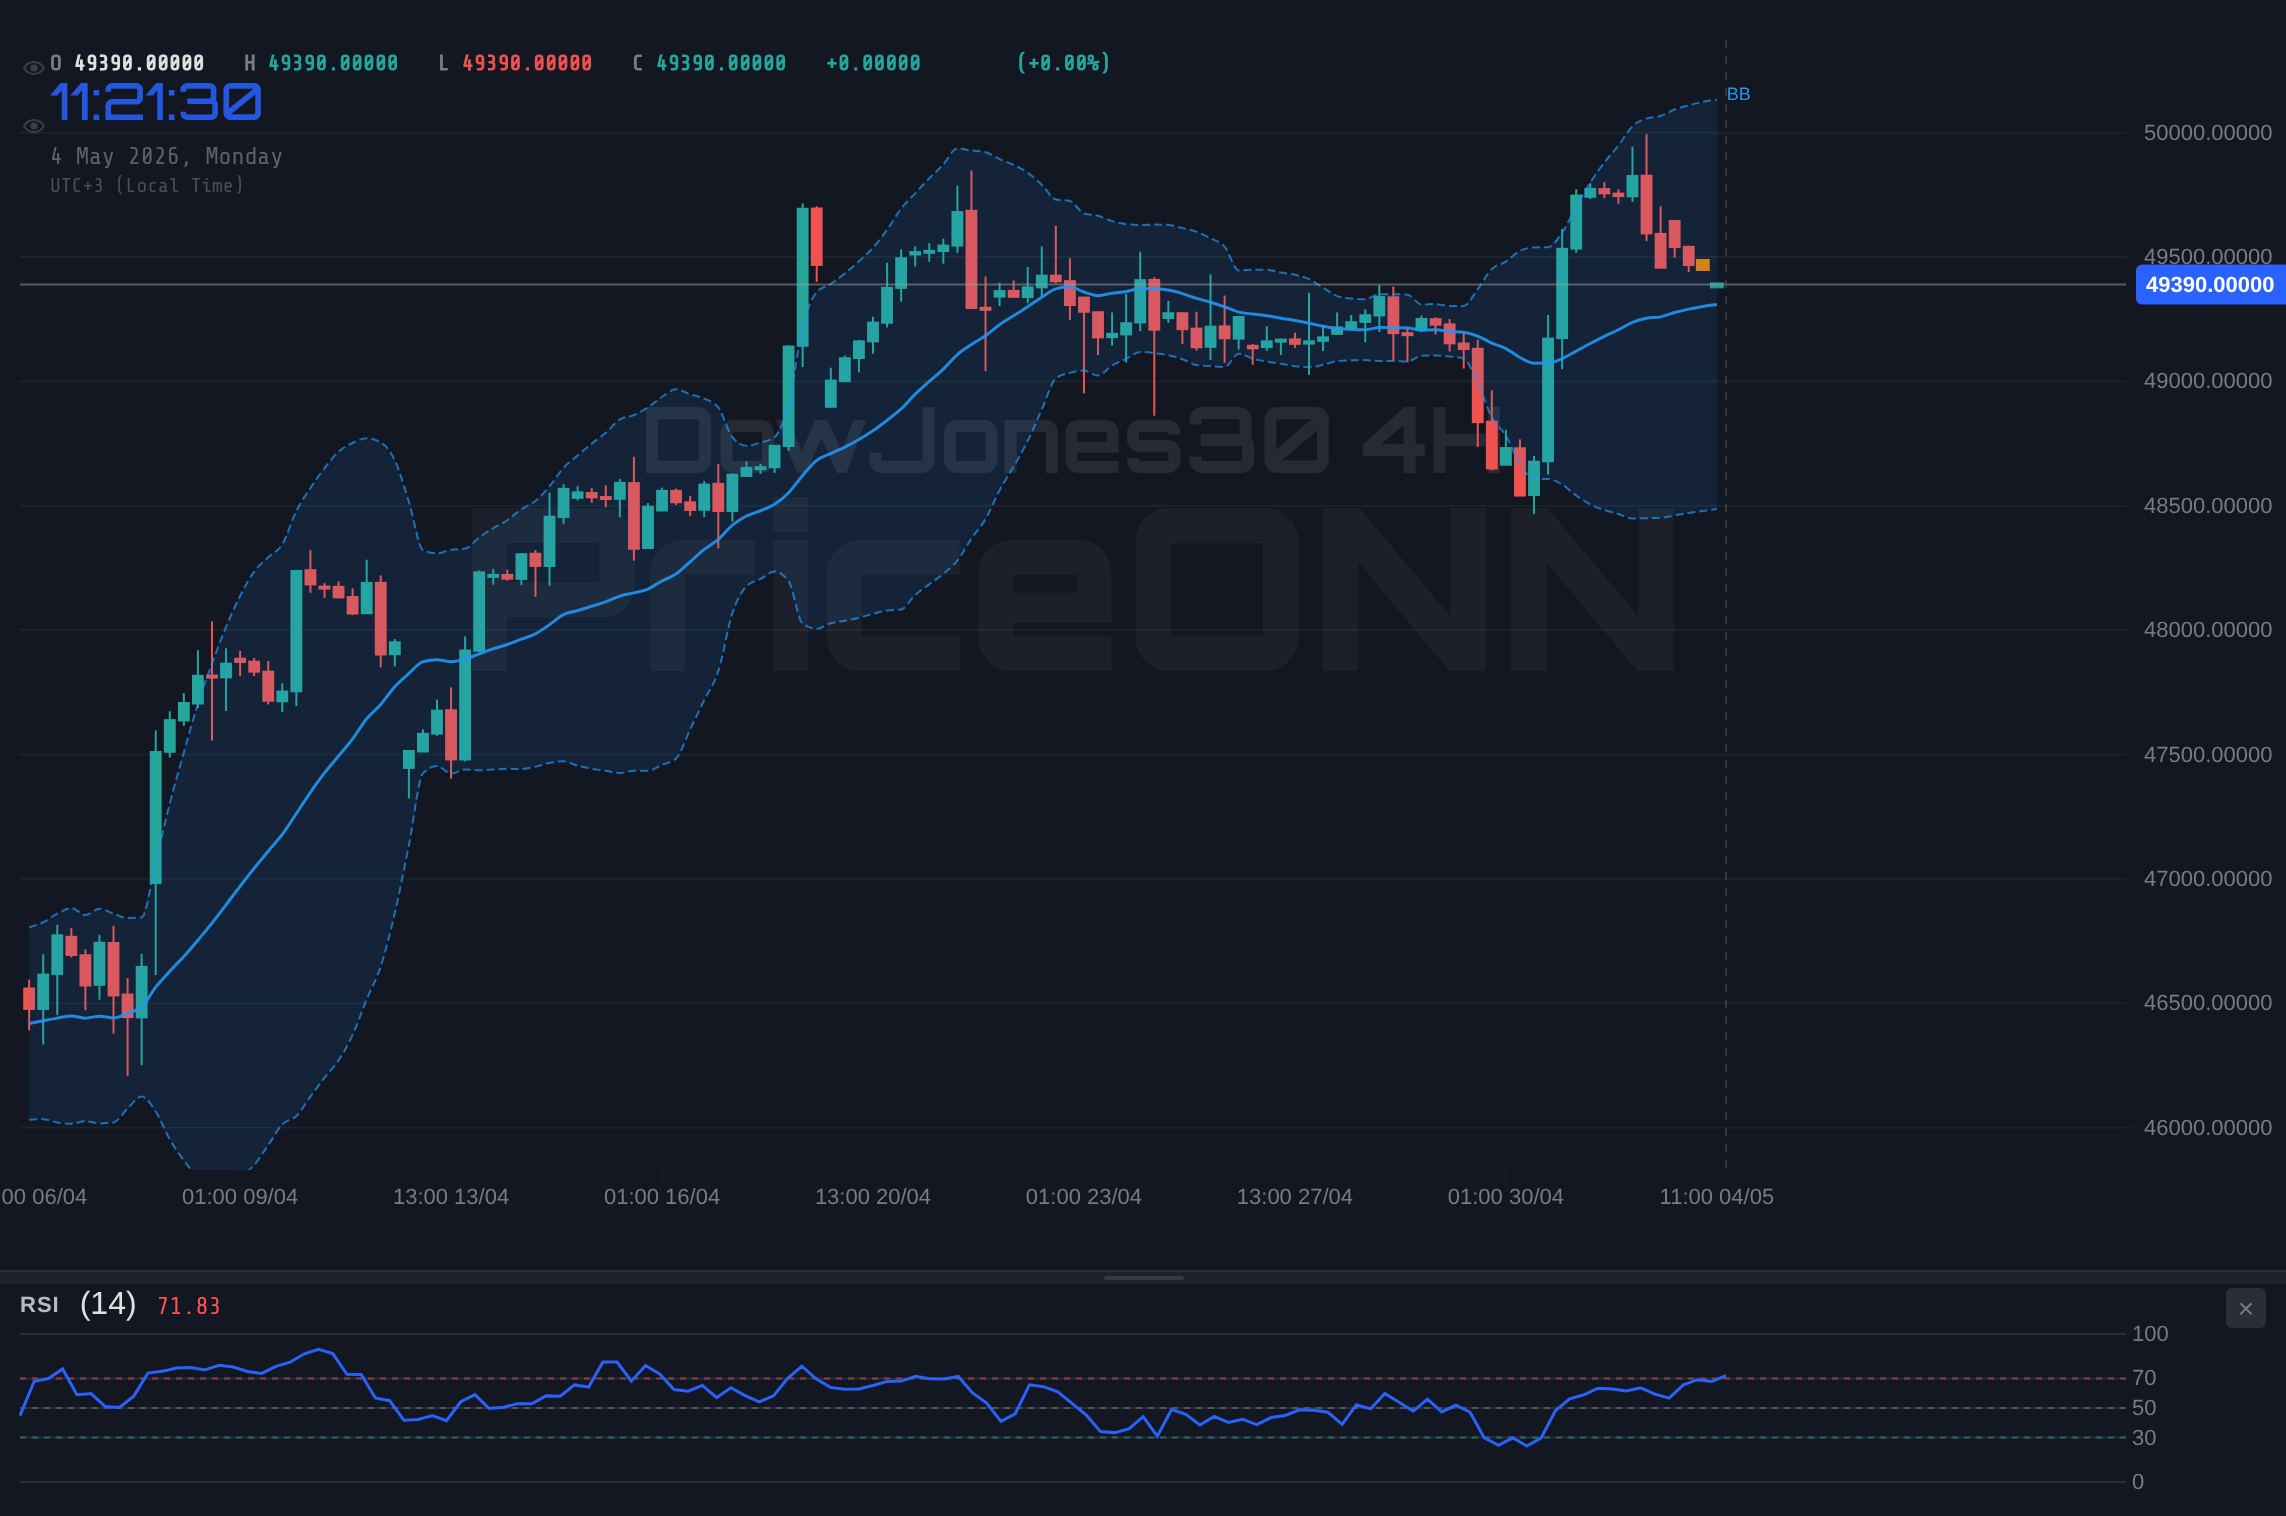
Despite the oversold readings on shorter timeframes, the bears have a compelling case, anchored by the persistent downtrend and broader macroeconomic pressures. The 1-day chart paints a much grimmer picture. The ADX on the 1-day timeframe is at a robust 41.99, indicating a strong downtrend is firmly in place. This is a significant indicator that cannot be ignored, suggesting that the current price action is not merely a short-term blip but part of a more substantial market move. The MACD on the daily chart also shows negative momentum, with the MACD line below the signal line and the histogram printing negative values, reinforcing the bearish sentiment. While the 1-hour chart might show oversold conditions, the longer-term trend often dictates price action, and on the daily chart, the DowJones30 is clearly in a downtrend. The price is also trading below the middle Bollinger Band on the daily chart, which, combined with the strong ADX, suggests further downside potential.
The correlation with other market instruments also supports the bearish outlook. The US Dollar Index (DXY) is currently at 99.79 and showing a strong upward trend on the daily chart (ADX 31.93), which typically exerts downward pressure on global equity markets. Simultaneously, major US equity indices like the SP500 are down significantly, with the SP500 at 6355.66 and showing a strong downtrend (ADX 47.68) on the daily chart. This broad risk-off sentiment, where investors flee to safer assets like the dollar, directly impacts indices like the DowJones30. Furthermore, the persistent rise in oil prices, with WTI at $100.94 and Brent at $110.33, fuels stagflation fears - a scenario of high inflation and stagnant economic growth. This environment is detrimental to corporate earnings and, consequently, to stock market valuations. The bears are watching the support level at $45,071.33 very closely; a decisive break below this could open the floodgates for further selling, potentially targeting the next major support at $44,781.33 on the 4-hour chart.
Technical Confluence: Where the Data Speaks
When analyzing the DowJones30 at $45,071.45, the technical picture presents a clear divergence between short-term and long-term timeframes, creating a critical juncture for traders. On the 1-hour chart, the signals lean towards a potential short-term bounce. The RSI at 22.07 and Stochastic Oscillator deep in oversold territory are classic indicators that a reversal might be imminent. The immediate resistance at $45,189.67 is the first hurdle for any upward move. A break and hold above this level, ideally with increasing volume, would be necessary to invalidate the short-term bearish momentum and suggest a move towards the next resistance at $45,294.67. However, the strength of this potential bounce is questionable given the broader trend.
The 4-hour and daily charts offer a starkly different perspective. The ADX on the 1-day chart at 41.99 is a strong signal of a robust downtrend, indicating that any short-term rallies are likely to be sold into. The MACD on the daily chart confirms this, displaying negative momentum. The price action below the middle Bollinger Band on the daily chart and the bearish trend on the 4-hour chart (ADX 26.25) suggest that the path of least resistance is still to the downside. The support levels at $45,071.33, $44,781.33, and $44,507.67 are critical. A break below $45,071.33 on the daily close would significantly increase the probability of a move towards $44,781.33 and potentially lower. The conflicting signals between the short-term oversold conditions and the long-term bearish trend create a high degree of uncertainty. This is a market where patience and waiting for confirmation are paramount. The DXY at 99.79 and falling equities like the SP500 at 6355.66 reinforce the risk-off sentiment, making a sustained bullish turnaround unlikely without a significant shift in the macro environment.
The Verdict: Caution Amidst Conflicting Signals
The DowJones30, currently trading at $45,071.45, finds itself at a critical crossroads. The technical indicators present a classic bull vs. bear scenario, with short-term oversold readings clashing with a dominant long-term downtrend. On the 1-hour chart, the RSI at 22.07 and Stochastic Oscillator's deep oversold position suggest a potential for a short-term bounce. Bulls will be looking for a move above the $45,189.67 resistance, hoping to trigger a relief rally. However, this optimism is tempered by the daily chart's strong bearish signals. The ADX at 41.99 clearly indicates a powerful downtrend, and the MACD confirms negative momentum. The price trading below daily Bollinger Bands further supports the bearish thesis. The broader market sentiment, reflected in a rising DXY at 99.79 and falling equity markets like the SP500 at 6355.66, reinforces the risk-off environment, making a sustained rally in the DowJones30 a challenging prospect. The bears have the upper hand due to the entrenched downtrend and macroeconomic headwinds like rising oil prices and stagflation fears. While a short-term bounce is possible, any significant upside move is likely to face strong selling pressure. The critical support at $45,071.33 is the level to watch; a break below it would confirm the bears' dominance and could lead to further significant declines. For now, caution is the prevailing sentiment, as the market awaits a clearer directional signal.
Navigating the DowJones30 at $45,071.45: A Trader's Perspective
From a trader's perspective, the current environment around the DowJones30 at $45,071.45 is one that demands discipline and a well-defined strategy. The conflicting signals across different timeframes create a challenging trading landscape. For those inclined to trade the short-term bounce, a clear entry trigger would be a close above the 1-hour resistance at $45,189.67, with a tight stop-loss just below the current price. The target for such a trade would be the next resistance at $45,294.67, offering a limited but potentially quick profit. However, this approach carries significant risk given the dominant daily downtrend.
Conversely, the bears might look for confirmation of the downtrend to resume. A break and daily close below the $45,071.33 support level would be a strong bearish signal, potentially initiating a trade targeting the $44,781.33 level on the 4-hour chart. The stop-loss for this trade would be placed just above the broken support, perhaps around $45,189.67, to avoid getting caught in a short-term whipsaw. The high ADX on the daily chart (41.99) suggests that once a breakdown occurs, the move could be swift and significant. For longer-term investors, the current price action might be viewed with caution. While oversold conditions on shorter charts could offer a tactical entry for a bounce, the overarching bearish trend and macroeconomic concerns suggest that a more strategic approach, perhaps waiting for a more substantial pullback or a clearer trend reversal signal, would be prudent. The ongoing strength of the DXY at 99.79 and the weakness in broader equity markets like the SP500 at 6355.66 are key factors that cannot be ignored. Any bullish thesis must contend with these headwinds.
The Shadow of Stagflation and Geopolitical Tensions
The current market sentiment is heavily influenced by the specter of stagflation, a potent mix of stagnant economic growth and high inflation. The surge in oil prices, with WTI crossing $100.94 and Brent exceeding $110.33, is a primary driver of these concerns. This not only impacts consumer spending and corporate costs but also complicates the monetary policy decisions for central banks. The Federal Reserve, in particular, faces a dilemma: raising interest rates to combat inflation risks further slowing an already fragile economy, while failing to act could allow inflation to become entrenched. The market's interpretation of Fed policy, driven by inflation data and employment figures, will be a critical factor for the DowJones30. Last week's USD data showed a slight miss in non-farm payrolls (Actual: 210k vs. Forecast: 211k), which might offer a sliver of hope for a less hawkish Fed, but the overall trend of rising yields and persistent inflation suggests otherwise. The correlation between rising Treasury yields and pressure on equity valuations is well-established, and any further increase in yields could exacerbate the selling pressure on indices like the DowJones30.
Geopolitical tensions, particularly in the Middle East, are adding another layer of uncertainty and volatility. The ongoing conflict contributes to the rise in oil prices and fuels demand for safe-haven assets. While the DXY at 99.79 is benefiting from this risk-off sentiment, it simultaneously puts pressure on global equities. The news flow surrounding these events is crucial; any escalation could lead to further price spikes in commodities and a flight to safety, further pressuring the DowJones30. Conversely, any signs of de-escalation could provide a much-needed reprieve for risk assets. The market is constantly weighing these geopolitical risks against the backdrop of domestic economic conditions. The interplay between energy prices, inflation expectations, central bank policy, and geopolitical stability creates a complex environment where predicting market direction is exceptionally challenging. The DowJones30's sensitivity to these factors means that any significant development on these fronts could trigger sharp price movements.
The Role of Correlated Assets: DXY, Equities, and Oil
To understand the DowJones30's predicament at $45,071.45, it's essential to examine its correlations with other key market assets. The Dollar Index (DXY) is currently trading at 99.79 and showing a strong upward trend on the daily chart. Historically, a stronger dollar often correlates with a weaker DowJones30, as it makes US exports more expensive and can signal capital flowing out of riskier assets into the perceived safety of the greenback. The current upward trajectory of the DXY, supported by higher US Treasury yields and geopolitical uncertainty, aligns with the bearish pressure seen on the DowJones30. This inverse relationship is a significant factor for traders to consider.
The performance of broader equity indices, such as the SP500 and Nasdaq100, also provides critical context. With the SP500 at 6355.66 and the Nasdaq100 at 23076.09, both showing significant daily declines and strong downtrends on their daily charts (ADX for SP500 is 47.68, Nasdaq100 is 45.07), the overall market sentiment is decidedly risk-off. The DowJones30 typically moves in tandem with these major indices, and the widespread selloff in the equity complex reinforces the bearish outlook. Investors are rotating out of growth and cyclical stocks, which are heavily represented in the DowJones30, into safer havens. Finally, the surge in oil prices (WTI at $100.94) is a double-edged sword. While it benefits energy sector companies within the Dow Jones, the broader inflationary impact and the potential for economic slowdown it signals are negative for the index as a whole. The market is currently pricing in the stagflationary risks associated with high energy costs, overshadowing any sector-specific benefits.
Short-Term Bounce Potential vs. Long-Term Downtrend
The DowJones30's current technical posture presents a fascinating dichotomy. On the 1-hour chart, the RSI at 22.07 and Stochastic Oscillator readings below 10 strongly suggest oversold conditions. This could facilitate a technical bounce, a short-covering rally where traders aim to profit from a temporary upward correction. The immediate resistance at $45,189.67 is the first hurdle for such a move. If this level is overcome, the next target would be $45,294.67. Such a bounce would likely be driven by algorithmic trading and short-term opportunistic plays, rather than a fundamental shift in market sentiment. The ADX on the 1-hour chart at 21.94 indicates a moderate trend, suggesting that a bounce, if it occurs, might have some momentum.
However, this short-term optimism is overshadowed by the persistent bearish trend on the longer timeframes. The daily chart's ADX of 41.99 is a powerful signal of a strong downtrend. This suggests that any rallies are likely to be capped and sold into, a phenomenon often referred to as 'selling the rips.' The MACD on the daily chart confirms this, showing negative momentum. The price trading below the daily middle Bollinger Band further indicates bearish pressure. Support levels at $45,071.33 and $44,781.33 are critical. A failure to hold $45,071.33 on a closing basis would likely confirm the continuation of the downtrend, targeting lower levels. The DXY's strength at 99.79 and the broader equity market weakness add to the headwinds. Therefore, while a short-term bounce is technically plausible, the prevailing long-term trend and macroeconomic factors suggest that any upward moves should be treated with skepticism, and the probability of further downside remains elevated.
The Path Forward: Levels to Watch and Scenarios
As the DowJones30 hovers around $45,071.45, traders and investors are keenly focused on key levels that will dictate the next significant move. The immediate resistance on the 1-hour chart at $45,189.67 is the first hurdle. A decisive breach and sustained trade above this level could signal the beginning of a short-term corrective rally, with potential targets at $45,294.67 and $45,352.33. Such a scenario would likely require a shift in short-term sentiment, perhaps driven by opportunistic buying in oversold conditions or a minor easing of geopolitical tensions.
Conversely, the support at $45,071.33 is paramount. A breakdown below this level, especially on a daily closing basis, would be a strong bearish signal. This could trigger a cascade of selling, with the next significant support levels at $44,781.33 (4H chart) and $44,507.67 (1H chart) coming into play. The high ADX on the daily chart (41.99) suggests that such a breakdown could lead to a rapid decline. The broader market context, including the rising DXY at 99.79 and weakness in SP500 (6355.66), supports the bearish case. A neutral scenario, characterized by consolidation, might occur if the index fails to break decisively above immediate resistance or below immediate support, leading to a period of choppy trading. However, given the strong daily downtrend, a neutral phase might simply be a precursor to further downside rather than a stable base for a recovery. Traders will be watching volume closely; any move accompanied by significantly higher volume would lend more conviction to the directionality.
Bearish Scenario: Downtrend Resumes
70% ProbabilityNeutral Scenario: Consolidation at Key Levels
20% ProbabilityBullish Scenario: Short-Term Bounce
10% ProbabilityMarket Context and Macroeconomic Influences
The Stagflationary Storm: Oil Prices and Inflationary Pressures
The global economy is increasingly under the shadow of stagflation, a dreaded economic condition characterized by high inflation coupled with stagnant growth. The most visible driver of this concern is the dramatic surge in oil prices. WTI crude has rocketed past $100.94, and Brent crude is trading above $110.33. This surge is primarily attributed to escalating geopolitical tensions in the Middle East and supply constraints. Such high energy costs have a ripple effect across the economy, increasing transportation and production costs for businesses, which are then passed on to consumers in the form of higher prices for goods and services. This inflationary pressure erodes purchasing power and can dampen consumer demand, leading to slower economic growth. The market's reaction to this scenario is a heightened sense of risk aversion, as seen in the broader equity market selloff.
The implications for central banks, particularly the US Federal Reserve, are profound. Faced with rising inflation, the Fed is under pressure to maintain a hawkish stance, potentially through further interest rate hikes or by keeping rates elevated for longer. However, the weakening economic growth outlook complicates this decision. Aggressive rate hikes could tip the economy into a recession, while inaction risks allowing inflation to become more deeply embedded. Last week's US economic data provided mixed signals; while non-farm payrolls came in slightly below expectations (Actual: 210k vs. Forecast: 211k), other indicators might still point towards underlying inflationary pressures. The market is closely monitoring every piece of economic data and every statement from Fed officials for clues on the future path of monetary policy. The persistent rise in oil prices suggests that inflationary pressures may remain elevated, making the stagflationary scenario a significant risk for equity markets like the DowJones30.
Geopolitical Fault Lines: Middle East Tensions and Safe-Haven Flows
The geopolitical landscape remains a significant source of volatility, with the Middle East serving as a focal point for escalating tensions. The ongoing conflict in the region has direct implications for global energy markets, contributing to the surge in oil prices and raising concerns about potential supply disruptions. This heightened geopolitical risk has predictably fueled demand for safe-haven assets. The US Dollar Index (DXY), currently at 99.79, has benefited from this flight to safety, showing a strong upward trend on its daily chart. This strength in the dollar often correlates inversely with global equity markets, including the DowJones30, as capital seeks refuge in perceived stable currencies and assets.
The market's sensitivity to geopolitical news is acute. Any significant escalation of conflict could trigger further sharp moves in oil prices and a broader risk-off sentiment, leading to additional selling pressure on the DowJones30. Conversely, any signs of diplomatic progress or de-escalation could provide a temporary reprieve for equities. Investors are closely watching developments in the region, as well as other geopolitical flashpoints, to gauge the overall level of global risk appetite. The uncertainty stemming from these geopolitical factors adds another layer of complexity to market analysis, making it difficult to predict sustained directional moves. The DowJones30's performance is intrinsically linked to these global dynamics, and traders must remain vigilant to news flow that could impact market sentiment and asset allocation.
Correlation Analysis: DXY, SP500, and the DowJones30 Dance
Understanding the DowJones30's movements requires an appreciation of its correlation with other major market instruments. The Dollar Index (DXY) is currently at 99.79, displaying a robust upward trend. Historically, a strengthening dollar often acts as a headwind for US equities, including the DowJones30. This is because a stronger dollar makes American goods more expensive for international buyers and can signal a global preference for dollar-denominated assets over riskier equities. The current confluence of a strong DXY and a declining DowJones30 at $45,071.45 aligns with this typical inverse relationship. Traders are watching the DXY closely; any sustained move above the 100 level could intensify the pressure on the index.
The broader equity market sentiment, as reflected by the SP500 and Nasdaq100, is also a critical factor. With the SP500 at 6355.66 and the Nasdaq100 at 23076.09, both showing significant daily losses and strong downtrends on their daily charts (SP500 ADX at 47.68, Nasdaq100 ADX at 45.07), the risk-off environment is palpable. The DowJones30, being a price-weighted index of 30 large, prominent companies, is highly sensitive to shifts in overall market sentiment. The widespread selling across major indices suggests that institutional investors are de-risking their portfolios, which directly impacts the DowJones30. The correlation here is strong and direct: as the broader market falls, the DowJones30 tends to follow suit, albeit with its own specific sector influences. The combination of a strong dollar and a weak equity market creates a challenging environment for the DowJones30.
Central Bank Watch: Navigating Inflation and Growth Dilemmas
Central bank policy remains a dominant theme influencing market dynamics, and the DowJones30 is no exception. The Federal Reserve is caught in a difficult balancing act: combating persistent inflation without triggering a severe economic downturn. The latest US economic data, including the slightly softer non-farm payrolls (Actual: 210k vs. Forecast: 211k), offers a glimmer of hope that the Fed might not need to be overly aggressive with rate hikes. However, the underlying inflationary pressures, exacerbated by rising oil prices, keep the possibility of further tightening on the table. Market participants are intensely focused on Fed communications and economic releases for any indication of a policy pivot or a continued hawkish stance.
The current market pricing reflects this uncertainty. While some anticipate a pause in rate hikes, the persistence of inflation suggests that the Fed might maintain higher rates for longer. This scenario typically weighs on equity valuations, as higher borrowing costs can impact corporate profitability and reduce the present value of future earnings. The yield curve also provides clues; if yields continue to climb, particularly on the longer end, it signals concerns about inflation and potentially slower future growth, which is bearish for stocks. For the DowJones30, any dovish signals from the Fed would be a welcome development, potentially easing pressure and allowing for a relief rally. Conversely, any indication of continued hawkishness, especially if inflation remains stubbornly high, would likely reinforce the bearish trend. The market is essentially pricing in the Fed's next move based on inflation and growth data, creating a dynamic environment for the index.
| Indicator | Value | Signal | Interpretation |
|---|---|---|---|
| RSI (1H) | 22.07 | Oversold | Potential for short-term bounce |
| MACD (1D) | Negative Momentum | Bearish | Confirms strong downtrend |
| Stochastic (1H) | %K: 2.27, %D: 10.03 | Oversold | Suggests immediate reversal possibility |
| ADX (1D) | 41.99 | Strong Trend | Indicates a firmly established downtrend |
| Bollinger Bands (1D) | Below Middle Band | Bearish | Price pressure continues |
| DXY (Daily) | 99.79 | Rising | Correlates inversely with DowJones30 |
| SP500 (Daily) | 6355.66 | Falling | Broader market weakness |
The Road Ahead: Key Levels and Outlook
Forecasting the Next Move: Technical Insights
The DowJones30's path forward hinges on its ability to navigate the critical levels established by last week's trading action. The immediate focus remains on the 1-hour resistance at $45,189.67. A successful breach of this level, sustained by healthy volume, would be the primary bullish signal, potentially initiating a short-covering rally. Such a move could target the subsequent resistance levels at $45,294.67 and $45,352.33. This scenario, however, remains a lower-probability outcome given the prevailing bearish sentiment and the strong daily downtrend indicated by the ADX at 41.99.
Conversely, the support at $45,071.33 is the linchpin for the bearish thesis. A decisive break below this level, especially a daily close, would confirm the continuation of the downtrend and likely trigger further selling. The next significant support levels to watch would be $44,781.33 on the 4-hour chart and then $44,507.67 on the 1-hour chart. The strong correlation with a rising DXY (99.79) and falling equity markets like the SP500 (6355.66) reinforces the potential for downside. Traders will be looking for confirmation through volume and price action; a breakdown below support accompanied by high volume would be a strong bearish indicator. The current market conditions suggest that any rallies are likely to be short-lived and met with selling pressure, making the downside the more probable path in the short to medium term, barring a significant shift in macroeconomic or geopolitical factors.
Economic Calendar Watchlist: What to Expect Next Week
The upcoming economic calendar, while relatively light compared to previous weeks, still holds key events that could influence the DowJones30's direction. The primary focus will be on any further data releases that shed light on inflation and the labor market. Last week's slightly softer non-farm payrolls (Actual: 210k vs. Forecast: 211k) offered a brief respite from hawkish Fed expectations, but the overall inflationary picture remains a concern. Any further data suggesting a sustained cooling of inflation could bolster hopes for a Fed pause or pivot, potentially supporting equities. Conversely, any signs of re-accelerating inflation, perhaps driven by continued oil price strength, would likely reinforce the bearish sentiment and pressure the DowJones30.
Investors will also be scrutinizing any commentary from Federal Reserve officials for insights into future monetary policy. Given the current economic climate of stagflation fears, the Fed's communication will be critical. Market participants will be looking for guidance on whether the central bank will prioritize combating inflation with further rate hikes or shift its focus towards supporting economic growth. The interplay between these macroeconomic factors and geopolitical developments will create a dynamic trading environment. While there are no high-impact events scheduled for today (Sunday), the market will be positioned for the week ahead, with traders closely watching for any news that could influence the DowJones30's trajectory around the key levels of $45,071.33 (support) and $45,189.67 (resistance).
The Importance of Risk Management in Volatile Markets
In the current market environment, characterized by significant volatility and conflicting signals surrounding the DowJones30 at $45,071.45, robust risk management is not just advisable - it is essential. The strong daily downtrend (ADX 41.99) coupled with short-term oversold conditions creates a high probability of sharp, unpredictable price swings. For traders considering positions, defining risk parameters before entering any trade is paramount. This means setting clear stop-loss levels to limit potential losses if the market moves against the desired direction.
For those anticipating a bearish move, a break below the $45,071.33 support level could be a trigger, but a stop-loss placed just above this broken level or at the next immediate resistance ($45,189.67) would be crucial to manage risk. For the few looking for a bullish bounce, entering long only after a confirmed break above $45,189.67, with a stop-loss placed just below $45,071.33, would be a more prudent approach. The high probability of whipsaws in such a market means that even well-founded trades can be stopped out prematurely. Therefore, position sizing is equally important. Risking only a small percentage of trading capital on any single trade ensures that a few adverse outcomes do not derail the entire portfolio. Patience is also a virtue; waiting for high-probability setups with favorable risk-reward ratios, rather than chasing every price movement, is key to long-term success in these challenging markets. The prevailing risk-off sentiment, driven by DXY strength (99.79) and equity weakness (SP500 at 6355.66), further underscores the need for caution.
Frequently Asked Questions: DowJones30 Analysis
What happens if the DowJones30 breaks decisively below the $45,071.33 support level?
A confirmed daily close below $45,071.33 would validate the strong bearish trend indicated by the daily ADX of 41.99. This would likely trigger further selling, with the next key support target at $44,781.33 on the 4-hour chart. Such a move would reinforce the stagflationary concerns and risk-off sentiment in the broader market.
Is the RSI at 22.07 a strong buy signal for the DowJones30 at $45,071.45?
An RSI of 22.07 on the 1-hour chart indicates oversold conditions, which could lead to a short-term bounce. However, it is not a strong buy signal on its own, especially given the dominant daily downtrend (ADX 41.99). A confirmed break above the immediate 1-hour resistance at $45,189.67 would be needed for a more reliable bullish signal.
How does the current DXY level of 99.79 impact the DowJones30 outlook?
The rising DXY at 99.79 typically correlates inversely with the DowJones30. A stronger dollar can signal capital flowing into safe-haven assets, increasing pressure on equities. This reinforces the bearish outlook for the DowJones30, suggesting that rallies may be short-lived as long as the dollar remains strong.
Should traders anticipate a continuation of the downtrend or a reversal at the current $45,071.45 level for the DowJones30?
The prevailing technical picture, with a strong daily downtrend (ADX 41.99) and bearish momentum confirmed by the daily MACD, suggests a higher probability of trend continuation. While a short-term bounce from oversold 1-hour RSI (22.07) is possible, any upward moves are likely to face significant resistance, making a reversal less probable without a clear shift in macro drivers or a decisive break of key resistance levels.
Track markets in real-time
AI-powered analysis, technical indicators and real-time price data.
Join Our Telegram Channel
Breaking market news, AI analysis and trading signals instantly.
Join Channel