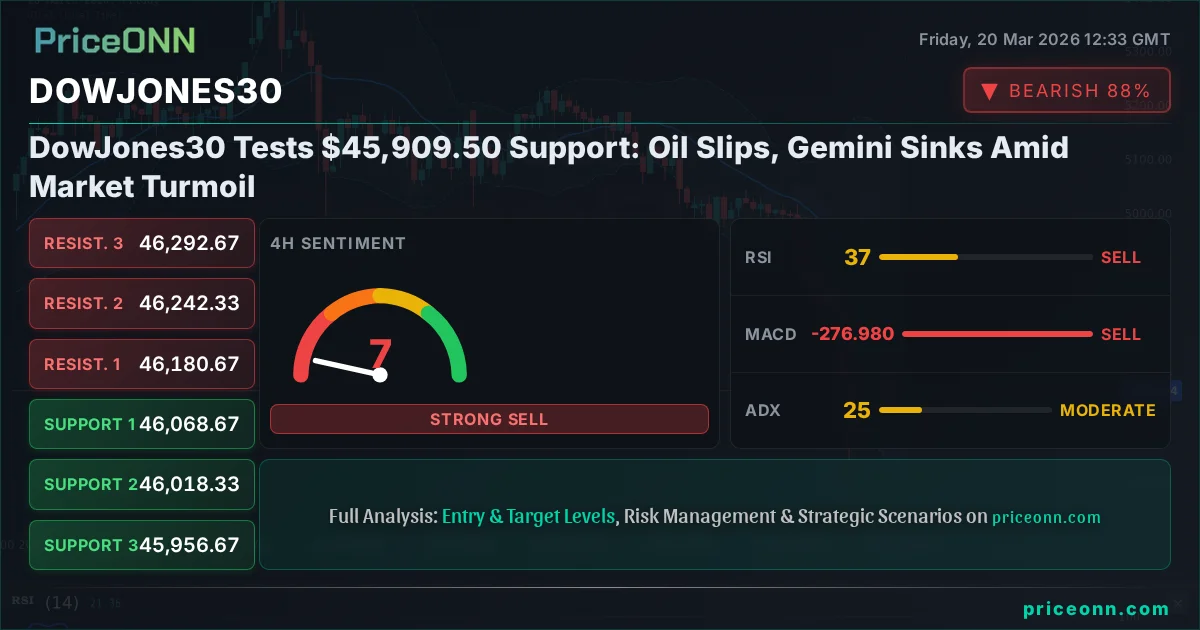
The Dow Jones Industrial Average is currently navigating a critical juncture, hovering around the $45,909.50 mark. This level represents more than just a price point; it's a battleground where recent market anxieties are clashing with lingering fundamental strengths. As traders eye this pivotal support, a confluence of factors - from slipping oil prices to the dramatic fall of Gemini's stock post-IPO - is painting a complex picture of investor sentiment and economic undercurrents. The question on everyone's mind isn't just where the Dow will go next, but what these disparate market movements are telling us about the broader economic landscape and the path forward for risk assets.
- The DowJones30 is testing critical support near $45,909.50, with immediate downside risk to $45,771.67.
- RSI at 40.43 on the 1H chart signals bearish momentum, while the 1D ADX at 41.59 indicates a strong downtrend.
- Brent crude oil is trading at $107.17, slipping from highs, potentially easing inflation concerns but signaling demand weakness.
- Gemini's stock crash post-IPO highlights regulatory risks and speculative bubbles in certain tech sectors, impacting overall risk appetite.
- Upcoming economic data, particularly employment figures, will be crucial in determining the Dow's next move.
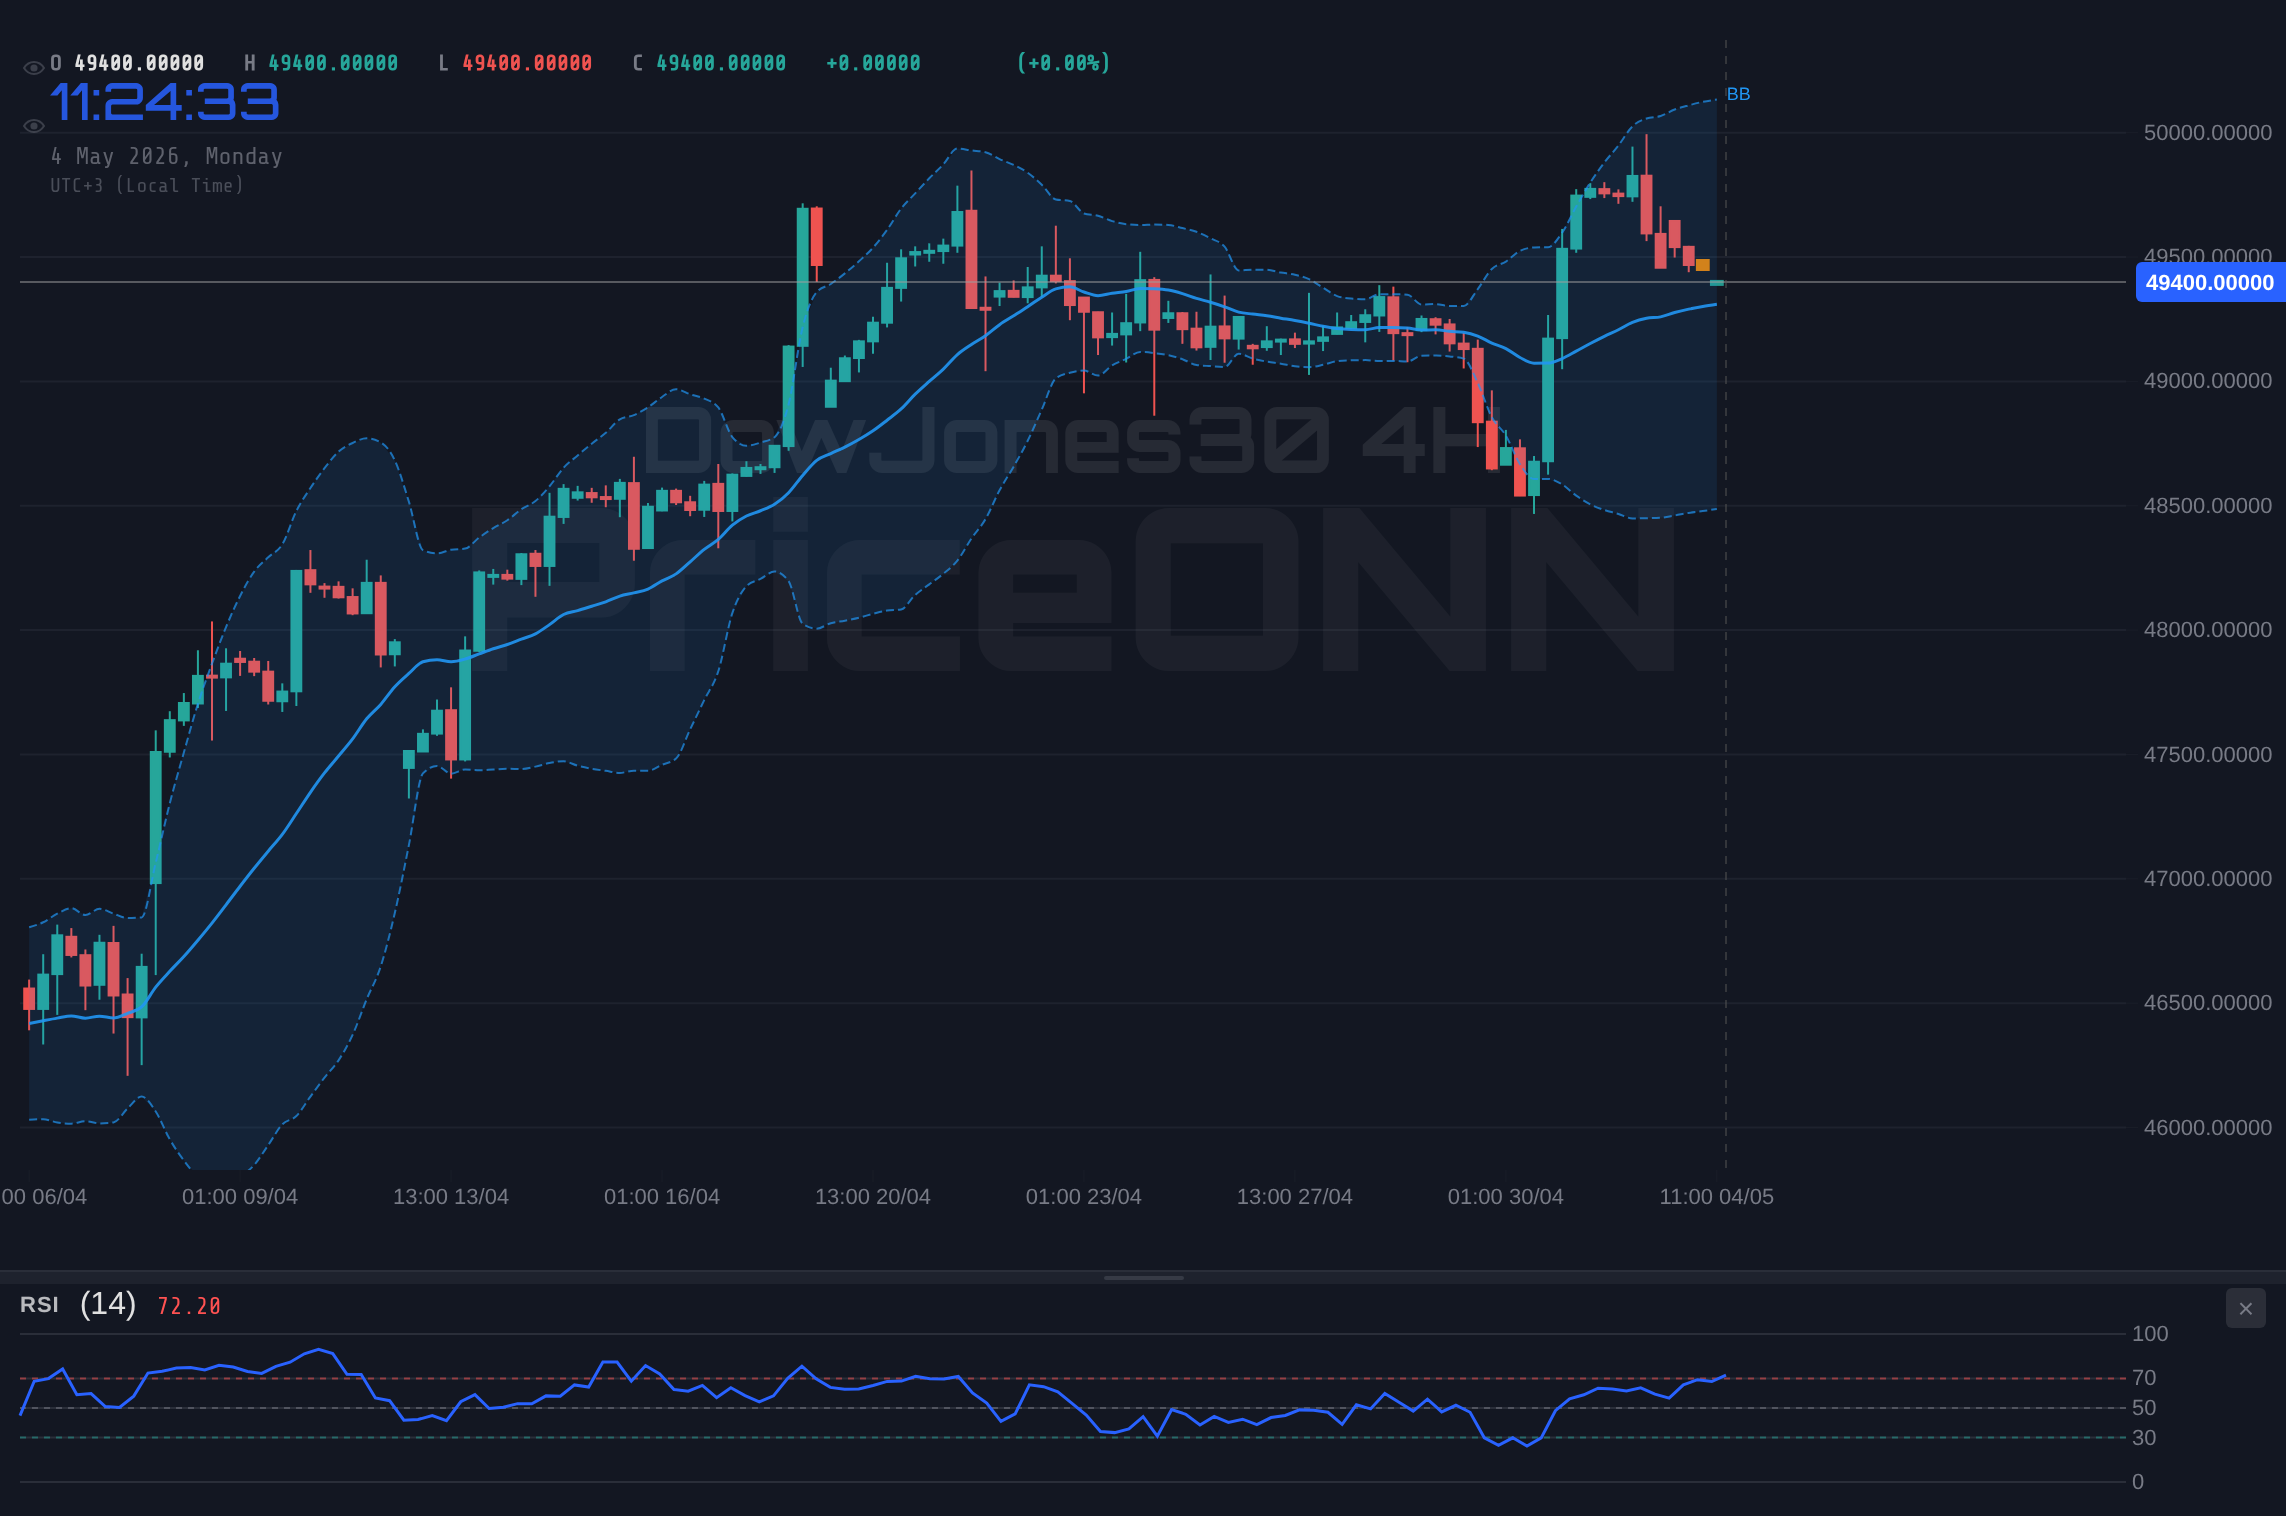
The Dow Jones Industrial Average's current position around $45,909.50 is a significant technical and psychological level. After a period of upward momentum, the index has shown signs of fatigue, with a notable pullback this week. The daily change of -0.38% (-$175.5) brings the index closer to key support levels, prompting a closer look at the underlying drivers. The 1H chart shows a downtrend with 100% strength, RSI at 40.43 indicating bearish momentum, and ADX at 29.51 confirming a strong trend. This technical setup suggests that while $45,909.50 is a psychological level, the path of least resistance might be downwards, with immediate support found at $45,771.67 and $45,627.67 on the 1D timeframe. The failure to hold above the $46,074.33 resistance on the 1H chart is particularly concerning for bulls.
Adding to the cautious sentiment is the dynamic in the energy markets. Brent crude, a key indicator of global inflation and geopolitical stability, has seen a pullback, currently trading at $107.17. While a dip in oil prices might seem like good news for inflation-weary economies, its rapid descent from recent highs warrants attention. The 1H chart shows a neutral trend, but the 4H indicates a bullish trend with RSI at 53.07, suggesting underlying strength that could reassert itself. However, the 1D chart shows a strong bullish trend (ADX 65.23), but with RSI at 78.87, it's entering overbought territory, signaling potential for a pullback or consolidation. This volatility in oil prices creates uncertainty, impacting corporate costs and consumer spending, and consequently, the broader market's outlook.
The tech sector, often a bellwether for risk appetite, is also flashing warning signs. The dramatic news surrounding Gemini's stock plummeting over 80% post-IPO is a stark reminder of the speculative froth that can build up in certain market segments. Reports indicate a class-action lawsuit alleging misleading IPO statements following a rapid pivot to a prediction market model. This event, while specific to Gemini, can have a chilling effect on investor sentiment towards speculative tech ventures. Such high-profile failures often lead to a broader risk-off sentiment, where investors flee to perceived safe-haven assets and shy away from growth stocks, potentially putting further pressure on indices like the Dow Jones.
The correlation between the US Dollar Index (DXY) and major indices like the Dow Jones cannot be overstated. Currently, the DXY is showing a mixed picture, with a strong 1D uptrend (ADX 34.64) but a neutral 1H trend. The 1D RSI at 56.1 suggests upward momentum, but the 1H RSI at 44.41 indicates a pullback. This divergence means the dollar's influence on the market could be nuanced. Historically, a strengthening dollar tends to put pressure on US equities as it makes dollar-denominated assets more expensive for foreign buyers and can signal tighter global liquidity. Conversely, a weakening dollar can sometimes support equity markets. The current DXY price around 99.12, sitting below its 1D resistance of 99.72, suggests room for further dollar strength, which could act as a headwind for the Dow Jones.
Looking at other major indices provides further context for the Dow's current predicament. The S&P 500 is trading at 6587.05, down 0.44%, and the Nasdaq 100 is at 24258.14, down 0.56%. Both are in clear downtrends on the 1H and 1D charts, with significant bearish signals. The S&P 500's 1D ADX at 44.21 indicates a strong downtrend, and RSI at 35.05 is in oversold territory, suggesting potential for a bounce but confirming the prevailing bearish sentiment. The Nasdaq 100 mirrors this weakness, with its 1D ADX at 35.59 and RSI at 40.54. This broad weakness across major US equity benchmarks reinforces the idea that the Dow Jones's struggle near $45,909.50 is not an isolated event but part of a larger market correction driven by concerns over inflation, interest rates, and geopolitical risks.
The fundamental drivers behind this market sentiment are multifaceted. Persistent inflation, despite the slight easing in oil prices, continues to be a concern, keeping the Federal Reserve's monetary policy in focus. While recent data might suggest a pause in rate hikes, the possibility of future tightening or a prolonged period of higher rates weighs on corporate valuations and economic growth expectations. Upcoming economic data, such as employment figures, will be critical. Stronger-than-expected jobs reports could reignite inflation fears and prompt a more hawkish stance from the Fed, while weaker numbers might signal a slowing economy, leading to a potential shift in market expectations towards rate cuts sooner rather than later. The market's current sensitivity to every data point means significant volatility is likely.
The strength of the Japanese Yen (USD/JPY) also offers clues about global risk sentiment. The pair has seen significant moves, with recent Yen strength pushing USD/JPY down sharply. Currently trading around 158.556, the daily increase of 0.51% shows a recent rebound, but the conflicting signals across timeframes (neutral 1H, strong 1D uptrend with RSI 56.56) suggest an ongoing tug-of-war. Historically, a strong Yen often accompanies a 'risk-off' environment, as Japanese investors repatriate funds, and a weaker Yen can signal increased global risk appetite. The current choppy action in USD/JPY reflects this underlying uncertainty, mirroring the Dow's own indecision.
Precious metals are also telling a story. Gold prices have experienced a sharp downturn, plunging over 4.5% recently, trading near $4,500 after a disorderly decline. The current price is $4675.61, with a 1H trend showing a strong downtrend (ADX 31.54) and RSI at 46.6. The 4H chart shows a very strong downtrend (ADX 62.34), with RSI at 27.96, indicating oversold conditions but confirming the bearish pressure. This sharp fall in gold, often seen as a safe-haven asset, suggests that investors might be liquidating assets across the board, or perhaps reallocating capital in response to changing interest rate expectations or a perceived strengthening of the US dollar. The conflict between its safe-haven status and its recent price action highlights the complex risk dynamics at play.
Silver (XAGUSD) is also under pressure, currently at $72.11, down 0.9%. The 1H chart shows a strong downtrend (ADX 29.36) and RSI at 46.38. The 4H shows a very strong downtrend (ADX 56.71) with RSI at 35, reinforcing the bearish momentum. Like gold, silver's decline indicates broad weakness in commodity markets, possibly linked to slowing industrial demand expectations or a stronger dollar. The interplay between gold and silver prices, and their correlation with industrial metals, can offer insights into the health of the global manufacturing sector, which is a key component of economic growth and, by extension, the Dow Jones's performance.
The current market environment demands a disciplined approach. The Dow Jones Industrial Average at $45,909.50 is at a critical support level, but the technical indicators and broader market signals suggest caution. A break below $45,771.67 could trigger further selling pressure, potentially targeting $45,627.67. Conversely, a sustained hold above $45,909.50, coupled with a turnaround in risk sentiment and positive economic data, could pave the way for a retest of resistance levels around $45,899.33 or even higher. However, given the prevailing downtrends in many related markets, a bullish reversal would require a significant shift in macro-economic narratives or a clear signal from upcoming economic events.
The recent news regarding China's massive investment in critical minerals ($120 billion since 2023) is a long-term structural factor that could influence commodity prices and global supply chains. While its immediate impact on the Dow Jones might be indirect, it underscores the geopolitical shifts occurring in resource markets. This strategic investment by Beijing aims to reshape global energy supply chains, potentially impacting the future demand for certain commodities and the performance of related equities. Understanding these macro-level shifts is crucial for a comprehensive view beyond short-term price action.
The sell-off in gold below $4,650, trading near $4,640, as mentioned in recent reports, linked to soaring energy costs and inflation, highlights the complex relationship between energy prices, inflation, and safe-haven assets. While rising energy costs often correlate with inflation, gold’s sharp drop suggests that other factors, such as rising interest rate expectations or dollar strength, might be overriding the traditional inflation hedge narrative for now. This dynamic is critical for understanding how different asset classes are reacting to the prevailing economic conditions.
The technical outlook for the Dow Jones Industrial Average at $45,909.50 is currently leaning bearish, given the confluence of weak technical signals across multiple timeframes and negative sentiment in correlated markets. The strong downtrend indicated by the 1D ADX at 41.59, coupled with an RSI at 27.68 on the 1D chart suggesting oversold conditions but within a strong downtrend, points to potential downside. The immediate focus will be on whether the $45,909.50 level holds. A sustained break below this could accelerate declines, while a strong reversal would require a significant shift in market sentiment, likely driven by upcoming economic data or a change in central bank rhetoric. Traders should remain vigilant, manage risk tightly, and await clearer signals before committing to major positions.
Bearish Scenario: Support Break and Downside Acceleration
65% ProbabilityNeutral Scenario: Consolidation Around $45,909.50
25% ProbabilityBullish Scenario: Rejection of Lower Levels and Rebound
10% ProbabilityFrequently Asked Questions: DowJones30 Analysis
What happens if DowJones30 breaks below the $45,909.50 support level?
A break below $45,909.50 could trigger further selling, with immediate downside targets at $45,771.67 and potentially $45,627.67. This would likely be driven by continued bearish momentum indicated by the 1D ADX at 41.59 and a negative RSI reading.
Should I consider buying DowJones30 at current levels around $45,909.50 given the oversold RSI on the 1D chart?
While the 1D RSI at 27.68 suggests oversold conditions, the strong 1D downtrend (ADX 41.59) and bearish signals on shorter timeframes indicate caution. A high-probability buy signal would require confirmation of a reversal, such as holding $45,771.67 and breaking key resistance levels, rather than relying solely on the oversold RSI.
Is the RSI at 40.43 on the 1H chart a strong sell signal for DowJones30?
An RSI of 40.43 on the 1H chart indicates bearish momentum, but it is not yet in extreme oversold territory. Combined with the strong 1H downtrend confirmed by ADX 29.51 and the break below $45,909.50, it reinforces the bearish outlook. However, a confirmed sell signal would ideally involve MACD crossover or a break of further support levels.
How will upcoming employment data impact the DowJones30's movement around $45,909.50?
Stronger-than-expected employment figures could reignite inflation concerns and Fed tightening expectations, potentially pushing the Dow Jones below $45,909.50. Conversely, weaker data might signal economic slowdown, prompting a risk-on rally if it increases rate cut expectations. The market's reaction will depend heavily on the magnitude of the surprise and current Fed sentiment.
Technical Outlook Summary
| Indicator | Value | Signal | Interpretation |
|---|---|---|---|
| RSI (14) | 40.43 | Bearish | Bearish momentum on 1H chart. |
| MACD Histogram | Negative | Bearish | Negative momentum confirmed on 1H. |
| Stochastic | K=25.42, D=34.2 | Bearish | Bearish crossover on 1H, indicating downtrend. |
| ADX | 29.51 | Strong Trend | Strong downtrend on 1H chart. |
| Bollinger | Middle Band | Below Band | Price is below the middle band on 1H, indicating bearish pressure. |
Key Levels
Support Levels
Resistance Levels
Track markets in real-time
AI-powered analysis, technical indicators and real-time price data.
Join Our Telegram Channel
Breaking market news, AI analysis and trading signals instantly.
Join Channel