The Dow Jones Industrial Average is currently hovering around the critical $46,144 level, a pivotal point where market sentiment is being tested by a confluence of bearish factors. A sharp surge in Brent crude prices, now nearing $114.39, coupled with a strengthening US Dollar Index (DXY) to 100.02, is painting a cautious picture for risk assets. This complex interplay of energy shocks, currency movements, and broader market sentiment demands a granular look at the technical landscape to decipher potential trading opportunities and risks.
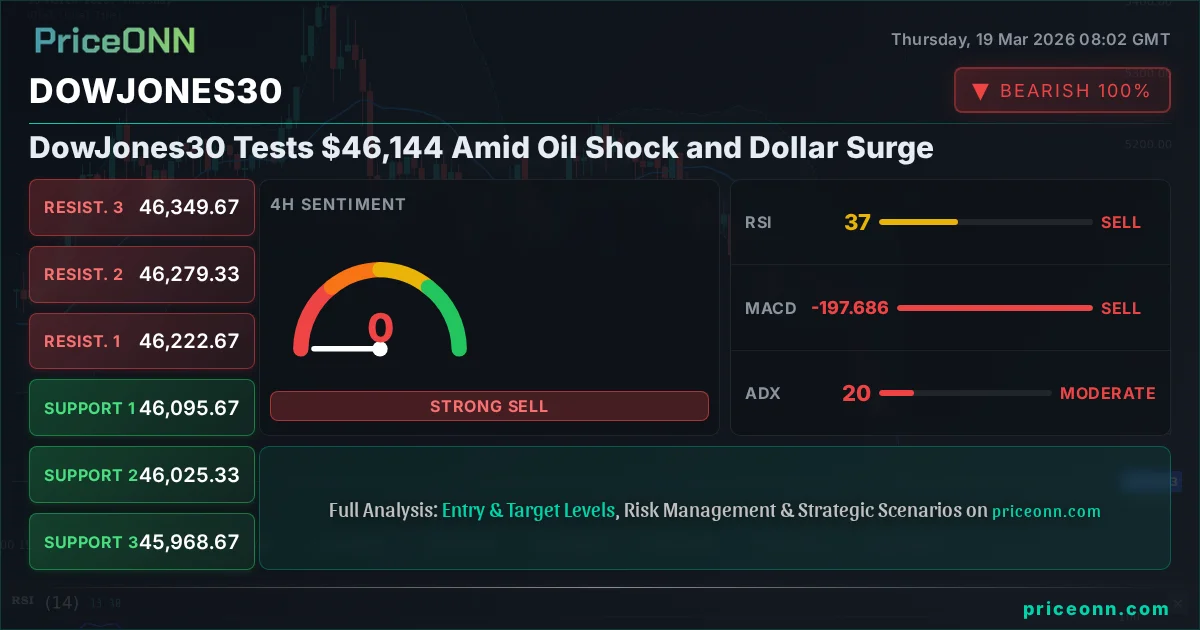
- DowJones30 is trading at $46,144, with 1H and 4H charts showing a bearish trend.
- Key support for the DowJones30 sits at $46,075.67, while immediate resistance is at $46,295.33.
- Brent crude is surging towards $114.39, indicating rising inflation expectations and geopolitical risk premium.
- The DXY at 100.02 is strengthening, putting pressure on global risk assets.
The Bear's Grip Tightens: DowJones30 Under Pressure
Navigating the Sell-Off at $46,144
The Dow Jones Industrial Average (DJIA) is currently grappling with significant selling pressure, trading precariously close to the $46,144 mark. This level represents a crucial battleground, and the prevailing technical indicators across multiple timeframes suggest that bears are gaining the upper hand. The 1-hour chart paints a decidedly bearish picture, with a strong downward trend indicated by an ADX reading of 47.94. This isn't just a minor dip; it signals a robust trend that traders are currently riding. The RSI(14) at 30.91, while nearing oversold territory, still indicates downward momentum, suggesting that further downside might be on the cards before any meaningful bounce can occur. The MACD also remains in negative territory, reinforcing the bearish sentiment. This technical setup on the shorter timeframe implies that any rallies are likely to be met with selling interest, especially as we approach the immediate resistance level of $46,295.33.
4-Hour Chart: A Clear Downtrend Confirmation
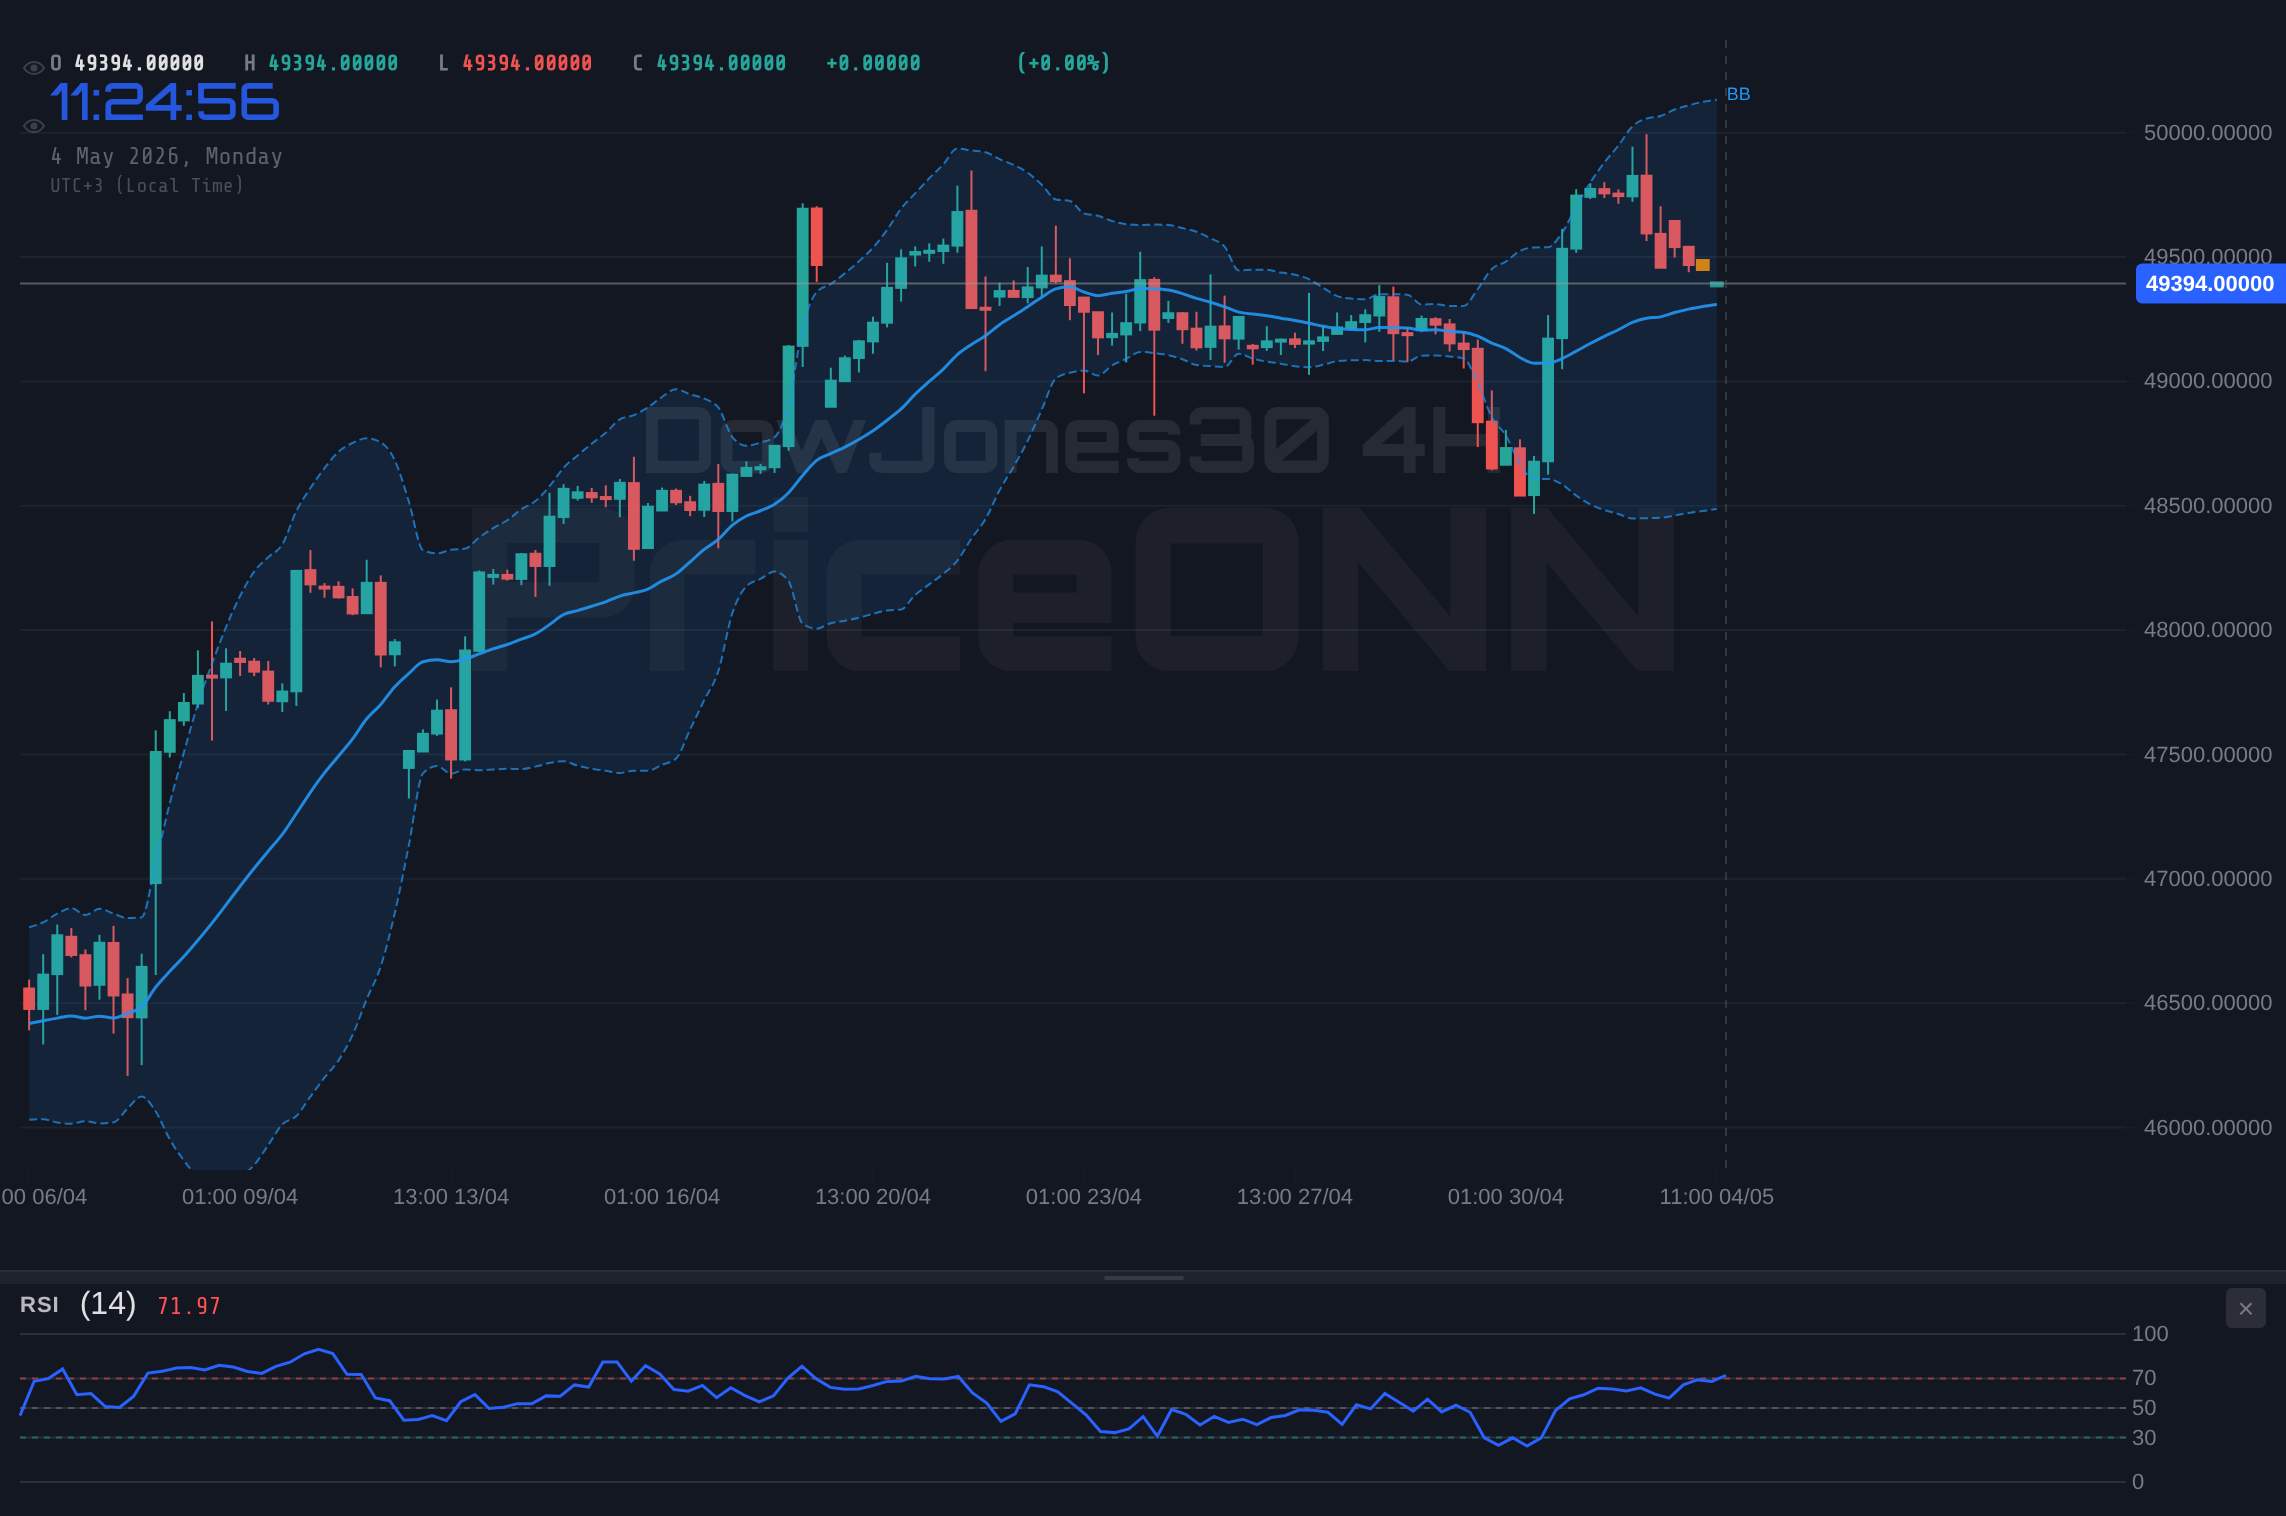
Zooming out to the 4-hour timeframe, the bearish narrative for the DowJones30 becomes even more pronounced. The trend is firmly established as downwards, with a strength of 85%, and the ADX at 20 suggests a moderate but persistent trend. The RSI(14) is sitting at 36.61, further confirming the prevailing bearish momentum without being in extreme oversold territory, which could imply room for further decline. The MACD indicator continues to show negative momentum, with the MACD line below the signal line, a classic bearish signal. Bollinger Bands are also signaling a downward bias, with the price trading below the middle band. This suggests that the market is currently favoring sellers, and the path of least resistance appears to be downwards. Traders are watching the support levels closely, with the first significant floor identified at $46,095.67. A break below this level could accelerate the sell-off, targeting subsequent support zones.
Daily Timeframe: The Bigger Picture
On the daily chart, the DowJones30 is showing a strong downtrend with 95% strength, though the ADX at 39.99 points to a strong trend, it is not extremely high. The RSI(14) is at 29.7, firmly in the oversold territory, which historically can signal a potential for a bounce or reversal. However, oversold conditions alone are not a buy signal; they merely indicate that the selling has been intense. The MACD histogram is negative, confirming the bearish pressure, and the price is trading below the middle Bollinger Band, which is consistent with a downtrend. Stochastic indicators are also deeply oversold, with %K at 11.16 and %D at 19.06. While this suggests a potential for a technical bounce, the overall trend is still bearish. The critical support level to watch on the daily chart is $45,645.67. A decisive break below this level would signal a deeper correction, potentially opening the door for further declines towards $45,217.33 and $44,389.67. The current price action around $46,144 suggests a tug-of-war, but the longer-term trend and the pressure from other markets are undeniable headwinds.
External Forces Shaping the DowJones30
The Oil Shock: Brent Crude's Impact on Inflation and Risk Appetite
The surge in Brent crude oil prices, now trading around $114.39, is a significant development that cannot be ignored. This sharp increase, driven by escalating geopolitical tensions in the Middle East as reported by sources like Reuters and Bloomberg, injects a potent dose of inflation fears into the market. Higher oil prices have a ripple effect across the economy, increasing transportation costs, manufacturing expenses, and ultimately consumer prices. This inflationary pressure is a major concern for central banks, particularly the Federal Reserve, which has been trying to bring inflation under control. The market's reaction to this oil shock is palpable; risk appetite is visibly souring. When oil prices spike like this, especially amid geopolitical uncertainty, investors tend to flee from riskier assets like equities and seek refuge in safer havens. The DowJones30, as a major stock market index, is highly susceptible to these shifts in risk sentiment. The fact that Brent is significantly outpacing WTI, as noted in market reports, suggests specific supply concerns or geopolitical risk premiums being priced into European benchmarks, potentially widening spreads and adding further volatility.
The Dollar's Ascent: DXY Strength and its Implications
Complementing the pressure from oil prices, the US Dollar Index (DXY) has shown considerable strength, currently trading at 100.02. This rise in the dollar is a double-edged sword for the DowJones30. On one hand, a stronger dollar can make US exports more expensive, potentially hurting multinational corporations within the index. On the other hand, it reflects a 'flight to safety' as global investors seek the perceived stability of the US dollar amidst geopolitical turmoil and economic uncertainty. The Federal Reserve's recent hawkish pause, signaling fewer rate cuts for 2026 than previously anticipated, is also a key driver behind the dollar's strength. As noted in market commentary, this policy stance makes the dollar more attractive relative to other currencies. A consistently strengthening dollar often correlates with pressure on global equity markets, as it makes dollar-denominated assets more expensive for foreign buyers and can tighten global financial conditions. The DXY's upward trajectory is a clear signal that global risk aversion is increasing, directly impacting the DowJones30 by increasing the cost of capital and potentially dampening corporate earnings for international businesses.
The Fed's Shadow: Interest Rates and Future Policy
The Federal Reserve's recent monetary policy decisions and forward guidance continue to cast a long shadow over the markets. While the Fed maintained interest rates in its latest meeting, the commentary surrounding inflation and future rate cuts has been more hawkish than many anticipated. This stance, signaling potentially fewer rate cuts in 2026, directly impacts the cost of borrowing for companies within the DowJones30. Higher interest rates can reduce corporate profitability by increasing debt servicing costs and can also make equity valuations less attractive compared to fixed-income alternatives. Market participants are closely watching Fed Fund Futures and OIS rates for clues on future policy moves. Any indication that the Fed is leaning towards a prolonged period of higher-for-longer rates could further dampen investor sentiment and weigh on the DowJones30. The current market pricing reflects this uncertainty, and any data that reinforces inflationary pressures, such as the recent strong PPI figures, will likely keep the Fed on a cautious path, potentially limiting any upside for equities in the near term.
DowJones30: Crafting a Trading Plan Across Scenarios
Given the interplay of bearish technical signals, rising oil prices, a strengthening dollar, and a hawkish Fed stance, developing a clear trading plan is paramount. The market is currently presenting a complex picture, and it's essential to consider multiple potential outcomes. We need to define precise triggers, invalidation points, and price targets for each scenario to navigate this volatility effectively. The following three scenarios - bearish, neutral, and bullish - provide a framework for understanding the potential paths forward for the DowJones30, acknowledging the probabilities associated with each based on current data and market conditions.
The Bearish Path: Downside Targets Beckon
65% ProbabilityConsolidation Zone: The Waiting Game
25% ProbabilityThe Bullish Rebound: A Short-Lived Hope?
10% ProbabilityThe Indicator Dashboard: Gauging Market Strength
To further refine our understanding of the DowJones30's current state, let's examine the key technical indicators across different timeframes. The data consistently points towards bearish momentum on shorter timeframes, with some conflicting signals on the daily chart that warrant attention. Understanding these readings is crucial for aligning our trading strategy with the prevailing market conditions and the probabilities assigned to each scenario.
| Indicator | Value | Signal (1H/4H/1D) | Interpretation |
|---|---|---|---|
| RSI (14) | 30.91 / 36.61 / 29.70 | Bearish / Bearish / Bearish | While daily RSI is oversold, shorter timeframes show continued downward pressure. |
| MACD Histogram | Negative / Negative / Negative | Bearish / Bearish / Bearish | Consistent negative momentum across all analyzed timeframes. |
| Stochastic (%K/%D) | 42.87/39.87 / 6.48/31.27 / 11.16/19.06 | Bullish / Bearish / Bearish | Conflicting signals: 1H shows potential for a bounce, while 4H and Daily are deeply oversold/bearish. |
| ADX | 47.94 / 20.00 / 39.99 | Strong Trend / Moderate Trend / Strong Trend | Strong trend indicated on 1H and Daily, moderate on 4H, confirming directional bias. |
| Bollinger Bands | Below Mid / Below Mid / Below Mid | Neutral / Neutral / Neutral | Price consistently trading below the middle band signals bearish pressure. |
What's Driving the Bearish Bias?
The confluence of indicators strongly suggests a bearish bias, particularly on the shorter timeframes. The ADX readings of 47.94 on the 1H chart and 39.99 on the Daily chart indicate robust trends, with the current momentum favoring the downside. The MACD histogram's consistent negativity across all timeframes reinforces this view, signaling that selling pressure is dominant. While the Stochastic oscillator on the 1H chart shows a potential for a short-term bounce (K > D), the deeper oversold conditions on the 4H and Daily charts, coupled with the overall trend strength, suggest that any such bounces are likely to be short-lived and met with resistance. The RSI readings, while low, have not yet reached extreme levels that would guarantee a reversal, especially given the strong trend indicated by the ADX. The price action itself, consistently trading below the middle Bollinger Band on all analyzed timeframes, confirms the prevailing bearish sentiment.
The Path Forward: What to Watch This Week
As we navigate the current market environment for the DowJones30, attention must remain sharply focused on key price levels and external catalysts. The $46,075.67 support level on the 4-hour chart is the immediate line in the sand. A decisive break below this level would validate the primary bearish scenario, potentially triggering a cascade of sell orders. Conversely, a sustained move above the $46,295.33 resistance on strong volume could signal a shift, though given the current macroeconomic backdrop, such a move would likely face immediate headwinds. Traders must remain vigilant about the price action around $46,144, as this level is currently acting as a pivot point. The ongoing geopolitical tensions impacting oil prices and the Federal Reserve's stance on inflation and interest rates will be critical drivers throughout the week. Any unexpected news from these fronts could quickly invalidate current technical setups and force a re-evaluation of market direction.
Patience will be rewarded here. The market is currently presenting a clear directional bias on shorter timeframes, but the daily oversold conditions and the broader macroeconomic uncertainties create a complex picture. Stick to your trading plan, manage risk meticulously, and wait for clear confirmation before committing to a trade. The market always offers opportunities, but seizing them requires discipline and a clear understanding of the prevailing conditions. Remember, the trend is your friend until it ends - and right now, the trend on the shorter frames is decidedly down.
Technical Outlook Summary
| Indicator | Value | Signal | Interpretation |
|---|---|---|---|
| RSI (14) | 30.91 / 36.61 / 29.70 | Bearish / Bearish / Bearish | Daily RSI is oversold, but shorter timeframes show continued downward pressure. |
| MACD Histogram | Negative / Negative / Negative | Bearish / Bearish / Bearish | Consistent negative momentum across all analyzed timeframes. |
| Stochastic (%K/%D) | 42.87/39.87 / 6.48/31.27 / 11.16/19.06 | Conflicting / Bearish / Bearish | 1H shows potential bounce, 4H/Daily deeply oversold/bearish. |
| ADX | 47.94 / 20.00 / 39.99 | Strong Trend / Moderate Trend / Strong Trend | Confirms directional bias, favoring downside on shorter timeframes. |
| Bollinger Bands | Below Mid / Below Mid / Below Mid | Bearish / Bearish / Bearish | Price consistently below the middle band signals bearish pressure. |
Key Levels
Frequently Asked Questions: DowJones30 Analysis
What happens if DowJones30 breaks below $46,095.67?
A break below $46,095.67 on the 4-hour chart would validate the bearish scenario, targeting $46,075.67 and potentially $45,968.67. This would signal a continuation of the downtrend driven by macroeconomic pressures.
Should I buy DowJones30 at current levels of $46,144 given the oversold daily RSI?
Buying at current levels is risky due to bearish signals on shorter timeframes and strong external pressures. A confirmed bullish trigger, like a close above $46,295.33 with strong volume, is needed. Otherwise, waiting for a test of lower support levels or a clear trend reversal is advisable.
Is the Stochastic's conflicting signal on the 1H chart a buy signal for DowJones30?
The 1H Stochastic showing %K above %D suggests a potential short-term bounce. However, this signal is contradicted by bearish MACD and ADX readings, and the overall downtrend on longer timeframes. It's not a standalone buy signal and requires confirmation.
How will rising Brent crude prices and a strong DXY affect DowJones30 this week?
Rising Brent crude prices ($114.39) increase inflation fears, while a strong DXY (100.02) indicates risk aversion. Both factors exert downward pressure on the DowJones30, potentially exacerbating any sell-off and making rallies less likely without a significant shift in market sentiment or Fed policy expectations.
Track markets in real-time
AI-powered analysis, technical indicators and real-time price data.
Join Our Telegram Channel
Breaking market news, AI analysis and trading signals instantly.
Join Channel