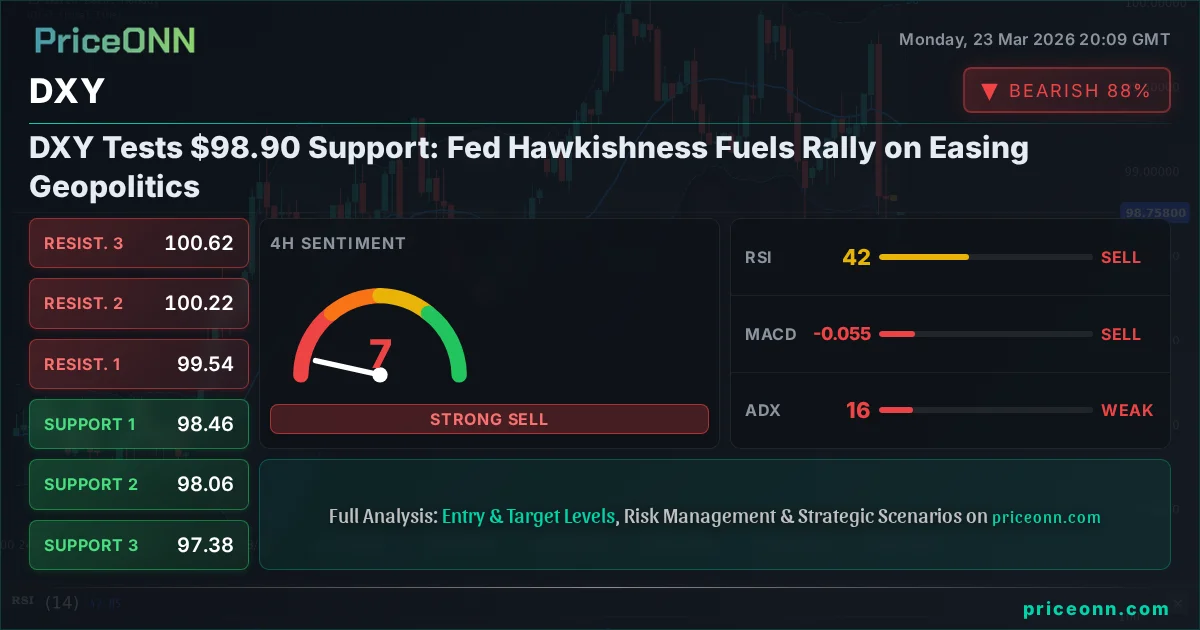
The Dollar Index (DXY) is currently navigating a critical juncture, hovering precariously around the $98.90 mark. This level, a confluence of technical support and shifting market sentiment, is drawing intense scrutiny from traders worldwide. With the Federal Reserve maintaining a hawkish undertone and geopolitical tensions showing signs of de-escalation, the DXY finds itself at a crossroads, prompting a robust debate between bulls and bears. This analysis delves into the competing forces shaping the DXY's trajectory, examining the technical underpinnings, fundamental drivers, and the crucial levels that will dictate its next major move.
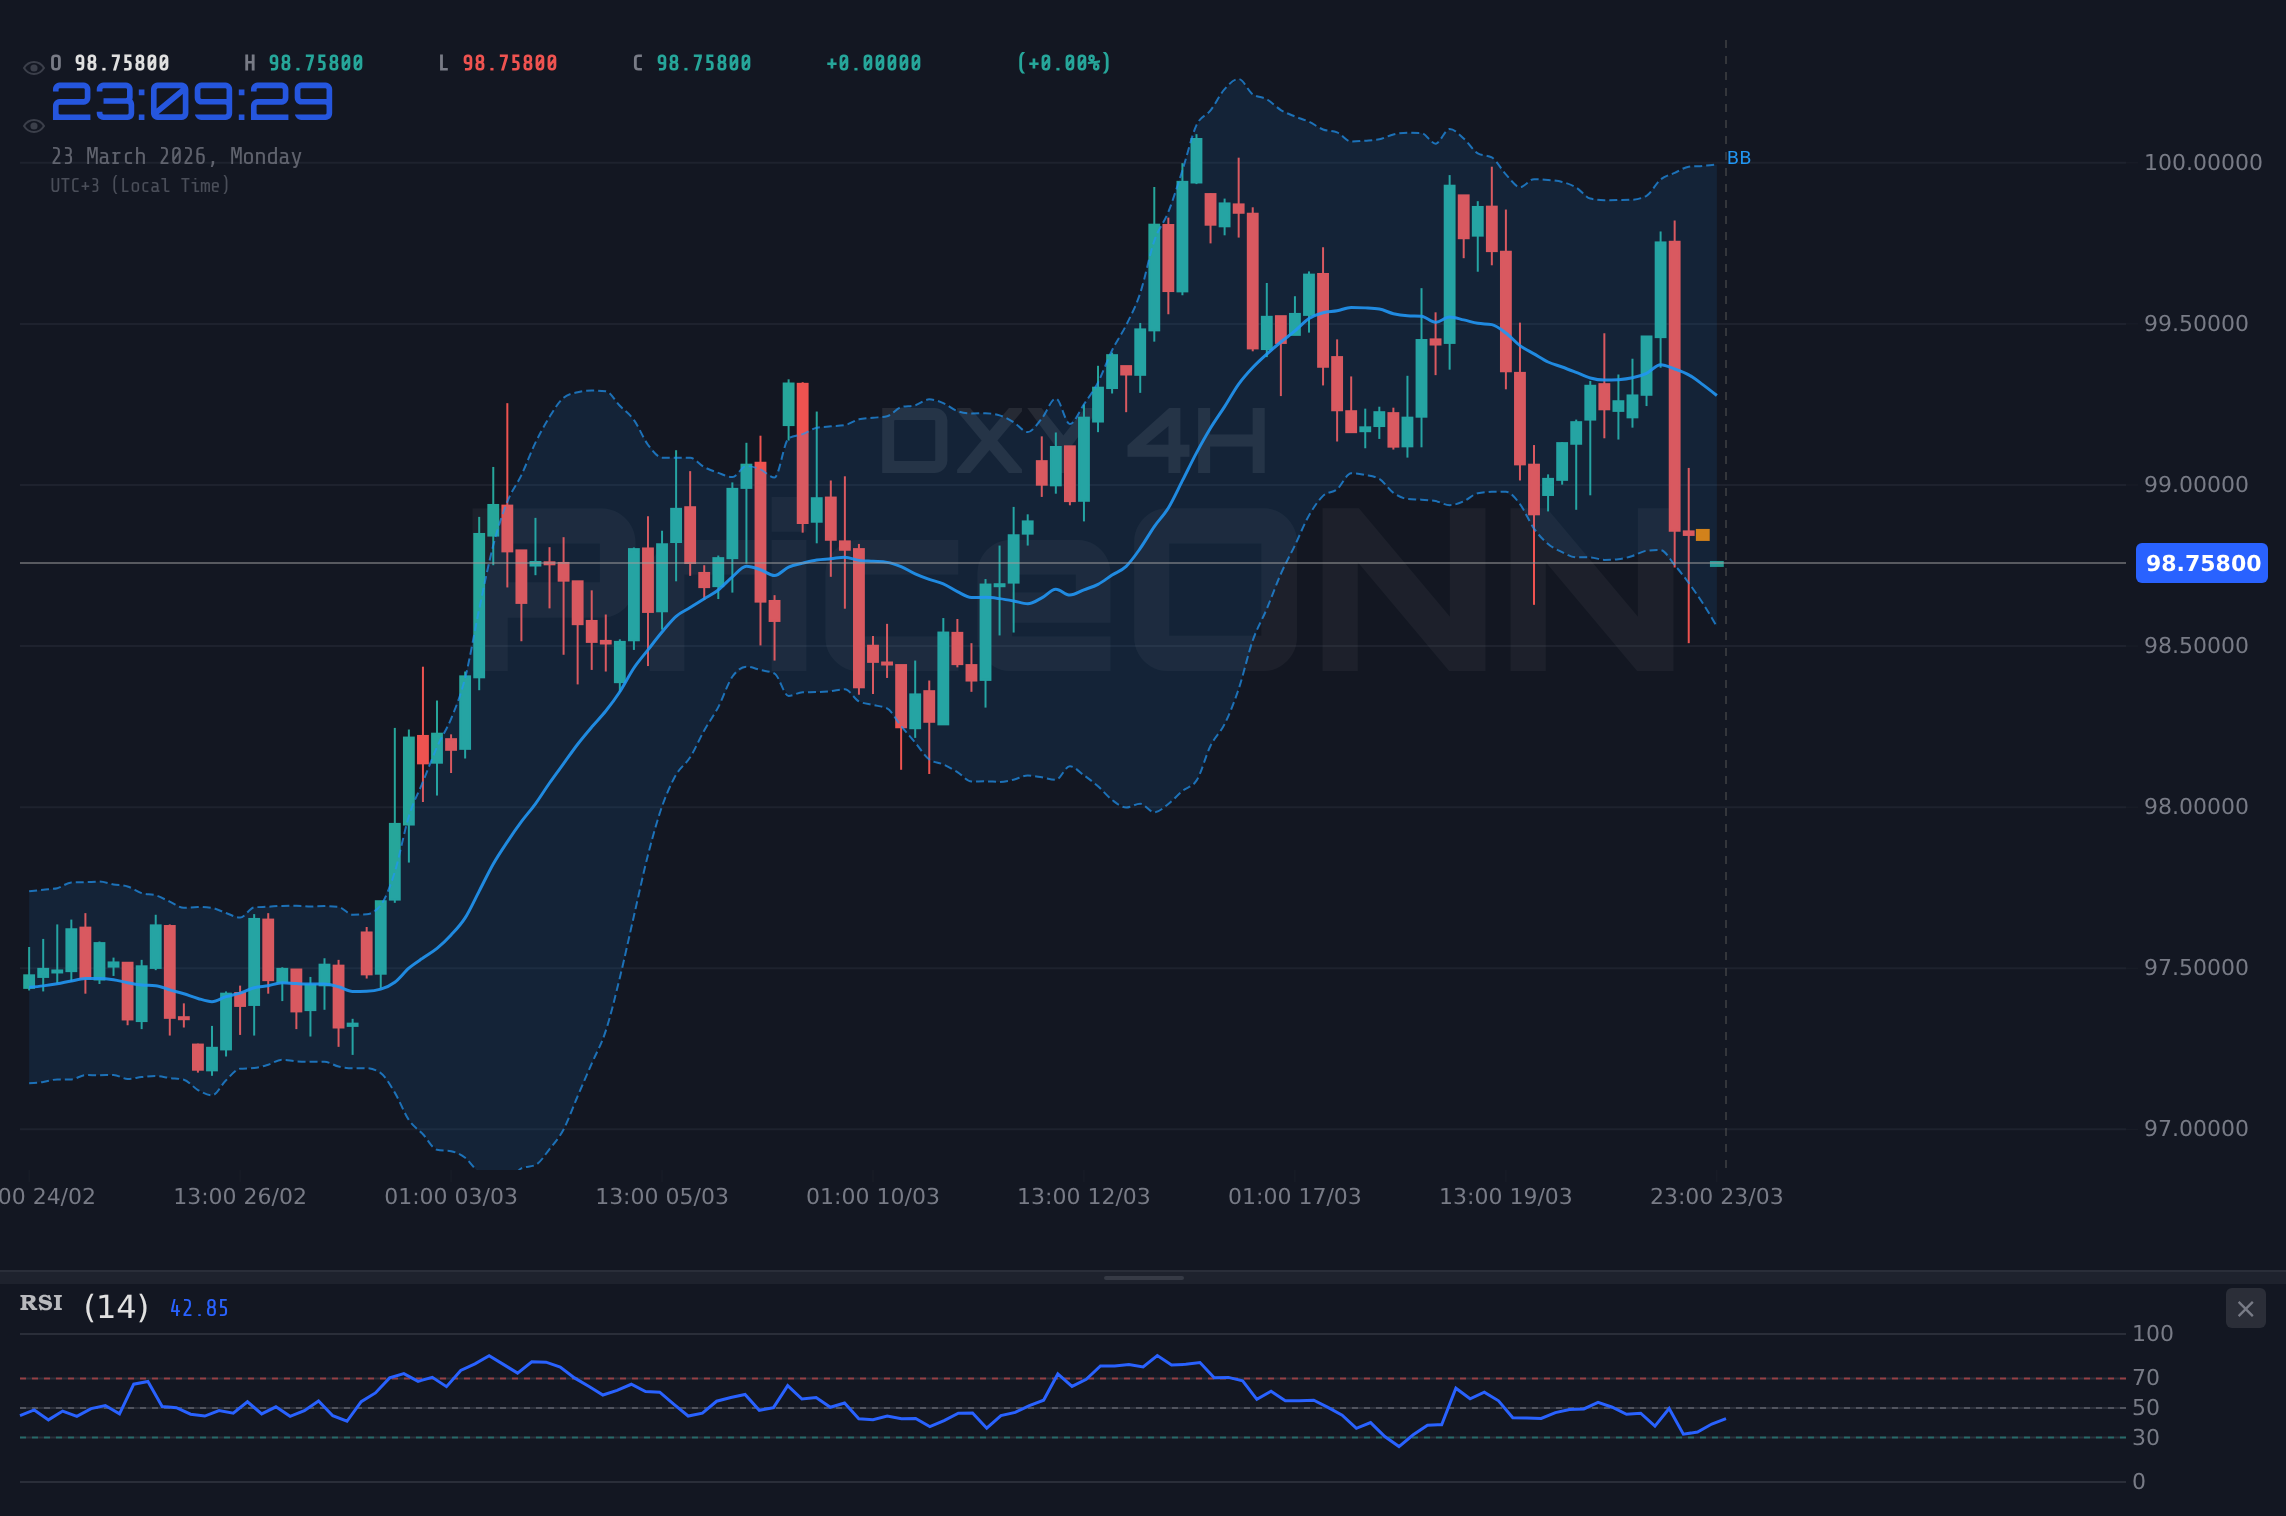
- The DXY is testing support near $98.90, with the 4-hour chart showing a strong downtrend (ADX 63.88).
- On the daily chart, RSI at 27.19 indicates oversold conditions, potentially signaling a bounce.
- Federal Reserve hawkishness remains a key driver, contrasting with easing geopolitical risks that typically support safe-haven assets.
- A daily close above $99.51 resistance is needed to confirm a bullish reversal, targeting $100.07.
The Tug-of-War at $98.90: Bulls vs. Bears
The $98.90 level for the Dollar Index (DXY) has become a battleground. On one side, the bulls are attempting to defend this support, hoping to capitalize on the Federal Reserve's persistent hawkish rhetoric. The prospect of higher interest rates for longer continues to lend a floor to the dollar, as it offers attractive yields compared to other major currencies. The Fed's commitment to taming inflation, even at the risk of slowing economic growth, provides a fundamental tailwind for the greenback. However, the bulls face significant headwinds. The easing of certain geopolitical tensions, while positive for global risk appetite, can sometimes reduce the safe-haven demand that has bolstered the dollar in recent times. This complex interplay of factors creates a volatile environment where short-term fluctuations can be sharp, making it crucial to dissect the underlying signals.
Conversely, the bears see the current levels as an opportunity to push the DXY lower. They point to the significant downtrend observed on the 4-hour chart, where the ADX stands at a formidable 63.88, indicating a very strong bearish trend. While the daily RSI has dipped into oversold territory at 27.19, suggesting a potential rebound, the bears argue that strong trends can persist even in oversold conditions. Furthermore, they highlight that any significant easing of global risk aversion could lead to a rotation out of the dollar into riskier assets, further pressuring the DXY. The market is also keenly watching for any signs of a Fed pivot, although current communication strongly suggests otherwise. The divergence between the strong 4H trend and the daily oversold condition creates a palpable tension, making the $98.90 level a critical point of observation for both camps.
The Bull Case: Fed's Resolve and Technical Oversold Signals
The argument for a bullish reversal in the DXY hinges on two primary pillars: the Federal Reserve's unwavering hawkish stance and the compelling oversold readings on longer-term technical charts. Despite recent market volatility and some easing in geopolitical tensions, Fed officials have consistently signaled their determination to bring inflation under control. Statements from various Fed members in recent weeks have emphasized the need for continued vigilance, with some even suggesting the possibility of further rate hikes if inflation proves more stubborn than anticipated. This hawkish bias inherently supports the dollar, as higher interest rates make dollar-denominated assets more attractive to global investors seeking yield. The CME FedWatch tool, while fluctuating, generally reflects a market pricing in a significant probability of sustained higher rates throughout the year, providing a solid fundamental bedrock for dollar strength.
Technically, the daily chart presents a compelling picture for the bulls. The Relative Strength Index (RSI) has fallen to 27.19, a level typically associated with oversold conditions. Historically, such deep RSI dives often precede a bounce or at least a period of consolidation, offering a potential entry point for contrarian traders. While the MACD remains in negative territory, indicating bearish momentum, the stochastic oscillator is showing signs of bottoming out, with %K hovering below %D but nearing a potential crossover. The ADX on the daily chart, at 22.26, suggests a trend that is present but not overwhelmingly strong, allowing room for a corrective move upwards. A sustained push above the immediate resistance level at $99.51, and crucially, a daily close above $100.07, would be the confirmation needed to signal a shift in momentum, potentially opening the door for a move towards the $100.07 to $100.62 range. This scenario is further supported by the fact that the DXY is currently trading above its 1H Bollinger middle band, suggesting some short-term upward pressure.
The divergence between the strong 4H downtrend (ADX 63.88) and the daily oversold RSI (27.19) creates a significant 'watch zone' around $98.90. Bulls need a daily close above $99.51 to confirm a potential reversal, while bears aim to keep it below $98.46.
The Bear Case: Strong Downtrend and Shifting Risk Appetite
On the opposing side, the bears are drawing strength from the persistent downtrend observed across shorter timeframes and the potential for shifting global risk sentiment. The 4-hour chart paints a starkly bearish picture, with the ADX indicator at a robust 63.88, signaling a very strong prevailing downtrend. This suggests that any upward movements are likely to be corrective rather than indicative of a fundamental trend change. The MACD on this timeframe is also firmly in negative territory, reinforcing the bearish momentum. While the stochastic oscillator on the 4H chart shows %K above %D, suggesting a potential upward move, this signal is often less reliable within a strong established trend, especially when it contradicts the daily trend strength.
Furthermore, the bears are looking at the broader market context. Recent news indicates a slight easing of geopolitical tensions, particularly in the Middle East, which could reduce the demand for safe-haven assets like the US dollar. If risk appetite improves globally, capital may flow out of the dollar and into riskier assets such as equities or emerging market currencies. While the Fed remains hawkish, markets are forward-looking. Any hint of inflation cooling significantly or signs of economic stress could prompt a reassessment of Fed policy expectations, potentially leading to a dollar sell-off. The fact that gold prices saw a rebound, as reported, suggests that some safe-haven demand is indeed shifting. The bears' immediate target would be to break decisively below the $98.46 support level, aiming for the next significant floor at $98.06, and potentially extending towards $97.38 if selling pressure intensifies. The current price action, with the DXY trading below its 1H Bollinger middle band, aligns with this bearish outlook.
The correlation with other markets also plays a role. As the Australian Dollar (AUD/USD) and New Zealand Dollar (NZD/USD) face downside pressure due to dollar strength (as per recent news), it highlights the dollar's current resilience. However, if global risk sentiment shifts more broadly, these commodity currencies could also benefit from increased capital flows, indirectly weakening the DXY. Similarly, the sharp plunge in Silver (XAG/USD) around $64.58, attributed to Fed hawkishness and dollar strength, underscores the dollar's power. Yet, the fact that gold (XAU/USD) is recovering from lows, even with the dollar strong, hints at underlying complexities and a potential diversification of safe-haven demand.
The conflicting signals between the 4H strong downtrend (ADX 63.88) and the daily oversold RSI (27.19) mean this is a high-risk zone. A decisive break below $98.46 could accelerate declines, while a hold above $98.90 might see a short-term bounce towards $99.51.
Intermarket Dynamics: DXY, Equities, and Commodities
The DXY's movement is intrinsically linked to global financial markets, acting as a barometer for risk appetite and inflation expectations. Currently, the Dollar Index is showing a slight decline, trading at $98.90, while the S&P 500 (SP500) is experiencing a notable rise, closing at 6573.6. This divergence is somewhat unusual; typically, a strengthening dollar correlates with a risk-off environment where major indices like the S&P 500 and Nasdaq (Nasdaq100) might retreat. The Nasdaq 100 is also showing upward momentum, trading at 24159.81. This suggests that while the Fed's hawkish stance might be supporting the dollar in the short term, broader market optimism, perhaps driven by other factors not immediately apparent in the provided data, is currently outweighing dollar strength fears in the equity space.
The relationship with commodities is also telling. Gold (XAU/USD), currently trading at $4394.68, has seen a rebound from its lows, indicating a potential shift in safe-haven demand or a reaction to oversold technical conditions. This rebound, despite the dollar's general strength and the S&P 500's rise, suggests that inflation concerns or geopolitical uncertainty might still be lurking beneath the surface, prompting some diversification into precious metals. Silver (XAG/USD) at $68.92, however, has shown more mixed signals, with a daily uptrend but weaker signals on other timeframes, reflecting its higher sensitivity to industrial demand alongside its monetary aspects. The energy markets present a complex picture: Brent crude at $100 (though the provided daily range is $111.33 - $112.97, suggesting an error in the data's daily change calculation versus its current price) and WTI at $89.21 are showing strong downtrends on intraday charts but conflicting signals on longer timeframes. This commodity weakness, especially in oil, could imply easing inflation expectations or a slowdown in global demand, which would typically be dollar-negative but could also reduce the urgency for Fed tightening, creating ambiguity.
The DXY's own technical indicators further complicate the narrative. While the 4-hour trend is strongly bearish (ADX 63.88), the daily chart RSI is deeply oversold (27.19). This conflict suggests that the market is grappling with opposing forces. The daily trend (ADX 22.26) is only moderately trending, allowing for potential reversals. If the current support at $98.90 holds, and particularly if a daily close above $99.51 is achieved, the DXY could be poised for a recovery, potentially supported by continued Fed hawkishness. Conversely, a failure to hold $98.90 could see a rapid descent towards $98.46 and below, especially if global risk sentiment takes a nosedive or if inflation shows clear signs of cooling, reducing the need for aggressive Fed action.
The current divergence where DXY shows a potential bounce from oversold daily levels around $98.90 while equities like SP500 and Nasdaq are rising is unusual. This suggests that either the dollar's safe-haven appeal is waning, or market participants are betting on a specific Fed policy outcome distinct from broader risk sentiment.
Fed Policy: The Dominant Narrative
At the heart of the DXY's current valuation lies the Federal Reserve's monetary policy stance. Recent communications from Fed officials have been notably hawkish, underscoring a commitment to combating inflation even if it means tolerating slower economic growth or a potential recession. This unwavering focus on price stability has kept interest rate expectations elevated. Market participants are closely monitoring Fed fund futures and OIS rates for clues on future policy moves. While the exact path remains debated, the prevailing sentiment is that the Fed is likely to maintain higher interest rates for an extended period, possibly until inflation shows more definitive signs of returning to the 2% target. This policy outlook provides a strong fundamental underpinning for the US dollar, making it attractive relative to currencies where central banks are perceived to be more dovish or closer to easing cycles.
The implications of this hawkish stance are significant. Higher US interest rates tend to attract capital into dollar-denominated assets, increasing demand for the currency. This can put pressure on currency pairs like EUR/USD, where the European Central Bank might be on a different policy trajectory, and also affect commodity prices, which often move inversely to the dollar. For instance, gold (XAU/USD) at $4394.68 can become less attractive as a store of value when non-yielding assets are overshadowed by higher-yielding dollar assets. Similarly, a strong dollar can make imports cheaper for the US, potentially helping to curb inflation, but it can also make US exports more expensive, impacting trade balances. Traders are thus in a constant state of analyzing Fed speak, economic data releases (like CPI and employment figures), and market-implied probabilities of rate changes to gauge the dollar's future direction.
The current market pricing, as reflected in the DXY's resilience around $98.90 despite some easing geopolitical risks, suggests that the Fed's policy narrative is currently the dominant theme. However, this could change rapidly. Any significant shift in inflation data, employment figures, or unexpected economic weakness could force a reassessment of Fed expectations. For example, a surprisingly weak Non-Farm Payrolls (NFP) report or a sharp drop in CPI could lead markets to price in earlier rate cuts, which would likely weaken the dollar. Conversely, persistently high inflation readings would reinforce the hawkish narrative and could propel the DXY higher, potentially challenging resistance levels like $99.51 and $100.07.
A daily close above $99.51, coupled with sustained hawkish commentary from the Fed, would validate the bullish case. This scenario targets $100.07, with further upside potential towards $100.62 if momentum builds.
Geopolitical Undercurrents and Risk Sentiment
While the Federal Reserve's policy remains a primary driver, geopolitical developments continue to cast a long shadow over the DXY and broader markets. Recent news suggests a potential easing of tensions in certain geopolitical hotspots, particularly in the Middle East. This de-escalation, if sustained, could reduce the immediate demand for safe-haven assets. Historically, periods of heightened geopolitical uncertainty have seen capital flow into perceived safe havens like the US dollar, US Treasuries, and gold (XAU/USD). A reduction in these tensions could therefore lead to a recalibration of risk premiums, potentially weakening the dollar's safe-haven appeal and allowing other fundamental factors, like interest rate differentials, to take center stage.
However, the geopolitical landscape remains fluid and unpredictable. Even as some tensions ease, new flashpoints can emerge, or existing ones can re-ignite. The market's reaction to such events is often swift and can lead to sharp swings in currency values. For instance, a sudden escalation in the Russia-Ukraine conflict or new developments in US-China relations could trigger a renewed flight to safety, boosting the DXY. The current data shows gold recovering from lows, which might indicate that while immediate fears have receded, underlying concerns persist, or traders are diversifying their safe-haven strategies. The price action in Brent crude and WTI, while showing intraday weakness, has seen significant upside recently due to supply concerns and geopolitical risks, highlighting the sensitivity of energy markets to these factors and their subsequent impact on inflation expectations and central bank policy.
The interplay between geopolitical risk and monetary policy is complex. If geopolitical risks subside significantly, it might allow central banks, including the Fed, to focus more intently on domestic inflation without the added pressure of managing currency depreciation or imported inflation from commodity shocks. This could lead to a more data-dependent approach, potentially reducing the dollar's gains. Conversely, if tensions flare up again, the dollar could benefit from safe-haven flows, even if the Fed were to signal a less aggressive path on rates. For now, the market appears to be pricing in a scenario where geopolitical risks are manageable, allowing the Fed's hawkish narrative to dominate, but this equilibrium is fragile.
Trading Scenarios for the DXY Around $98.90
Bearish Scenario: Breakdown Below Support
65% ProbabilityBullish Scenario: Support Holds and Reversal
25% ProbabilityNeutral Scenario: Range-Bound Consolidation
10% ProbabilityThe current technical setup for the DXY presents a clear dichotomy, with strong signals on different timeframes pointing in opposing directions. The 4-hour chart, with its ADX at 63.88, screams 'downtrend,' suggesting that any rallies are merely opportunities for bears to re-enter the market. This perspective implies that a breakdown below the $98.46 support level is the more probable outcome, potentially leading to targets at $98.06 and even $97.38. This scenario is particularly potent if global risk sentiment deteriorates or if inflation data begins to cool, reducing the Fed's need to maintain its hawkish stance.
However, the daily chart offers a counter-narrative. The RSI at 27.19 is deeply oversold, a condition that often precedes a significant bounce. For bulls, the key is the $98.90 support holding firm, ideally followed by a daily close above $99.51. Confirmation of this bullish thesis would likely involve sustained hawkish commentary from the Fed and a continued supportive macroeconomic environment for the dollar. Should this scenario play out, targets at $100.07 and $100.62 become attainable. The probability assigned to the bearish scenario (65%) reflects the strength of the shorter-term trend, while the bullish scenario (25%) acknowledges the potential reversal signaled by the daily oversold conditions and the Fed's policy bias. A neutral consolidation scenario (10%) remains a possibility if conflicting signals paralyze price action.
For traders, navigating this divergence requires a patient and disciplined approach. The 'WATCH_ZONE' decision reflects the current choppiness indicated by the ADX of 16.32 on the 4H chart, suggesting that a clear directional trade is risky until a decisive breakout or breakdown occurs. The ideal setup for bulls would be a clear hold of $98.90, followed by a confirmed break above $99.51, ideally on increasing volume. For bears, the immediate focus is on breaking and holding below $98.46, which would signal a continuation of the dominant downtrend. Until then, expect potential volatility around the $98.90-$99.51 range.
Frequently Asked Questions: DXY Analysis
What happens if the DXY breaks below $98.46 support?
A break below $98.46 would invalidate the immediate support and signal a continuation of the dominant downtrend observed on the 4-hour chart. This could lead to further declines towards the $98.06 level, with a potential extension to $97.38 if selling pressure intensifies and broader risk sentiment deteriorates.
Should I consider buying DXY at current levels near $98.90 given the oversold RSI?
Buying at current levels near $98.90 carries risk due to the strong 4-hour downtrend. While the daily RSI at 27.19 signals oversold conditions, confirmation is needed. A bullish setup would require a daily close above $99.51, suggesting that waiting for this confirmation might offer a better risk-reward ratio.
Is the RSI at 27.19 a definitive buy signal for DXY right now?
An RSI reading of 27.19 on the daily chart indicates oversold territory, often preceding a bounce. However, it is not a standalone buy signal. The strong downtrend on the 4-hour chart (ADX 63.88) suggests that oversold conditions can persist. Confirmation through price action, such as a daily close above $99.51, is crucial.
How will the Fed's hawkish stance impact DXY this week, especially with easing geopolitical risks?
The Fed's hawkish stance continues to be a primary support for the DXY, making it attractive due to higher potential yields. While easing geopolitical risks might reduce safe-haven demand, the Fed's commitment to fighting inflation could maintain upward pressure on the dollar, especially if key economic data remains robust, reinforcing the case for higher rates.
The DXY's journey around the $98.90 support level is a critical test of market sentiment and the prevailing economic narrative. While the strong downtrend on shorter timeframes suggests further weakness, the oversold conditions on the daily chart, coupled with the Fed's unwavering hawkishness, present a potential floor. Traders must remain vigilant, closely monitoring key levels and economic data releases. The current environment demands patience and disciplined risk management. Volatility is likely to persist as the market digests conflicting signals, but opportunities will emerge for those who wait for clear setups.
| Indicator | Value | Signal | Interpretation |
|---|---|---|---|
| RSI (14) | 27.19 | Oversold | Potential bounce zone, but trend strength matters. |
| MACD Histogram | -0.15 | Negative Momentum | Bearish momentum persists on daily chart. |
| Stochastic | K=10.34, D=11.02 | Oversold Crossover | Nearing potential bullish crossover but still deeply oversold. |
| ADX | 22.26 | Moderate Trend | Daily trend is present but not overwhelmingly strong. |
| Bollinger | Below Lower Band | Breakdown | Price below lower band on daily chart indicates strong selling pressure. |
Track markets in real-time
AI-powered analysis, technical indicators and real-time price data.
Join Our Telegram Channel
Breaking market news, AI analysis and trading signals instantly.
Join Channel