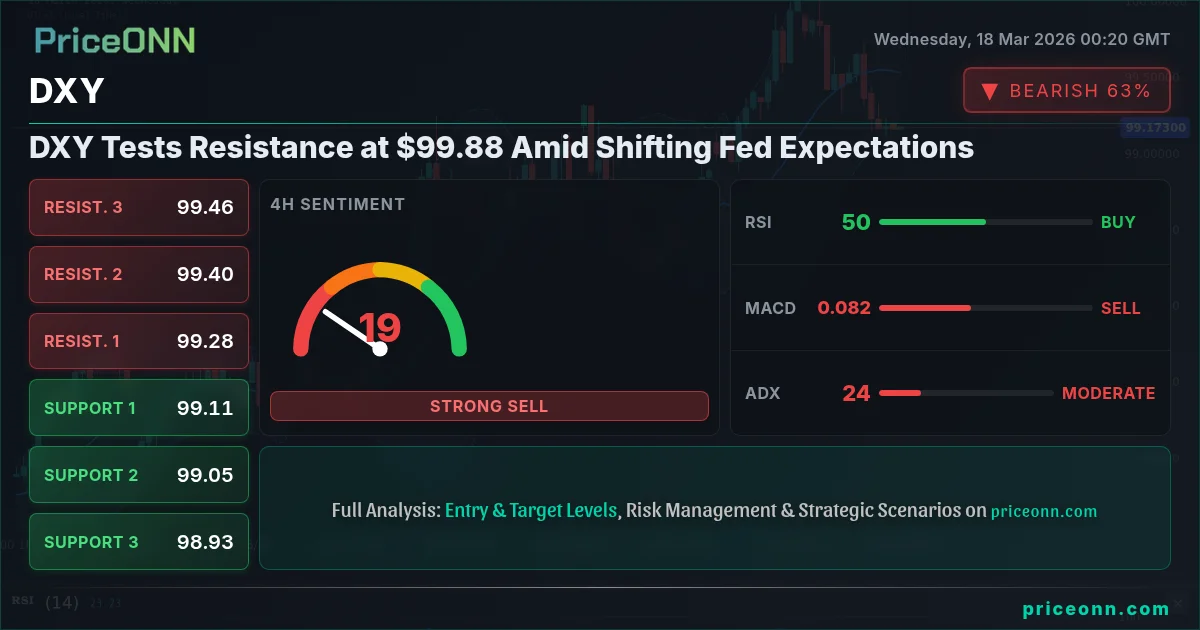
The US Dollar Index (DXY) is currently navigating a pivotal juncture around the $99.29 mark, a level that demands close attention from traders and strategists alike. This consolidation phase, occurring against a backdrop of fluctuating risk appetite and shifting central bank expectations, sets the stage for a potential test of the significant $99.88 resistance. Understanding the forces at play behind this dollar index movement is crucial for deciphering broader market sentiment and anticipating potential directional shifts in global currency markets.
- The DXY is trading at $99.29, with immediate resistance eyed at $99.88 and support at $99.18, based on 1H data.
- A weak trend reading (ADX 13.07 on daily) suggests current price action may lack commitment, indicating potential for volatility.
- The Federal Reserve's upcoming policy decision remains a key catalyst, with market participants closely watching for signals on future interest rate paths.
- Correlations are mixed: DXY's slight dip (-0.16%) contrasts with rising oil prices and mixed equity performance, complicating the safe-haven narrative.
The dollar's current position near $99.29 is not merely a static number; it represents a delicate balance of economic indicators, policy implications, and market psychology. Having recently dipped slightly by -0.16% on the day, with a trading range between $99.11 and $99.74, the DXY appears to be consolidating rather than embarking on a decisive trend. This indecision is often a precursor to significant price action, as the market digests incoming data and prepares for potential catalysts.
Navigating the Technical Landscape
On the 1-hour timeframe, the DXY's technical picture presents a neutral trend with moderate strength. The Relative Strength Index (RSI) at 43.06 suggests a bearish inclination, indicating that while not oversold, the upward momentum is currently subdued. This is further echoed by the MACD, which shows negative momentum with the MACD line below its signal line, reinforcing the bearish sentiment on this shorter timeframe. The Bollinger Bands are also positioned below the middle band, pointing towards a bearish bias in the immediate intraday outlook. Stochastic indicators provide a conflicting signal, with %K (36.34) crossing above %D (23.52), suggesting a potential, albeit weak, upward move. However, the ADX at 27.89, indicating a strong downtrend, casts doubt on the sustainability of any short-term rallies. The overall signal on the 1H chart leans towards selling (7 sell, 2 buy, 0 neutral), highlighting intraday weakness.
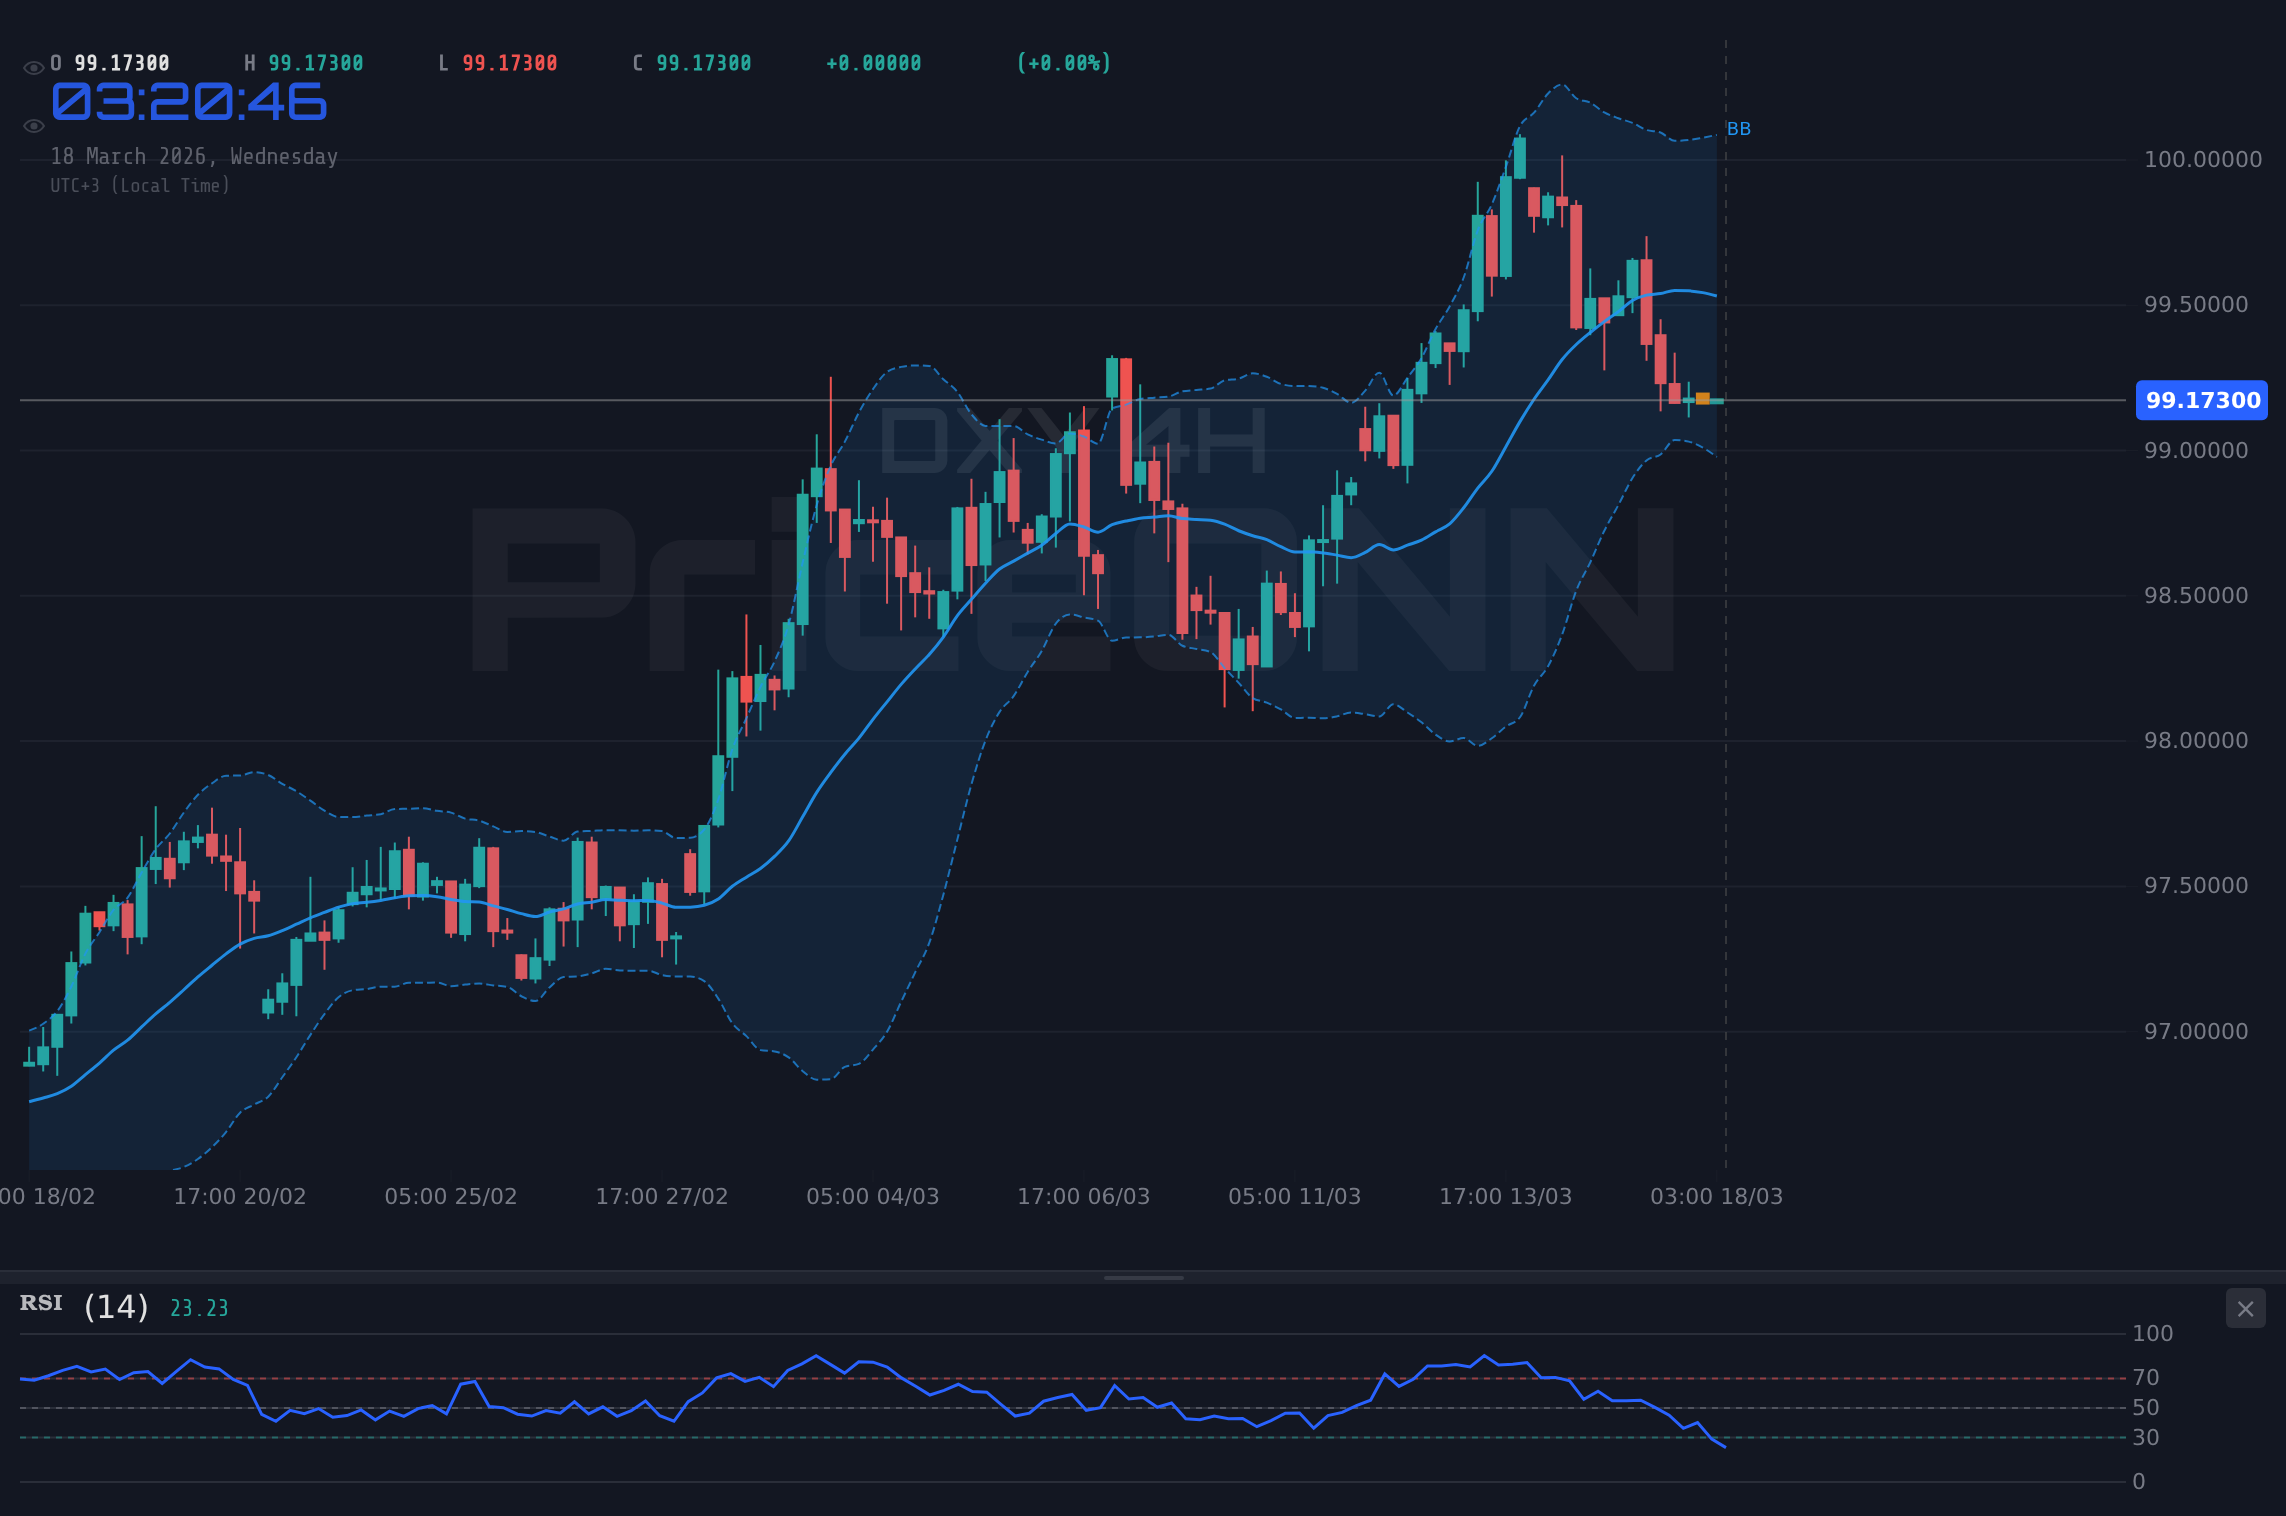
Stepping back to the 4-hour chart, the trend remains neutral, but the strength is perceived as moderate. Here, the RSI (48.85) continues to show a bearish inclination, moving away from the overbought territory. The MACD remains in negative momentum territory, reinforcing the bearish sentiment observed on the hourly chart. Bollinger Bands are also trading below the middle band, aligning with the bearish outlook. Stochastic indicators are firmly in bearish territory, with %K (12.39) below %D (21.74), signaling further downside potential. The ADX at 23.55 confirms a downtrend, albeit of moderate strength. The general signal here is also predominantly bearish (6 sell, 2 buy, 0 neutral), suggesting that the pressure is building on the downside across intraday to medium-term horizons.
The daily chart offers a more complex narrative. While the 1H and 4H charts lean bearish, the daily timeframe indicates a strong uptrend (97% strength). This divergence is critical. The daily RSI at 61.74 is comfortably in neutral territory, showing a slight upward trend, which could support further gains. However, the MACD is positive, with the MACD line above its signal line, indicating bullish momentum. Bollinger Bands are trading above the middle band, also suggesting an upward bias. Yet, Stochastic indicators present a cautionary signal: %K (75.38) is above %D (77.66), but both are in overbought territory, and %K is beginning to cross below %D, hinting at a potential pullback or consolidation. The ADX at 33.05 signifies a strong uptrend, but the Stochastic divergence warns of potential exhaustion. The daily signal is predominantly bullish (7 buy, 1 sell, 0 neutral), creating a conflict between the shorter-term bearish signals and the longer-term bullish trend. This technical tug-of-war suggests that the $99.88 resistance level is a crucial battleground.
Fundamental Drivers and Market Sentiment
The DXY's current positioning is intrinsically linked to the Federal Reserve's monetary policy stance and the broader macroeconomic environment. With the Fed Funds Futures and OIS (Overnight Index Swaps) pricing in a certain probability of future rate hikes or pauses, any communication from Fed officials or the release of key economic data can significantly sway dollar sentiment. Recently, there has been a subtle shift in market expectations regarding the pace and extent of future interest rate adjustments. While inflation remains a concern, some data points have suggested a potential moderation, leading traders to question the Fed's resolve in maintaining an aggressive tightening cycle indefinitely. This uncertainty fuels consolidation and makes the DXY susceptible to volatility based on incoming data.
The economic calendar provides context for this policy debate. While specific upcoming events like FOMC meetings or crucial inflation reports (CPI, PCE) are not detailed in the provided market data, their looming presence influences market positioning. Traders are often hesitant to establish large positions ahead of major central bank announcements or key economic data releases. This cautious approach contributes to the current range-bound trading observed in the DXY. The interplay between inflation figures, employment data (such as Non-Farm Payrolls), and growth indicators (GDP, PMI) will be critical in shaping the Fed's decision-making process and, consequently, the dollar's trajectory. A stronger-than-expected economic reading could bolster the case for continued hawkishness, potentially driving the DXY above $99.88, while signs of economic weakening might reinforce calls for a pause, leading to dollar depreciation.
Geopolitical risks also play a role, though their impact on the DXY can be complex. While a rising dollar often acts as a safe-haven asset during times of global uncertainty, its correlation can shift. Currently, the oil prices are surging, with Brent crude reaching $103.77 and WTI at $95.37, indicating inflationary pressures and potential geopolitical tensions in energy markets. This rise in oil prices typically supports inflation expectations, which could, in turn, argue for a tighter monetary policy from the Fed. However, the DXY's current slight dip suggests that this inflationary pressure is not exclusively translating into dollar strength. Furthermore, equity markets are showing mixed signals: SP500 is up 0.36% to 6719.4, and Nasdaq100 is up 0.69% to 24814.75, suggesting some risk appetite, which might slightly dampen safe-haven demand for the dollar. The Dow Jones, however, shows a neutral 1H and 4H trend, with a bearish daily trend, adding to the overall mixed market sentiment.
DXY's Correlation Dynamics
The dollar's relationship with other major assets provides valuable insights into its current market function. For instance, gold prices (XAUUSD) are trading at $5010.82. Historically, a strengthening DXY often exerts downward pressure on gold prices, as both can be considered alternative stores of value, with the dollar's rise making gold more expensive for holders of other currencies. However, the current data shows XAUUSD at $5010.82 with a mixed technical picture across timeframes - neutral on 1H and 4H, but with a bearish signal on the daily. The DXY's slight intraday dip might be providing some marginal support to gold, but the overall trend and conflicting signals suggest that this correlation is not providing a clear directional cue at this moment.
Forex pairs also offer a lens through which to view the DXY's influence. EURUSD is trading at 1.1542, showing a strong upward trend on the 1H and 4H charts, despite a bearish daily trend. This suggests that the Euro is gaining some ground against the dollar in the short to medium term. Similarly, GBPUSD is at 1.33598, also exhibiting a strong upward trend on shorter timeframes, indicating Sterling strength against the dollar. USDJPY, however, presents a different dynamic. Trading at 158.843, it shows a bearish trend on the 1H and 4H charts, contradicting the strong daily uptrend. This suggests that the Yen is gaining strength against the dollar on shorter horizons, perhaps due to its safe-haven appeal or diverging interest rate differentials. AUDUSD at 0.71105 and NZDUSD at 0.5861 are both showing upward trends on shorter timeframes, indicating a broader weakness in the dollar against commodity currencies, at least in the intraday to medium term.
The conflicting signals across different timeframes for the DXY itself, coupled with mixed correlations across major asset classes, underscore the current uncertainty. The daily chart's strong uptrend signal (ADX 33.05) is a significant factor, suggesting that any short-term weakness might be a consolidation before a larger move higher. However, the weak trend signal on the daily (ADX 13.07) and the conflicting signals from oscillators like Stochastic on the daily chart cannot be ignored. This confluence of factors suggests that the $99.88 resistance level is not just a technical barrier but a crucial psychological and fundamental checkpoint.
Why $99.88 is the Line in the Sand
The $99.88 level for the DXY is more than just a number; it represents a confluence of resistance points and a potential inflection zone. On the 1-hour chart, $99.88 is situated just above the immediate resistance of $99.32, and it aligns with the broader daily resistance levels. A decisive break above $99.88, particularly on increased volume and with supportive economic data or hawkish Fed commentary, could signal a continuation of the daily uptrend and potentially open the door for a move towards the $100.32 and $100.62 levels. Such a move would likely coincide with renewed dollar strength across the board, potentially pressuring EURUSD and GBPUSD lower, and reinforcing the safe-haven status of the dollar.
Conversely, a failure to break above $99.88, especially if accompanied by bearish divergences on oscillators or weaker-than-expected economic data, could lead to a significant pullback. The immediate support at $99.18 on the 1H chart, followed by $99.11 on the 4H chart, would become targets. A sustained move below these levels, particularly below the daily support at $99.14, could invalidate the bullish daily outlook and signal a deeper correction, potentially testing the $98.84 and $98.40 support zones. This scenario would likely see a resurgence of strength in EURUSD and GBPUSD, and potentially a move higher in gold prices.
The current market sentiment, characterized by mixed technical signals and an uncertain economic outlook, means that price action around $99.88 will be highly sensitive to news flow. Traders will be looking for confirmation from multiple indicators and catalysts. For example, a breakout above $99.88 would need to be supported by strong macroeconomic data or clear hawkish signals from the Fed. Similarly, a rejection at this level would be more convincing if it aligns with bearish technical divergences and negative geopolitical developments. The ADX readings across different timeframes (27.89 on 1H, 23.55 on 4H, 33.05 on 1D) indicate that while the daily trend is strong, shorter-term trends are less committed, suggesting that the battle at $99.88 could be volatile.
Trade Scenarios and Outlook
Given the current technical and fundamental backdrop, several scenarios are plausible for the DXY. The primary bullish scenario hinges on a successful breach of the $99.88 resistance. This would likely be triggered by positive economic data or hawkish sentiment from the Federal Reserve, confirming the strength indicated by the daily uptrend (ADX 33.05). If this breakout occurs, we could see the DXY target the next resistance levels at $100.32 and potentially $100.62. This would imply a renewed strengthening of the dollar against major currencies like the Euro and Pound, and could put downward pressure on gold.
The alternative bearish scenario anticipates a rejection at the $99.88 resistance. This could be driven by signs of economic cooling, dovish signals from the Fed, or a general risk-off sentiment. In this case, the DXY would likely retreat, testing the support levels around $99.18 and $99.11. A decisive break below these levels, especially below the daily support at $99.14, would invalidate the daily uptrend and could lead to a more significant decline towards $98.84 and $98.40. This would likely see a reversal in the short-term trends of EURUSD and GBPUSD, with both pairs potentially moving higher.
A neutral scenario, or consolidation, is also possible, especially if key economic data is mixed or if central bank communication is ambiguous. In this environment, the DXY might continue to trade within a range, potentially between the $99.11 support and $99.88 resistance. This would offer limited directional opportunities but could present tactical trading possibilities within the range, relying on intraday momentum and short-term indicators. The conflicting signals from oscillators like Stochastic on the daily chart (K=75.38, D=77.66, with %K below %D) suggest that such range-bound action, possibly with some downside pressure, is a distinct possibility before a clearer trend emerges.
The overall market sentiment remains cautious, with traders weighing the possibility of continued inflation against signs of economic slowdown. The Federal Reserve's next move is pivotal. If they signal a commitment to further rate hikes, the DXY could break above $99.88. However, if they hint at a pause or pivot, the dollar might face headwinds. The strength of the daily uptrend (ADX 33.05) provides a baseline bullish bias, but the shorter-term bearish technicals and the overbought Stochastic on the daily chart warrant caution. The market is effectively waiting for a clearer signal, making the price action around $99.88 a critical indicator of future direction.
Frequently Asked Questions: DXY Analysis
What happens if DXY breaks above the $99.88 resistance level?
A decisive break above $99.88, supported by positive economic data or hawkish Fed signals, could propel the DXY towards $100.32 and $100.62. This would likely strengthen the dollar against major currencies and could increase safe-haven demand.
Should I consider selling DXY at current levels of $99.29 given the bearish 1H and 4H signals?
Selling at $99.29 carries risk due to the strong daily uptrend (ADX 33.05). A more prudent approach might be to wait for a confirmed rejection at $99.88 or a break below the $99.18 support, aligning with shorter-term bearish signals.
Is the Stochastic divergence on the daily chart (K=75.38, D=77.66) a strong sell signal for DXY?
While the Stochastic showing %K below %D in overbought territory (75.38/77.66) suggests potential for a pullback, it's not a definitive sell signal on its own, especially with the strong daily ADX. Confirmation from price action and other indicators is needed.
How will upcoming Fed policy decisions impact DXY's move towards $99.88?
Hawkish Fed commentary or a higher-than-expected rate hike could push DXY above $99.88, reinforcing the uptrend. Conversely, dovish signals or a pause could lead to a rejection at resistance and a move lower, testing support levels.
The market is at an inflection point for the US Dollar Index. The $99.88 level is the immediate hurdle, and its breach or rejection will dictate the short to medium-term direction. While the daily trend remains robustly bullish, the conflicting signals across shorter timeframes and oscillator divergences warrant a cautious approach. Patience and a focus on confirmation will be key for traders looking to navigate this critical juncture. The interplay of economic data, Fed policy expectations, and global risk sentiment will ultimately determine whether the dollar can extend its gains or faces a significant correction.
| Indicator | Value | Signal | Interpretation |
|---|---|---|---|
| RSI (14) | 43.06 | Bearish | Below 50, trending down |
| MACD | Negative | Bearish | MACD below signal |
| Stochastic | %K: 36.34, %D: 23.52 | Bullish | %K > %D, but in lower territory |
| ADX | 27.89 | Bearish | Strong downtrend on 1H |
| Bollinger | Mid Band | Bearish | Price below middle band |
Track markets in real-time
AI-powered analysis, technical indicators and real-time price data.
Join Our Telegram Channel
Breaking market news, AI analysis and trading signals instantly.
Join Channel