The DXY's resilience above the critical $99.91 level last Friday was not just a technical hold; it was a clear signal of the dollar's safe-haven appeal in a week dominated by escalating geopolitical tensions and a sharp risk-off sentiment sweeping across global markets. As the dust settles on another volatile trading week, the greenback stands tall, demonstrating its enduring strength amidst uncertainty. This analysis delves into the key drivers, technical underpinnings, and correlated market movements that shaped the DXY's performance, offering a comprehensive outlook for the week ahead.
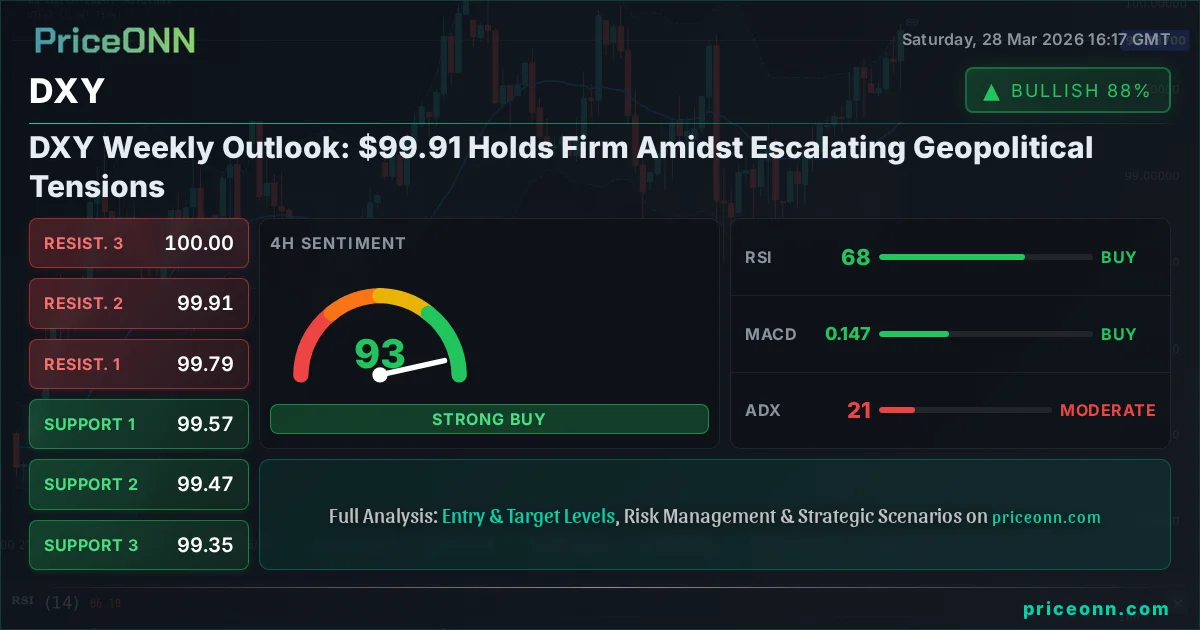
- The DXY index closed last Friday at $99.91, holding firm above key psychological levels.
- Escalating geopolitical tensions, particularly concerning the Middle East, significantly boosted safe-haven demand for the US dollar.
- Major equity indices like the S&P 500 and Nasdaq experienced sharp declines, reflecting a pronounced risk-off sentiment.
- The Federal Reserve's hawkish stance, underscored by recent commentary and market expectations, continues to provide underlying support for the dollar.
Last week was a stark reminder of how quickly market dynamics can shift. What began with a relatively stable risk appetite quickly morphed into a broad-based selloff, particularly in equities. The S&P 500 tumbled by 2% and the Nasdaq saw a steeper 2.23% decline, signaling a clear retreat from riskier assets. This risk aversion directly benefited the US Dollar Index (DXY), which climbed 0.34% to finish the week trading around the $99.91 mark. The strength in DXY was not merely a byproduct of equity weakness; it was also underpinned by persistent inflation concerns and the implied continuation of a relatively hawkish monetary policy stance from the Federal Reserve, even if rate hikes are no longer actively priced in for the immediate future. The market's interpretation of Fed commentary continues to lean towards a 'higher for longer' narrative, providing a solid foundation for dollar strength.
The interplay between geopolitical events and currency markets was particularly evident. News of Iran asserting control over the Strait of Hormuz, a critical chokepoint for global oil supply, sent gold prices soaring past $4,500. This surge in gold, typically a safe-haven asset, occurred alongside a strengthening dollar, highlighting a divergence from historical correlations where gold often moves inversely to the dollar. The concurrent rise in oil prices, with Brent crude futures surging over 55% in March, further fueled inflation expectations and added to the general market unease. This environment is precisely where the DXY tends to shine, acting as a primary beneficiary of global uncertainty and a flight to perceived safety. The dollar's correlation with risk sentiment remained strong, with the greenback strengthening as risk assets faltered.
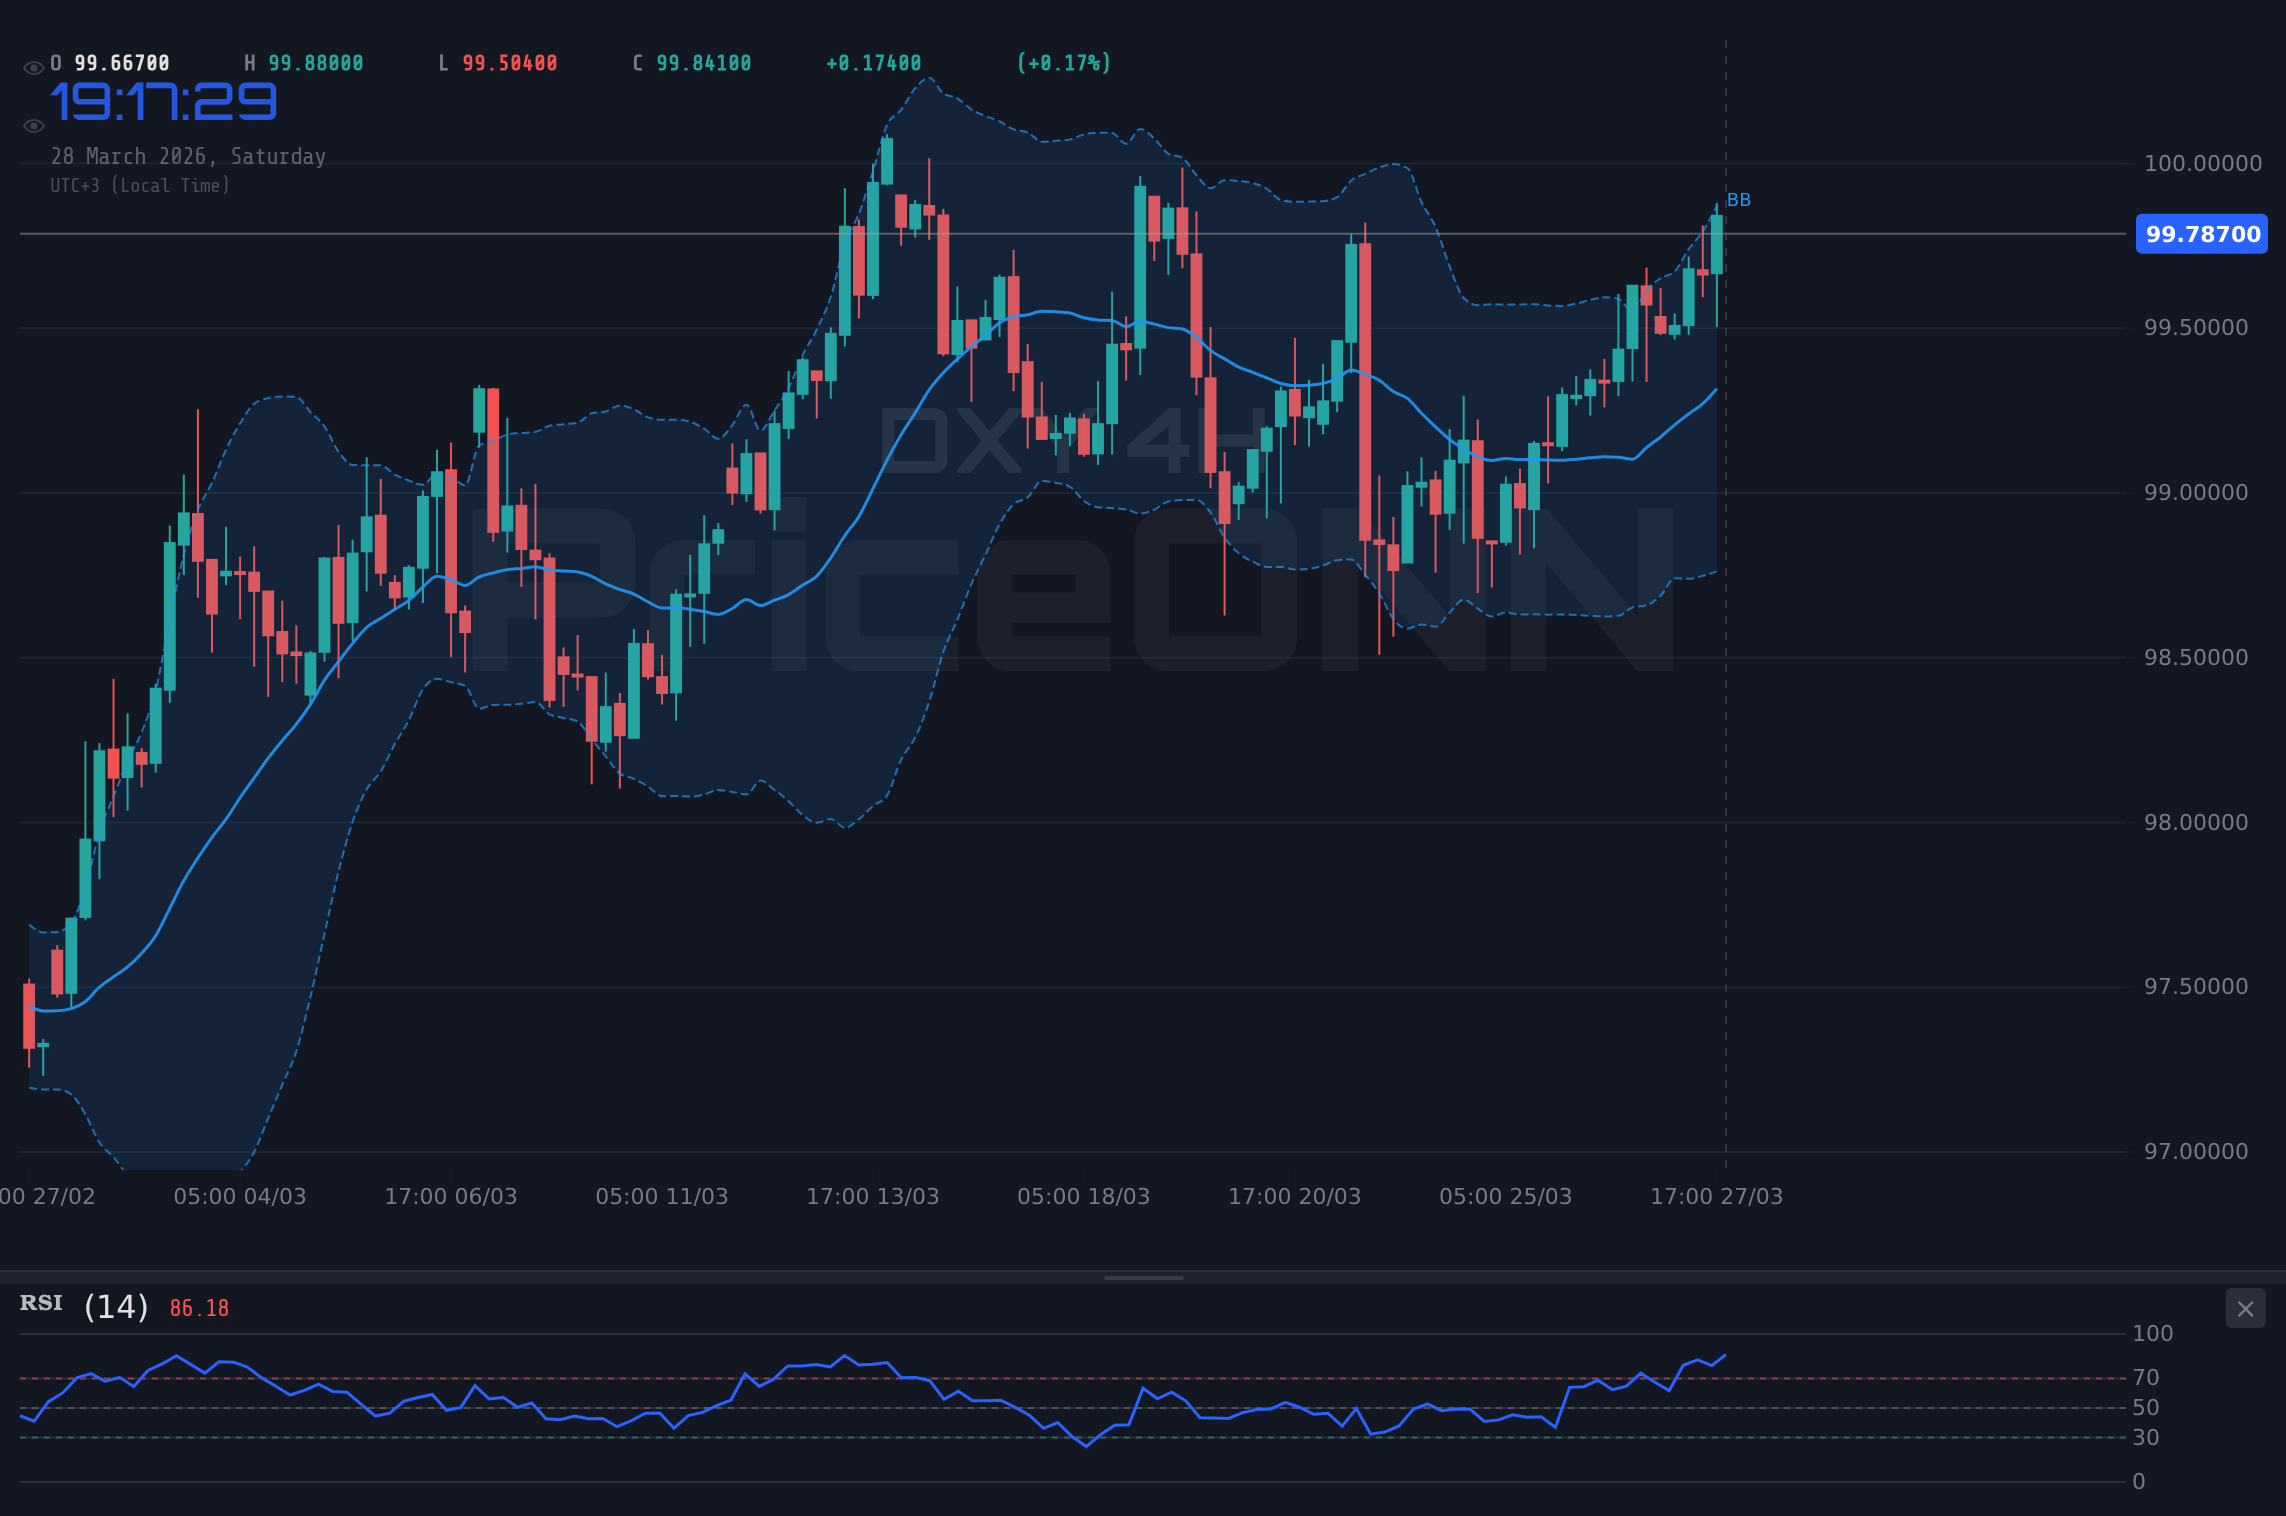
From a technical perspective, the DXY's price action on the daily chart showed a strong upward trend (ADX: 31.98), with RSI holding steady in the upper neutral zone at 61.71. This suggests that while the dollar is not yet in overbought territory, the momentum is clearly bullish. The MACD remains above its signal line, reinforcing the positive momentum. On the 4-hour chart, the ADX at 20.81 indicated a moderate trend strength, while the RSI at 67.59 still offered room for further upside before reaching overbought conditions. The Stochastic Oscillator, however, showed readings in the extreme overbought zone (K=88.7, D=82.07) on the 4-hour timeframe, hinting at a potential for a short-term pullback or consolidation. This divergence across timeframes suggests that while the underlying trend is bullish, traders should be mindful of potential short-term consolidation phases or minor pullbacks as the dollar index navigates these elevated levels.
DXY's Bullish Climb: Geopolitical Tensions as a Catalyst
The narrative of dollar strength has been significantly amplified by recent geopolitical developments. The escalating tensions in the Middle East, particularly Iran's assertive actions regarding the Strait of Hormuz, have injected a fresh dose of uncertainty into global markets. This event, described by Reuters as a trigger for gold's surge, also directly impacts energy markets. With Brent crude futures and WTI prices rocketing past $110 and $101 respectively, inflation expectations are naturally recalibrated upwards. Historically, such spikes in energy prices can complicate central bank policy, forcing them to weigh the need to combat inflation against the risk of stifling economic growth. For the Federal Reserve, this means their path forward remains data-dependent, but the immediate implication is a continued bias towards maintaining a firm stance on interest rates, which inherently supports a stronger dollar.
The impact of these geopolitical events on risk appetite cannot be overstated. The sharp declines seen in major equity indices like the S&P 500 (down 2%) and the Nasdaq (down 2.23%) last Friday are textbook examples of a risk-off environment. When investors become fearful, their first instinct is often to de-risk portfolios, selling assets perceived as higher risk (equities, some emerging market currencies) and moving into perceived safe havens. The US dollar, backed by the deep liquidity of US Treasury markets and the relative stability of the US economy compared to many other regions, is a prime beneficiary of this capital flight. The DXY's upward trajectory is thus not just a reflection of US economic policy but also a barometer of global fear. The narrative that the US dollar is the ultimate safe-haven currency continues to play out, especially when compared to other major currencies that are more sensitive to global growth or regional specific risks.
The correlation between the DXY and global risk sentiment is a crucial element for traders to monitor. As the DXY strengthens, it typically exerts downward pressure on commodities like gold and silver, and on riskier currencies. Last week, we saw gold prices soar past $4,500, a move that defied the typical inverse correlation with the dollar. This suggests that in the current environment, gold is being driven more by inflation hedging and safe-haven demand related to geopolitical risk itself, rather than solely by dollar strength. However, for most other risk assets, the DXY's rise is a headwind. For instance, the Canadian dollar (CAD), closely tied to oil prices, faces a complex situation: higher oil prices should theoretically support the CAD, but the overall risk-off mood and dollar strength are creating headwinds, as noted by market analysis suggesting the CAD is weakening. This cross-market dynamic illustrates the nuanced environment traders are navigating.
Technical Levels and Trading Signals for DXY
On the technical front, the DXY demonstrated considerable strength throughout the past week. The daily chart analysis reveals a robust upward trend, with the Average Directional Index (ADX) at 31.98 indicating strong directional momentum. The Relative Strength Index (RSI) at 61.71 suggests there's still room for the index to appreciate before entering overbought territory, although it is approaching the upper bounds of its neutral zone. The Moving Average Convergence Divergence (MACD) indicator remains in positive territory, with its histogram above the signal line, confirming the prevailing bullish momentum. This daily picture paints a clear bullish bias.
Zooming into the 4-hour timeframe, the technical signals offer a slightly more nuanced view. The ADX here stands at 20.81, suggesting a moderate trend strength. The RSI is at 67.59, still within the neutral zone but closer to overbought conditions than on the daily chart. The MACD on this timeframe also shows positive momentum. However, the Stochastic Oscillator is flashing a different signal. With the %K line at 88.7 and the %D line at 82.07, both are in extreme overbought territory, and the %K line is beginning to cross below the %D line. This signals a potential for a short-term pullback or consolidation phase. This divergence between the daily and 4-hour charts is important; it suggests that while the broader trend remains bullish, short-term traders might need to be cautious about chasing further upside without a clear consolidation or minor retracement first. The key support level to watch on this timeframe is around 99.73.
Looking at the 1-hour chart, the trend is described as neutral with a strength of 50%, the ADX at 12.97 confirms a weak trend, and the RSI is at 69.84, just shy of overbought territory. The Stochastic Oscillator here is extremely overbought with K=90.81 and D=72.47. This 1-hour view reinforces the idea that the intraday momentum might be reaching a temporary peak. The immediate support level to monitor is 99.73, followed by 99.61. Resistance is seen at 99.92, which was a key level tested last week, and then higher at 100.11. A sustained break above 100.11 could signal a continuation of the bullish trend, targeting higher levels. Conversely, a close below 99.73 might indicate a short-term correction is underway, potentially testing the 99.54 support level.
Economic Data and Fed Policy: The Underlying Pillars
While geopolitical events often dominate headlines and drive short-term market moves, the underlying economic data and the Federal Reserve's policy path remain the fundamental pillars supporting the US dollar's strength. Last week's economic calendar, though partially obscured by market turmoil, provided some crucial insights. The weekly jobless claims data, for instance, showed a slight increase in continuing claims, but the overall labor market picture remains relatively robust, offering little reason for the Fed to signal an imminent pivot towards easing. The core Personal Consumption Expenditures (PCE) price index, the Fed's preferred inflation gauge, is due this week, and any indication of sticky inflation could reinforce the 'higher for longer' interest rate narrative.
The market's pricing of future Fed actions is a critical driver. While rate cuts are still anticipated later in the year, the timing and magnitude are constantly being re-evaluated based on incoming data and Fed commentary. The current environment, characterized by elevated oil prices and persistent geopolitical risks, adds layers of complexity. Higher energy costs can feed into inflation, potentially delaying any easing cycle. This uncertainty, paradoxically, can also benefit the dollar as it remains the primary safe-haven currency. Traders are closely watching Fed officials' speeches for any hints about their reaction function to these conflicting economic signals. The current consensus leans towards the Fed prioritizing inflation control, which means maintaining a firm monetary policy stance for the foreseeable future, thereby providing a supportive backdrop for the DXY.
The correlation between DXY and Treasury yields is also noteworthy. As yields rise, particularly on the shorter end of the curve reflecting higher short-term rates, the dollar tends to find support. Conversely, a significant drop in yields, often associated with a flight to safety into US Treasuries, can also support the dollar, albeit through a different channel. Last week saw considerable volatility in bond markets as well, reflecting the broader risk-off sentiment and uncertainty surrounding the economic outlook. Understanding these intermarket dynamics is crucial for a holistic view of the DXY's trajectory. The dollar's appeal as the world's reserve currency, coupled with the Fed's cautious approach to monetary easing, continues to create a favorable environment for the greenback, even as other global economic indicators present a mixed picture.
Cross-Market Correlations: Equities, Gold, and the Dollar
The relationship between the DXY, major equity indices, and gold prices has been a focal point for market participants. Last Friday's trading session provided a clear example of this dynamic, albeit with a twist. As the S&P 500 and Nasdaq experienced significant sell-offs, the DXY climbed, reinforcing the inverse correlation often observed between risk assets and the dollar. This is a textbook risk-off scenario where investors flee to the perceived safety of the greenback. The data shows the S&P 500 dropping 2% and Nasdaq down 2.23%, while the DXY rose 0.34% to $99.91. This demonstrates the dollar's role as a primary beneficiary during periods of heightened global uncertainty.
However, the behavior of gold presents a more complex picture. Gold prices surged past $4,500, a significant move driven by geopolitical fears and inflation expectations stemming from oil price shocks. This rally occurred even as the dollar strengthened. Historically, gold often moves inversely to the dollar, as a stronger dollar makes gold more expensive for holders of other currencies. The fact that both assets rose simultaneously suggests that gold was being driven by specific inflation-hedging and safe-haven demand related to the geopolitical crisis, overshadowing the typical dollar-driven price action. This divergence highlights that while the DXY remains a key indicator of global risk appetite, other factors can independently influence commodity prices, especially during times of extreme geopolitical stress. The price action in gold, reaching $4,512.40, indicates a strong flight to tangible assets driven by fear, not just dollar weakness.
The implications for traders are clear: while the DXY's strength generally acts as a headwind for riskier currencies and commodities, the current environment necessitates a nuanced approach. The surge in oil prices to $110.64 for Brent and $101.19 for WTI is a significant inflationary factor that could complicate the Fed's policy path and, by extension, influence the DXY. Traders must constantly assess whether the dollar's strength is driven by general risk aversion or by specific US economic fundamentals and monetary policy expectations. The concurrent strength in both the DXY and gold suggests that investors are hedging against multiple risks simultaneously - currency devaluation and geopolitical instability. This complex interplay requires careful monitoring of both dollar-specific data and broader global risk indicators.
Trading Scenarios for the DXY
Given the current technical and fundamental backdrop, several scenarios can be envisioned for the DXY's trajectory in the coming week. The prevailing sentiment is bullish, supported by geopolitical risks and Fed policy expectations, but the technical indicators offer some divergence, suggesting potential for consolidation or minor pullbacks before any significant continuation higher.
Bearish Scenario: A Brief Consolidation
25% ProbabilityNeutral Scenario: Range-Bound Trading
40% ProbabilityBullish Scenario: Continued Ascent
35% ProbabilityThe bearish scenario hinges on the DXY failing to hold its gains and succumbing to profit-taking or a shift in risk sentiment. A close below 99.73 on the 4-hour chart would signal a potential short-term correction, targeting 99.61 and then 99.54. This scenario becomes more likely if upcoming economic data surprises to the downside or if geopolitical tensions ease unexpectedly, reducing safe-haven demand. The neutral scenario anticipates a period of consolidation, where the DXY trades within a defined range, likely between 99.73 and 100.11. This would occur if market drivers become mixed, with geopolitical fears balanced by tentative signs of stabilization elsewhere or less hawkish Fed signals. The bullish scenario remains the most probable given the current backdrop. A sustained break above 100.11, fueled by continued geopolitical uncertainty or hawkish Fed rhetoric, could propel the DXY towards 100.45 and subsequently challenge the daily resistance level around 100.76. The ADX on the daily chart at 31.98 supports the idea of a strong trend continuation.
Key Levels to Watch
The price action around the $99.91 mark is critical. Last Friday's close at this level signifies a battleground where bulls and bears are testing each other's resolve. The immediate support at 99.73, reinforced by the 1-hour and 4-hour charts, is the first line of defense for the dollar bulls. A decisive break below this level would invalidate the immediate bullish outlook and potentially open the door for a deeper correction. On the upside, the resistance at 100.11 is the immediate hurdle. A convincing breach of this level, accompanied by strong volume and positive follow-through, would signal a continuation of the upward trend, potentially targeting 100.45 and then the more significant daily resistance at 100.76. The ADX at 31.98 on the daily chart suggests that if a breakout occurs, it could be sustained.
The RSI on the daily chart at 61.71 suggests there is still scope for upside, but on the 4-hour chart, it's nearing overbought at 67.59. The Stochastic on the 4-hour chart is in extreme overbought territory, indicating a potential for a pause or pullback. This mixed signal suggests that while the overall trend is bullish, aggressive entries might be risky. A patient approach, waiting for a confirmed breakout above 100.11 or a pullback to test support levels like 99.73, would offer a better risk-reward ratio. The MACD histogram continues to show positive momentum on the daily chart, reinforcing the bullish bias, but traders should remain aware of the overbought Stochastic signals on shorter timeframes, which could lead to intra-week volatility.
The Fed's Tightrope Walk and Inflationary Pressures
The Federal Reserve finds itself walking a tightrope. On one hand, inflation remains a persistent concern, exacerbated by rising energy prices and ongoing geopolitical instability. On the other hand, the clear risk-off sentiment and the sharp declines in equity markets present a potential drag on economic growth. This delicate balancing act means the Fed is unlikely to deviate from its data-dependent approach anytime soon. Any indication that inflation is not cooling as expected, or that energy price shocks are feeding through to broader price levels, will likely keep the pressure on the Fed to maintain a hawkish bias. This means keeping interest rates higher for longer, which is fundamentally supportive of the US dollar.
The market's anticipation of Fed policy is a powerful driver for the DXY. While the probability of imminent rate cuts has diminished significantly, the focus has shifted to the timing and pace of any potential easing later in the year. The CME FedWatch tool, if available and updated, would typically show traders pricing in the likelihood of various rate decisions. In the absence of specific data, the general market sentiment suggests that the Fed will err on the side of caution, prioritizing inflation control over premature easing. This stance is inherently dollar-positive. Furthermore, the relative strength of the US economy compared to other major economies continues to be a key differentiator. While global growth prospects are clouded by geopolitical risks, the US economy, despite some headwinds, appears more resilient, further bolstering the dollar's safe-haven status.
The interplay between inflation, Fed policy, and the dollar is complex. Higher oil prices, like those seen last week with Brent hitting $110.64 and WTI reaching $101.19, directly contribute to inflationary pressures. This could force the Fed to maintain its hawkish stance, thus supporting the DXY. However, sustained high energy prices can also eventually dampen consumer spending and economic growth, which could, in turn, lead to a less hawkish Fed and potentially weaken the dollar. This is the tightrope the Fed is walking. For now, the immediate reaction to geopolitical shocks and inflation fears favors dollar strength, as the market prioritizes safety and the Fed's commitment to price stability.
The recent economic calendar provided some clues, but the upcoming PCE data will be crucial. If actual inflation figures come in higher than the forecast of 6.926% (compared to previous 6.156%), it would likely reinforce the hawkish Fed narrative and provide further impetus for DXY strength. Conversely, any signs of cooling inflation could lead to a reassessment of Fed policy expectations, potentially causing a short-term pullback in the dollar. The market's reaction to these data points will be key in determining whether the DXY can sustain its climb towards the 100.76 resistance level or if it will face a more significant correction.
Market Sentiment and Intermarket Dynamics
The prevailing market sentiment is undeniably risk-off, a condition that historically favors the US dollar. The sharp declines in major equity indices - S&P 500 down 2% to 6357.55 and Nasdaq down 2.23% to 23092.5 - are symptomatic of this fear. This risk aversion propels capital towards safe-haven assets, with the DXY being a primary recipient. The dollar's strength is further amplified by the relative stability of the US economy and the Fed's commitment to controlling inflation, even at the risk of slowing growth. This combination of global fear and US-centric policy support creates a potent cocktail for dollar appreciation.
The correlation between the DXY and other markets is crucial for understanding the broader picture. As the DXY strengthens, it typically puts pressure on commodities like gold and silver, and on riskier currencies. However, last week's price action showed a divergence, with gold prices soaring past $4,500 despite dollar strength. This suggests that gold was driven by specific geopolitical inflation hedging rather than solely by dollar dynamics. The surge in oil prices (Brent at $110.64, WTI at $101.19) also plays a complex role, acting as both an inflationary driver and a geopolitical risk indicator, both of which can indirectly support the dollar through increased uncertainty.
For forex traders, the DXY's strength implies headwinds for pairs like EURUSD, GBPUSD, AUDUSD, and NZDUSD. Indeed, EURUSD fell to 1.15089, GBPUSD to 1.32699, AUDUSD to 0.68761, and NZDUSD to 0.57468. These currencies are vulnerable in a risk-off environment, especially when the dollar is strengthening due to safe-haven flows and the Fed's policy stance. The USDJPY pair, however, continues its upward trend, reflecting a combination of dollar strength and specific factors influencing the Japanese yen, such as the Bank of Japan's accommodative monetary policy. The current price of 160.297 for USDJPY highlights this divergence, showing that not all currency pairs move in lockstep with the DXY.
The technical indicators provide a consistent picture of dollar strength, albeit with some short-term divergences. The daily chart shows a strong bullish trend for the DXY, with RSI at 61.71 and ADX at 31.98. Shorter timeframes, however, show signs of overbought conditions on the Stochastic Oscillator, suggesting that some consolidation might be on the cards. This presents a trading challenge: chasing the rally aggressively might be risky, but fading the dollar strength could be premature given the underlying fundamental drivers. The key levels around 99.73 (support) and 100.11 (resistance) will be critical in determining the short-term direction. A clear break above 100.11, supported by strong volume, would likely signal a continuation of the bullish trend, while a close below 99.73 could trigger a short-covering rally.
The Week Ahead: Key Events and Outlook
Looking ahead, the DXY's trajectory will likely remain heavily influenced by the evolving geopolitical landscape and upcoming economic data, particularly the PCE inflation report. Any further escalation of tensions in the Middle East could provide continued support for the dollar as a safe-haven asset. Conversely, signs of de-escalation, however unlikely currently, could lead to a reduction in risk premiums and a potential pullback in the DXY. The Federal Reserve's policy path will also remain a dominant theme. Traders will be scrutinizing any further commentary from Fed officials for clues about the timing and pace of potential interest rate adjustments. The market's interpretation of inflation data, especially the upcoming PCE figures, will be paramount in shaping these expectations.
Technically, the DXY is poised at a crucial juncture. Holding above $99.91 is significant, but the overbought signals on shorter timeframes suggest that a period of consolidation or a minor pullback is possible. The key levels to watch remain 99.73 for support and 100.11 for resistance. A decisive move through either of these levels could set the tone for the subsequent trading sessions. The strong daily trend, indicated by the ADX at 31.98, suggests that any pullbacks might be shallow and that the path of least resistance could still be to the upside, especially if geopolitical risks continue to dominate market sentiment. The divergence in signals between daily and shorter timeframes warrants a cautious approach, favoring trades that align with the broader trend but acknowledge the possibility of short-term fluctuations.
The correlation analysis also remains vital. The performance of equities and gold will provide cues about risk appetite. If equities continue to fall and gold remains supported by geopolitical fears, the DXY is likely to benefit. However, if gold prices stabilize or pull back despite dollar strength, it might signal a slight easing of immediate geopolitical fears, potentially leading to a DXY correction. The strength of the dollar is also impacting other currency pairs, with EURUSD, GBPUSD, AUDUSD, and NZDUSD showing bearish tendencies against the greenback. This broad-based dollar strength suggests that the underlying fundamental drivers - geopolitical risk, inflation concerns, and Fed policy expectations - are robust enough to support the DXY across various market conditions. The key will be to monitor how these factors evolve and whether they translate into clear directional moves or continued choppiness.
The DXY's position above $99.91 at the end of last week reflects a confluence of factors favoring dollar strength: escalating geopolitical tensions, persistent inflation concerns, and a generally hawkish monetary policy outlook from the Federal Reserve. While short-term technical indicators suggest potential for consolidation, the broader trend remains bullish. Traders should remain vigilant, monitor key economic data releases, and pay close attention to geopolitical developments. The ability of the DXY to hold its ground amidst significant global uncertainty underscores its role as the premier safe-haven currency in the current market environment.
Frequently Asked Questions: DXY Analysis
What happens if DXY breaks above the $100.11 resistance level this week?
A sustained break above $100.11, supported by strong volume, would signal a continuation of the bullish trend. This could lead to further upside, targeting resistance levels around $100.45 and potentially $100.76 on the daily chart, driven by ongoing geopolitical fears and Fed policy expectations.
Is the DXY's RSI at 61.71 a buy signal at current levels of $99.91?
An RSI of 61.71 on the daily chart suggests bullish momentum but is not yet in overbought territory. While it supports a bullish outlook, it's not a direct buy signal on its own. A patient approach, waiting for confirmation such as a breakout above resistance or a pullback to support, would offer a better risk-reward for traders.
How does the Stochastic Oscillator at K=88.7, D=82.07 on the 4-hour chart impact the DXY's trend?
These Stochastic readings are in extreme overbought territory, indicating that the recent upward move may be extended. This suggests a potential for a short-term pullback or consolidation phase, even if the broader daily trend remains bullish. Traders should watch for potential divergences or reversals on shorter timeframes.
How will the upcoming PCE inflation data affect the DXY this week, given the current geopolitical climate?
If the PCE data comes in hotter than expected (forecast 6.926%), it would likely reinforce the Fed's hawkish stance, supporting the DXY. Conversely, cooler-than-expected inflation could lead to reassessment of Fed policy, potentially causing a DXY pullback. Geopolitical tensions remain a backdrop that could amplify any dollar reaction to the data.
Track markets in real-time
AI-powered analysis, technical indicators and real-time price data.
Join Our Telegram Channel
Breaking market news, AI analysis and trading signals instantly.
Join Channel