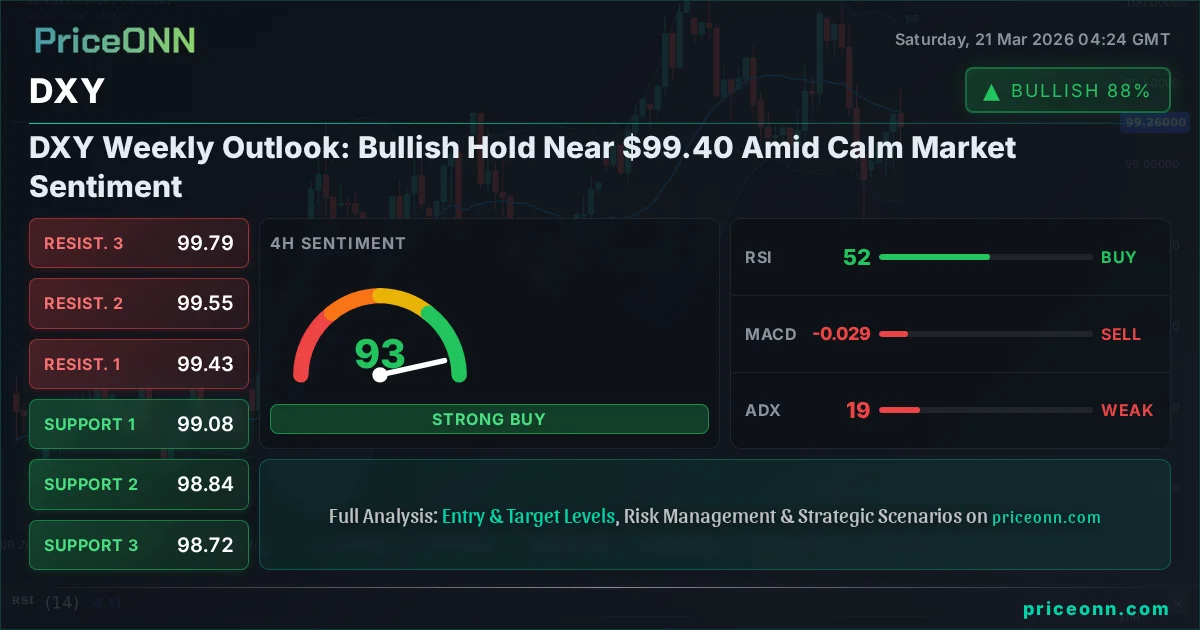
The US Dollar Index (DXY) concluded last week with a notable resilience, consolidating its gains and holding firm near the critical $99.39 level. This price point, a significant psychological and technical marker, represents a battleground where bulls and bears have been fiercely contesting control. As we step into a new trading week, the market sentiment surrounding the dollar remains cautiously optimistic, yet underscored by underlying geopolitical tensions and evolving central bank expectations. This analysis delves into the intricate dance of market forces shaping the DXY's trajectory, examining the arguments for both bullish continuation and bearish reversal, supported by a multi-timeframe technical perspective and the broader macroeconomic landscape.
- The DXY held its ground above $99.39 last week, indicating potential bullish consolidation.
- RSI at 58.15 on the daily chart suggests upward momentum is present but not yet overextended.
- A strong ADX of 34.64 on the daily chart confirms a robust uptrend is in play for the dollar index.
- Geopolitical tensions and hawkish Fed expectations continue to underpin the dollar's safe-haven appeal.
The Bulls' Stand: Defending the $99.40 Line
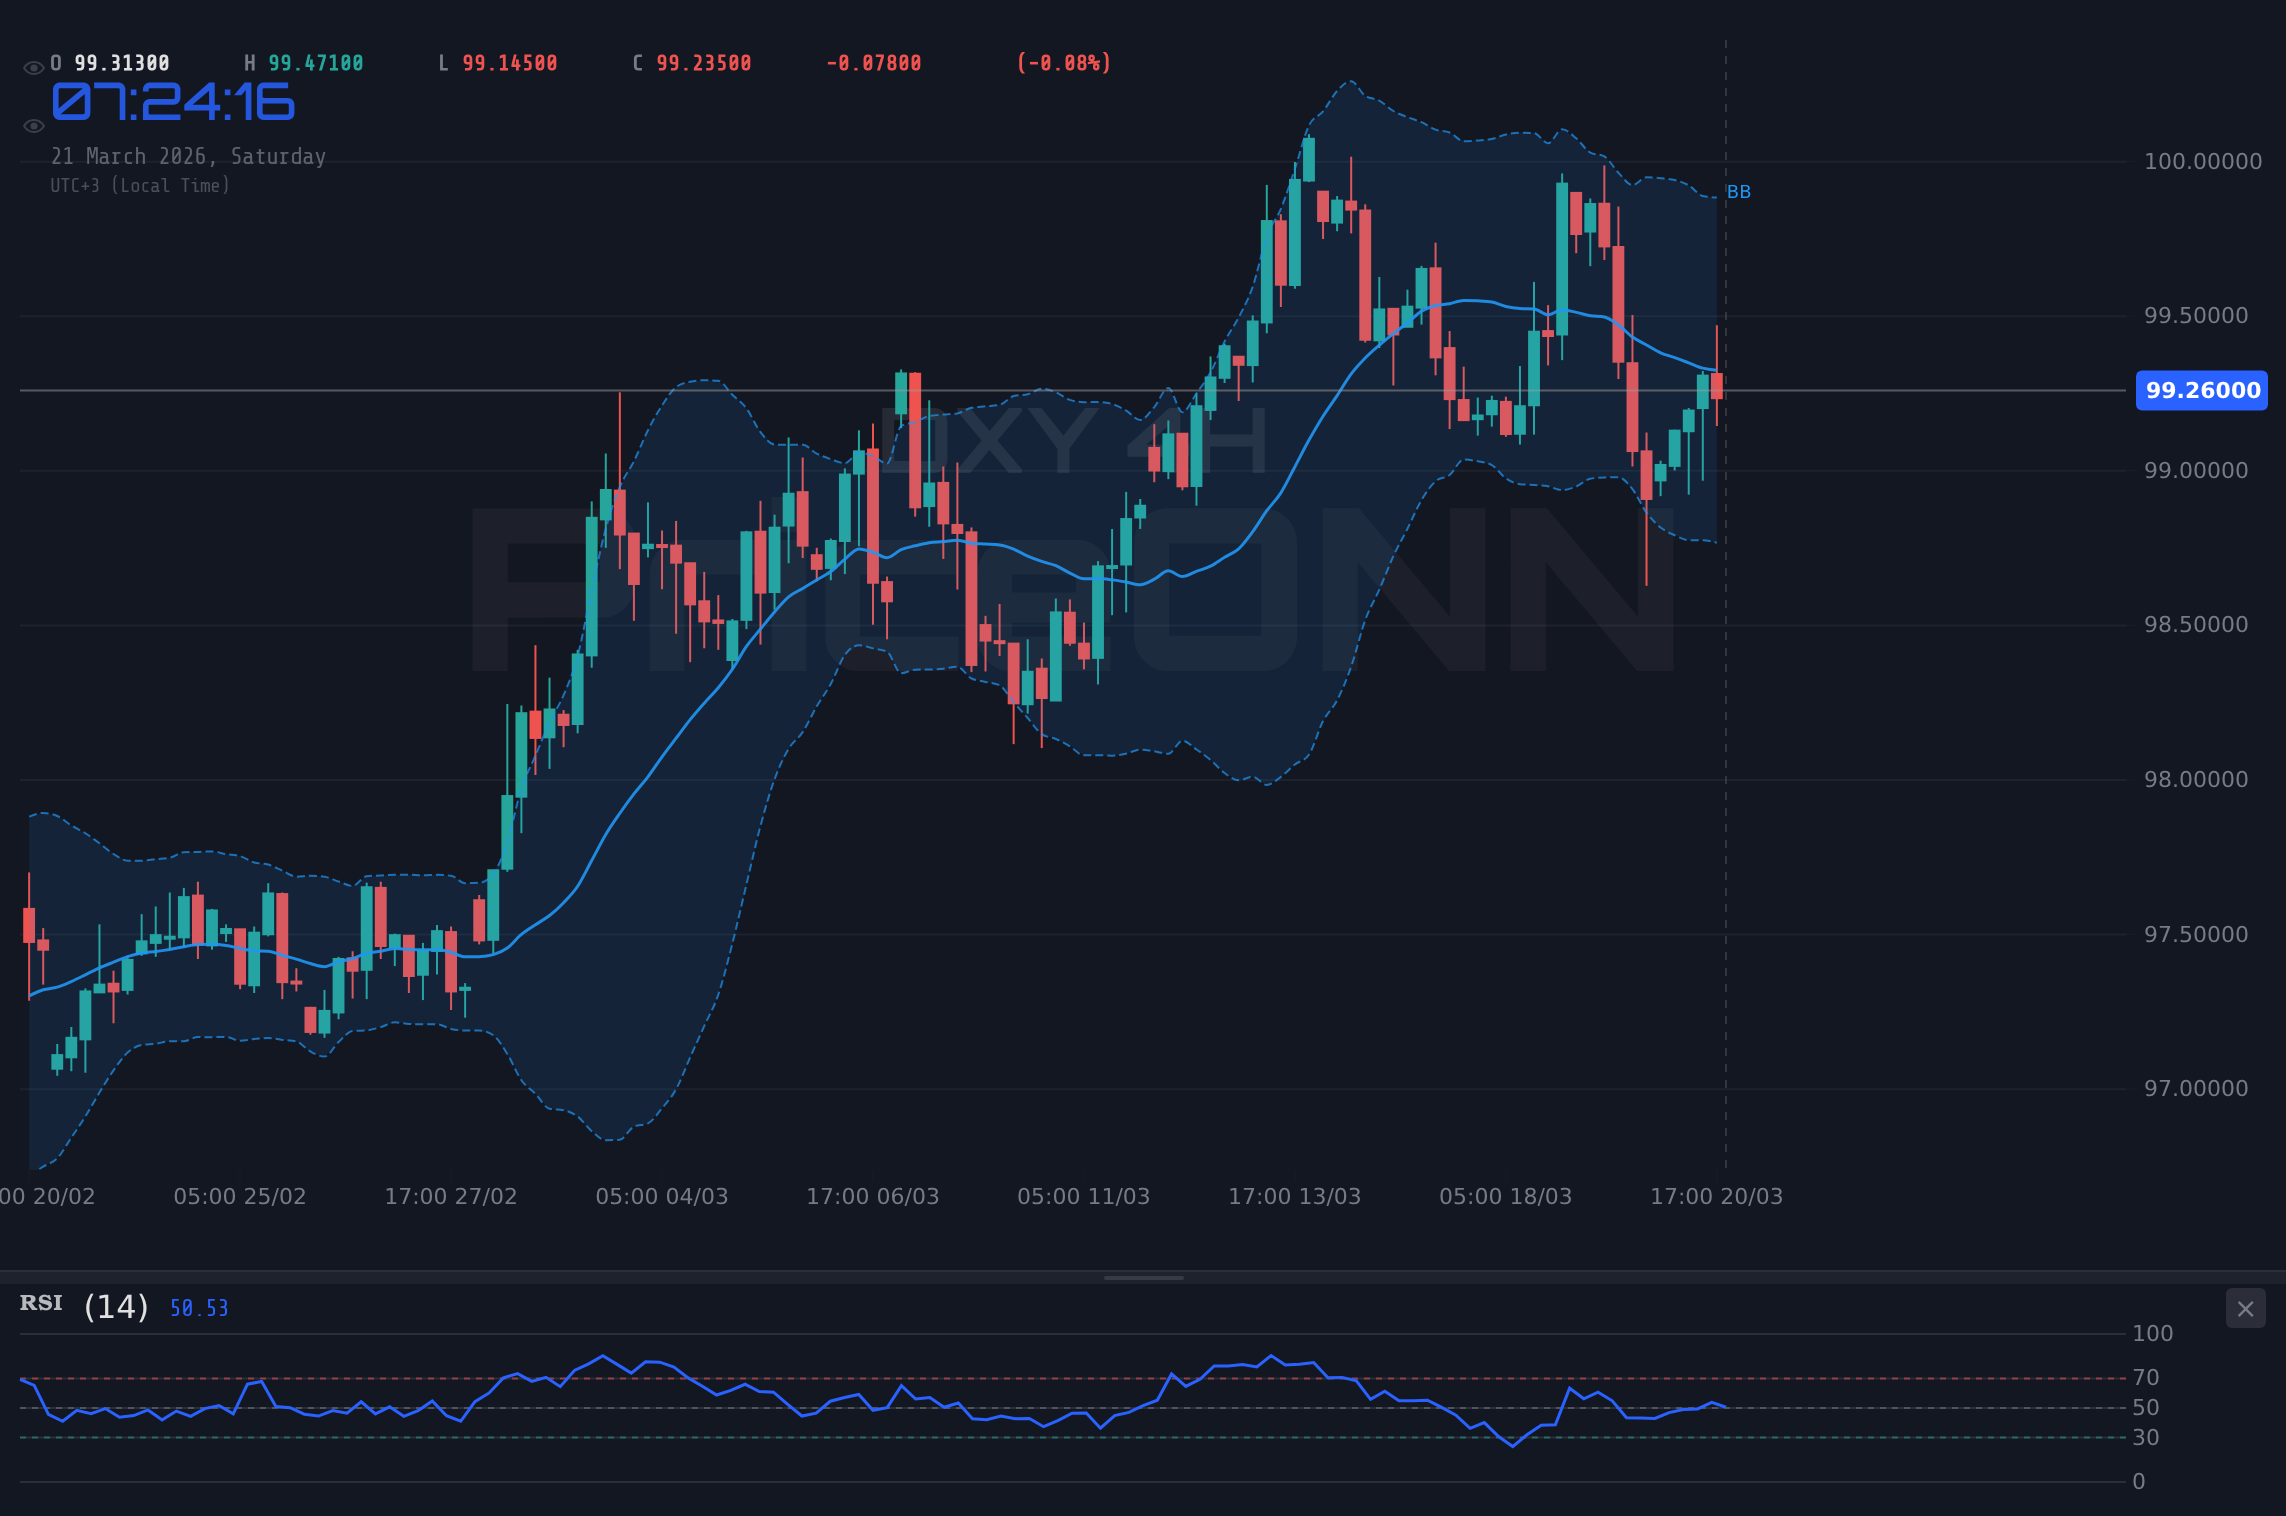
The narrative for the bulls remains centered on the Dollar Index's ability to maintain its footing above the $99.39 mark. Last week’s price action saw the DXY oscillate between a low of 98.92 and a high of 99.47, ultimately closing near the upper bound of this range. This resilience, particularly the defense of the $99.00-99.40 area, is interpreted by many as a sign of underlying strength. The daily chart paints a picture of continued upward momentum, with the RSI standing at 58.15. While not in overbought territory, this reading indicates that buyers have been in control for a sustained period, suggesting that any dips are being met with renewed buying interest. Furthermore, the Average Directional Index (ADX) on the daily timeframe is reading a robust 34.64, confirming the presence of a strong trend. This suggests that the prevailing move has significant conviction behind it, making a sharp reversal less likely without a substantial catalyst.
The bullish case is further bolstered by the current macroeconomic environment. Hawkish rhetoric from Federal Reserve officials, coupled with sticky inflation data, continues to fuel expectations of delayed or fewer interest rate cuts in the US. Futures markets, such as the CME FedWatch tool, are pricing in a significant probability of interest rates remaining higher for longer, which typically supports a stronger dollar. This interest rate differential narrative provides a fundamental underpinning for the DXY’s strength. Moreover, global geopolitical uncertainties, including escalating tensions in the Middle East and ongoing conflicts in Eastern Europe, tend to drive capital towards perceived safe-haven assets like the US dollar. The DXY's inverse correlation with riskier assets like equities (SP500 and Nasdaq, both showing significant weekly declines) and commodities like gold (which has tumbled below $4,500) reinforces this safe-haven thesis. The ability of the dollar to strengthen even as bond yields fluctuate suggests a broad-based demand driven by both monetary policy expectations and global risk aversion.
On the 1-hour timeframe, the DXY shows a slightly different picture, with the trend momentarily appearing neutral and exhibiting a strong 91% downward trend power, which is unusual given the daily trend. However, the 1-hour MACD is positive, and the Stochastic oscillator is in the overbought zone (K=88.06, D=93.24), indicating potential short-term pullbacks. This divergence between the short-term overbought conditions and the longer-term bullish trend on the daily chart presents an interesting dynamic. It suggests that while the overall trend favors the upside, immediate price action might see some consolidation or minor retracement as the market digests recent gains and awaits further directional cues. The support levels on the 1-hour chart at 159.224 and 159.103 are critical for maintaining the immediate bullish bias, while resistance at 159.423 and 159.622 could cap short-term gains.
The 4-hour chart offers a more balanced view, showing a neutral trend with 50% strength. Here, the RSI hovers around 51.52, indicating a lack of strong directional bias in the medium term. The MACD is currently negative, suggesting some selling pressure, while the Stochastic shows a buy signal (%K > %D) but is not yet in extreme territory. The ADX at 19.43 signifies a weak trend, implying that the market is likely to remain range-bound or experience choppy price action in this timeframe. This suggests that the longer-term daily trend is the dominant force, but traders operating on the 4-hour timeframe might experience a period of consolidation. The key levels to watch on this timeframe are the support at 158.678 and resistance at 159.180. A decisive move beyond these levels would be needed to confirm a directional bias on the 4-hour chart.
Looking at the broader market context, the significant weekly declines in major equity indices like the SP500 (down 1.21% to 6536.05) and Nasdaq 100 (down 1.65% to 23992.13) highlight a clear risk-off sentiment. This environment typically favors the US dollar as investors seek safety. The Dow Jones Industrial Average also closed lower, down 0.62% to 45801. This broad-based selloff in equities, coupled with the tumble in gold prices – XAUUSD fell significantly by -3.28% to $4497.65 – provides a strong backdrop for the dollar's continued strength. The inverse correlation between the dollar and these risk assets is a well-established phenomenon, and its reassertion last week reinforces the bullish narrative for the DXY. Even silver (XAGUSD), which saw a sharp -6.67% decline to $67.9, reflects this flight to safety. The strength in oil prices (Brent up 4.81% to $112.79, WTI up 3.87% to $98.5) adds another layer, potentially signaling inflationary pressures that could prompt further hawkish action from the Fed.
The Bears' Counterarguments: Cracks in the Foundation?
Despite the bullish undertones, the bears see several potential cracks in the dollar's armor. While the daily RSI at 58.15 suggests upward momentum, it also implies that the dollar index is approaching overbought territory, especially when viewed on shorter timeframes. The 1-hour Stochastic oscillator, for instance, is firmly in overbought territory (K=88.06, D=93.24), signaling a potential for a near-term pullback. This divergence between longer-term strength and short-term overbought conditions is a classic warning sign that the current rally might be losing steam and could be due for a correction. The bears are looking for a decisive break below the immediate 1-hour support at $159.224 and, more importantly, a close below the psychological $99.00 level, which would signal a potential shift in momentum.
Furthermore, the neutral trend on the 4-hour chart (ADX 19.43) suggests that the current upward move may lack sustained conviction. A weak trend reading like this often precedes consolidation or reversal patterns. If the DXY fails to break decisively above key resistance levels, such as the 4-hour resistance at 159.43 or the daily resistance at 159.72, it could invite sellers back into the market. The bears are particularly watchful of any signs that the Federal Reserve might be nearing a pivot or that inflation is cooling faster than anticipated, which would reduce the impetus for further dollar strength based on interest rate differentials. News regarding de-escalation of geopolitical tensions, while perhaps unlikely in the short term, could also remove a key pillar supporting the dollar's safe-haven status.
The performance of other major currency pairs offers some conflicting signals that the bears might exploit. While EURUSD is technically in a downtrend on the daily chart (ADX 37.37), its 1-hour and 4-hour charts show a neutral to bullish trend, with RSI above 50. This suggests that the Euro is not capitulating entirely against the dollar, implying potential for a bounce that could weigh on the DXY. Similarly, USDJPY, despite its strong upward move (daily trend: Neutral, 50% strength), shows divergence with its daily Stochastic in a downtrend signal (%K
From a technical perspective, the daily chart shows resistance levels at $99.72, $100.54, and $101.08. A failure to decisively break and hold above these levels could lead to a significant pullback. The bears are eyeing a potential move back towards the daily support levels, starting with $98.36, then $97.82, and potentially $97.00 if a broader risk-off sentiment reverses or the Fed signals a less hawkish stance. The presence of significant overhead resistance, combined with short-term overbought conditions on the 1-hour chart, creates a scenario where a correction is plausible. The market’s reaction to upcoming economic data, particularly inflation and employment figures, will be crucial in determining whether the DXY can push higher or if it's poised for a retracement.
The current market structure, as indicated by the ADX readings across different timeframes, presents a mixed picture. While the daily chart shows a strong trend (ADX 34.64), the 4-hour (ADX 19.43) and 1-hour (ADX 22.64) charts suggest weaker trends or potential consolidation. This means that while the long-term bias might be bullish, short-to-medium term traders could face a more range-bound environment. The bears are hoping that the weaker trend signals on shorter timeframes will eventually drag down the daily trend, leading to a more substantial correction. They are particularly sensitive to any shifts in central bank policy expectations or a significant easing of geopolitical fears, which could quickly erode the dollar's safe-haven appeal and trigger a sell-off.
Navigating the Cross-Currents: Scenarios Ahead
The DXY finds itself at a critical juncture, poised between the persistent strength of its daily uptrend and the cautionary signals from shorter timeframes and conflicting market correlations. The battle at the $99.39 level is emblematic of this tension. On one hand, the fundamental backdrop - hawkish Fed expectations, sticky inflation, and global risk aversion - provides a solid foundation for continued dollar strength. The safe-haven flows, evidenced by the sharp declines in equities and gold, are currently dominating market sentiment, acting as a tailwind for the dollar index.
On the other hand, technical indicators on shorter timeframes are flashing warnings of overbought conditions and potential consolidation. The Stochastic oscillator on the 1-hour chart is deep in overbought territory, and the ADX readings on the 1-hour and 4-hour charts suggest weakening trend strength compared to the daily timeframe. This suggests that the immediate path higher might not be a straight line, and traders should be prepared for potential pullbacks or sideways movement. The interplay between these conflicting signals will likely define the DXY's price action in the coming days and weeks.
The recent news flow underscores the complexity. While reports highlight gold's tumble below $4,500 due to rising US yields and a hawkish Fed outlook, they also point to escalating Gulf tensions, which typically support safe-haven assets like the dollar. The S&P 500's plunge below key support levels and the Dow Jones's losses further emphasize the risk-off environment. However, the fact that the DXY is not making explosive moves higher suggests that the market is absorbing this information without a full-blown panic, perhaps anticipating that central banks will eventually manage inflation without triggering a severe recession. The neutral to slightly bullish signals from EURUSD on shorter timeframes also bear watching; a sustained bounce in the Euro could cap dollar gains.
Considering these dynamics, the most probable scenario in the short term involves continued consolidation around the current levels, with a slight bias towards the upside given the daily trend strength and prevailing risk-off sentiment. However, any significant shift in Fed expectations, a de-escalation of geopolitical conflicts, or a surprising improvement in economic data from other major economies could quickly alter the picture. Traders should remain vigilant, paying close attention to the $99.00 support and the $99.72 resistance levels as key inflection points. The strength of the trend on the daily chart is undeniable, but the market often requires consolidation periods after significant moves, especially when facing technical resistance and short-term overbought signals.
The interplay between inflation, interest rates, and geopolitical risk will be the dominant theme. If inflation remains stubbornly high, the Fed will likely maintain its hawkish stance, supporting the DXY. Conversely, any indication that the Fed is becoming concerned about the economic impact of higher rates or geopolitical fallout could lead to a dollar correction. The current price action around $99.39 suggests a market in a holding pattern, waiting for clearer direction. The bulls have defended the level, but breaking higher requires overcoming significant resistance and short-term technical headwinds. The bears, meanwhile, are waiting for a decisive break of support to confirm their thesis. Until then, expect choppy, range-bound trading with a slight upward bias.
The Verdict: Cautious Optimism as Bulls Defend Key Levels
After weighing the evidence, the prevailing sentiment leans towards cautious optimism for the US Dollar Index (DXY) as we look ahead from last week's close. The bulls have successfully defended the critical $99.39 level, a testament to the dollar's ongoing strength, underpinned by a combination of a robust daily uptrend (ADX 34.64), hawkish Federal Reserve expectations, and persistent global geopolitical risks. The flight-to-safety narrative, clearly demonstrated by the significant sell-offs in equities and gold, continues to favor the dollar. While short-term technical indicators on the 1-hour chart show overbought conditions and suggest potential for consolidation or minor pullbacks, the longer-term daily trend remains firmly intact.
The bears' arguments, while valid concerning short-term overbought signals and the potential for consolidation, do not yet outweigh the dominant fundamental and longer-term technical drivers. The neutral trend on the 4-hour chart indicates a period of digestion rather than an outright reversal. The key for the bulls will be to maintain price action above the $99.00-99.39 support zone and to eventually break through the resistance cluster around $99.72. A sustained move above this resistance could open the door for a test of the $100.00 psychological level and beyond, aligning with the strong daily trend. Failure to do so, however, could lead to a deeper correction, especially if geopolitical tensions ease or the Fed signals a dovish shift.
The market is currently in a phase where immediate directional conviction is tempered by the need for consolidation. The DXY's ability to hold its ground amidst broad market weakness is a significant indicator of its underlying strength. This suggests that while volatility may increase, the dollar's appeal as a safe haven remains potent. For traders, this environment calls for patience and a focus on risk management. Observing how price action behaves around the identified key levels - $99.00 as support and $99.72 as resistance - will be crucial in determining the next significant move. The overall picture, however, remains one where the dollar has the fundamental wind at its back, even if short-term price action suggests a pause for breath.
Bearish Scenario: Dollar's Grip Loosens
25% ProbabilityNeutral Scenario: Consolidation Around $99.40
55% ProbabilityBullish Scenario: Dollar's Ascent Continues
20% ProbabilityFrequently Asked Questions: DXY Analysis
What happens if DXY breaks below $99.00 support this week?
A daily close below $99.00 would invalidate the current bullish consolidation pattern. This could trigger a move towards the next support at $97.82, as bears gain control and test longer-term uptrend validity.
Is the RSI at 58.15 a buy signal for DXY right now?
An RSI of 58.15 on the daily chart indicates upward momentum but is not yet overbought, suggesting potential for further gains. However, a sustained break above 60 would be a stronger buy signal, while a move back below 50 could signal weakening. It suggests underlying strength but not immediate extreme buying pressure.
How will the upcoming Fed meeting affect DXY if they signal no rate cuts?
If the Fed maintains a hawkish stance and signals no rate cuts, it would likely reinforce the DXY's strength. This would support a move above $99.72 resistance, potentially targeting $100.00, as interest rate differentials remain favorable for the dollar.
Should traders consider buying DXY at current levels of $99.39 given the mixed short-term signals?
Buying at $99.39 requires careful risk management due to mixed signals on shorter timeframes. A strategy might involve waiting for confirmation of a break above $99.72 resistance for a bullish entry, or waiting for a dip to test $99.00 support, looking for bullish reversal patterns.
The path forward for the DXY remains intricately linked to the evolving global economic landscape and the Federal Reserve's policy stance. While last week's price action demonstrated resilience, the market is clearly at a point where conviction is being tested. The bulls have the advantage of a strong daily trend and supportive macro factors, but the bears are watching closely for any signs of weakness, particularly around the $99.72 resistance level. Patience and disciplined risk management will be paramount for navigating this period of consolidation. The market's ability to digest current geopolitical risks and inflation data will ultimately dictate whether the dollar can extend its gains or if a deeper correction is on the horizon. For now, the $99.39 level remains a critical pivot point, with the potential for both upward continuation and a short-term pullback.
Track markets in real-time
AI-powered analysis, technical indicators and real-time price data.
Join Our Telegram Channel
Breaking market news, AI analysis and trading signals instantly.
Join Channel