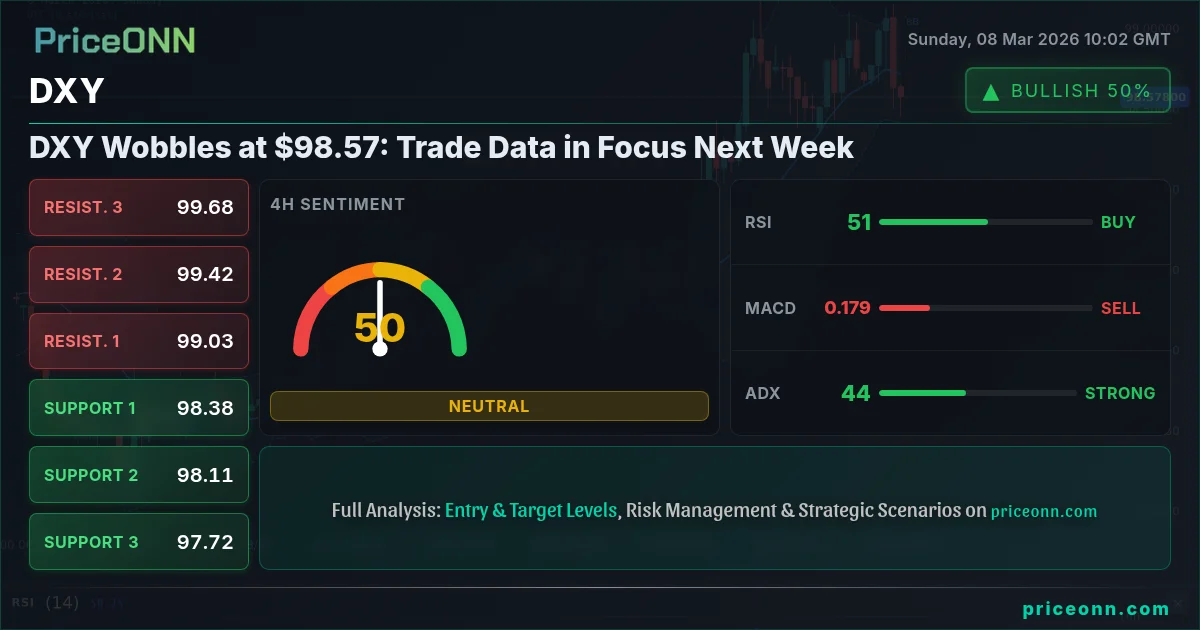
Can the dollar maintain its grip, or will trade data trigger a reversal? The Dollar Index (DXY) is currently trading near $98.57, a level where bulls and bears are locked in a tug-of-war. The fed rate decision impact on dollar index remains a key concern, especially with upcoming trade data releases poised to inject volatility into the market.
- DXY is trading at $98.57, with short-term direction dependent on upcoming trade data.
- Key support sits at 98.49, tested multiple times this week, while resistance looms at 98.7.
- MACD histogram shows positive momentum on the 1D timeframe, but it is below the signal line; bearish momentum is present.
- Fed rate expectations are driving the DXY correlation with gold and major currency pairs, with traders awaiting further clues from economic data.
The Bull Case for DXY
The bullish argument for the Dollar Index hinges on several factors. First, the relative strength of the U.S. economy compared to other major economies. While the U.S. has seen its share of challenges, economic data signals mixed trends across major economies, impacting forex markets, as noted in recent forex analysis. The 1D chart for DXY shows that the RSI is at 62.55, which is slightly above the neutral level, indicating bullish strength. The ADX is at 22.36, showing the presence of a medium-strength upward trend. The positive reading on the daily ADX suggests that the existing uptrend, though not overwhelmingly strong, still has some room to run.
Geopolitical tensions, particularly the escalating oil crisis, have been a boon for the dollar as well. Escalating tensions in the Middle East have triggered a sharp increase in crude oil prices, impacting global forex markets. As traders seek safe-haven assets, the dollar often benefits. The dollar index (DXY) climbs to a one-and-a-half-month high amid geopolitical tensions, as stated by PriceONN market news. Furthermore, the Fed's relatively hawkish stance compared to other central banks provides additional support. While other central banks are contemplating easing measures, the Fed is expected to maintain its current course, making the dollar more attractive to yield-seeking investors.
The Bear Case for DXY
Conversely, the bearish argument centers on the possibility that the Fed may be forced to pivot sooner than expected. The February jobs report was uniformly negative, with Nonfarm payrolls slipping by 92K, labor force participation rates declining, and wage growth slowing. This could prompt the Fed to adopt a more dovish stance, weakening the dollar. Also, the global economic week ahead has UK GDP momentum, Canadian labor concerns, which could affect DXY as well.
Technically, the 1H chart shows the RSI at 41.01, indicating bearish momentum. The MACD is also negative, suggesting that the bears have a slight edge in the short term. The Stochastic is at 20.05, indicating oversold conditions, which could lead to a short-term bounce. However, the overall trend remains downward, as indicated by the ADX at 17.15. The bear camp also points to the potential for a weakening U.S. economy. If growth slows significantly, the Fed may be forced to cut rates, which would weigh on the dollar. The recent U.S. Weekly Economic & Financial Commentary highlighted the negative jobs report, adding fuel to the bearish narrative. The U.S. Dollar Index (DXY) faces a critical test as it navigates a complex landscape of economic data and geopolitical tensions. The fed rate decision impact on dollar index remains a key concern for traders.
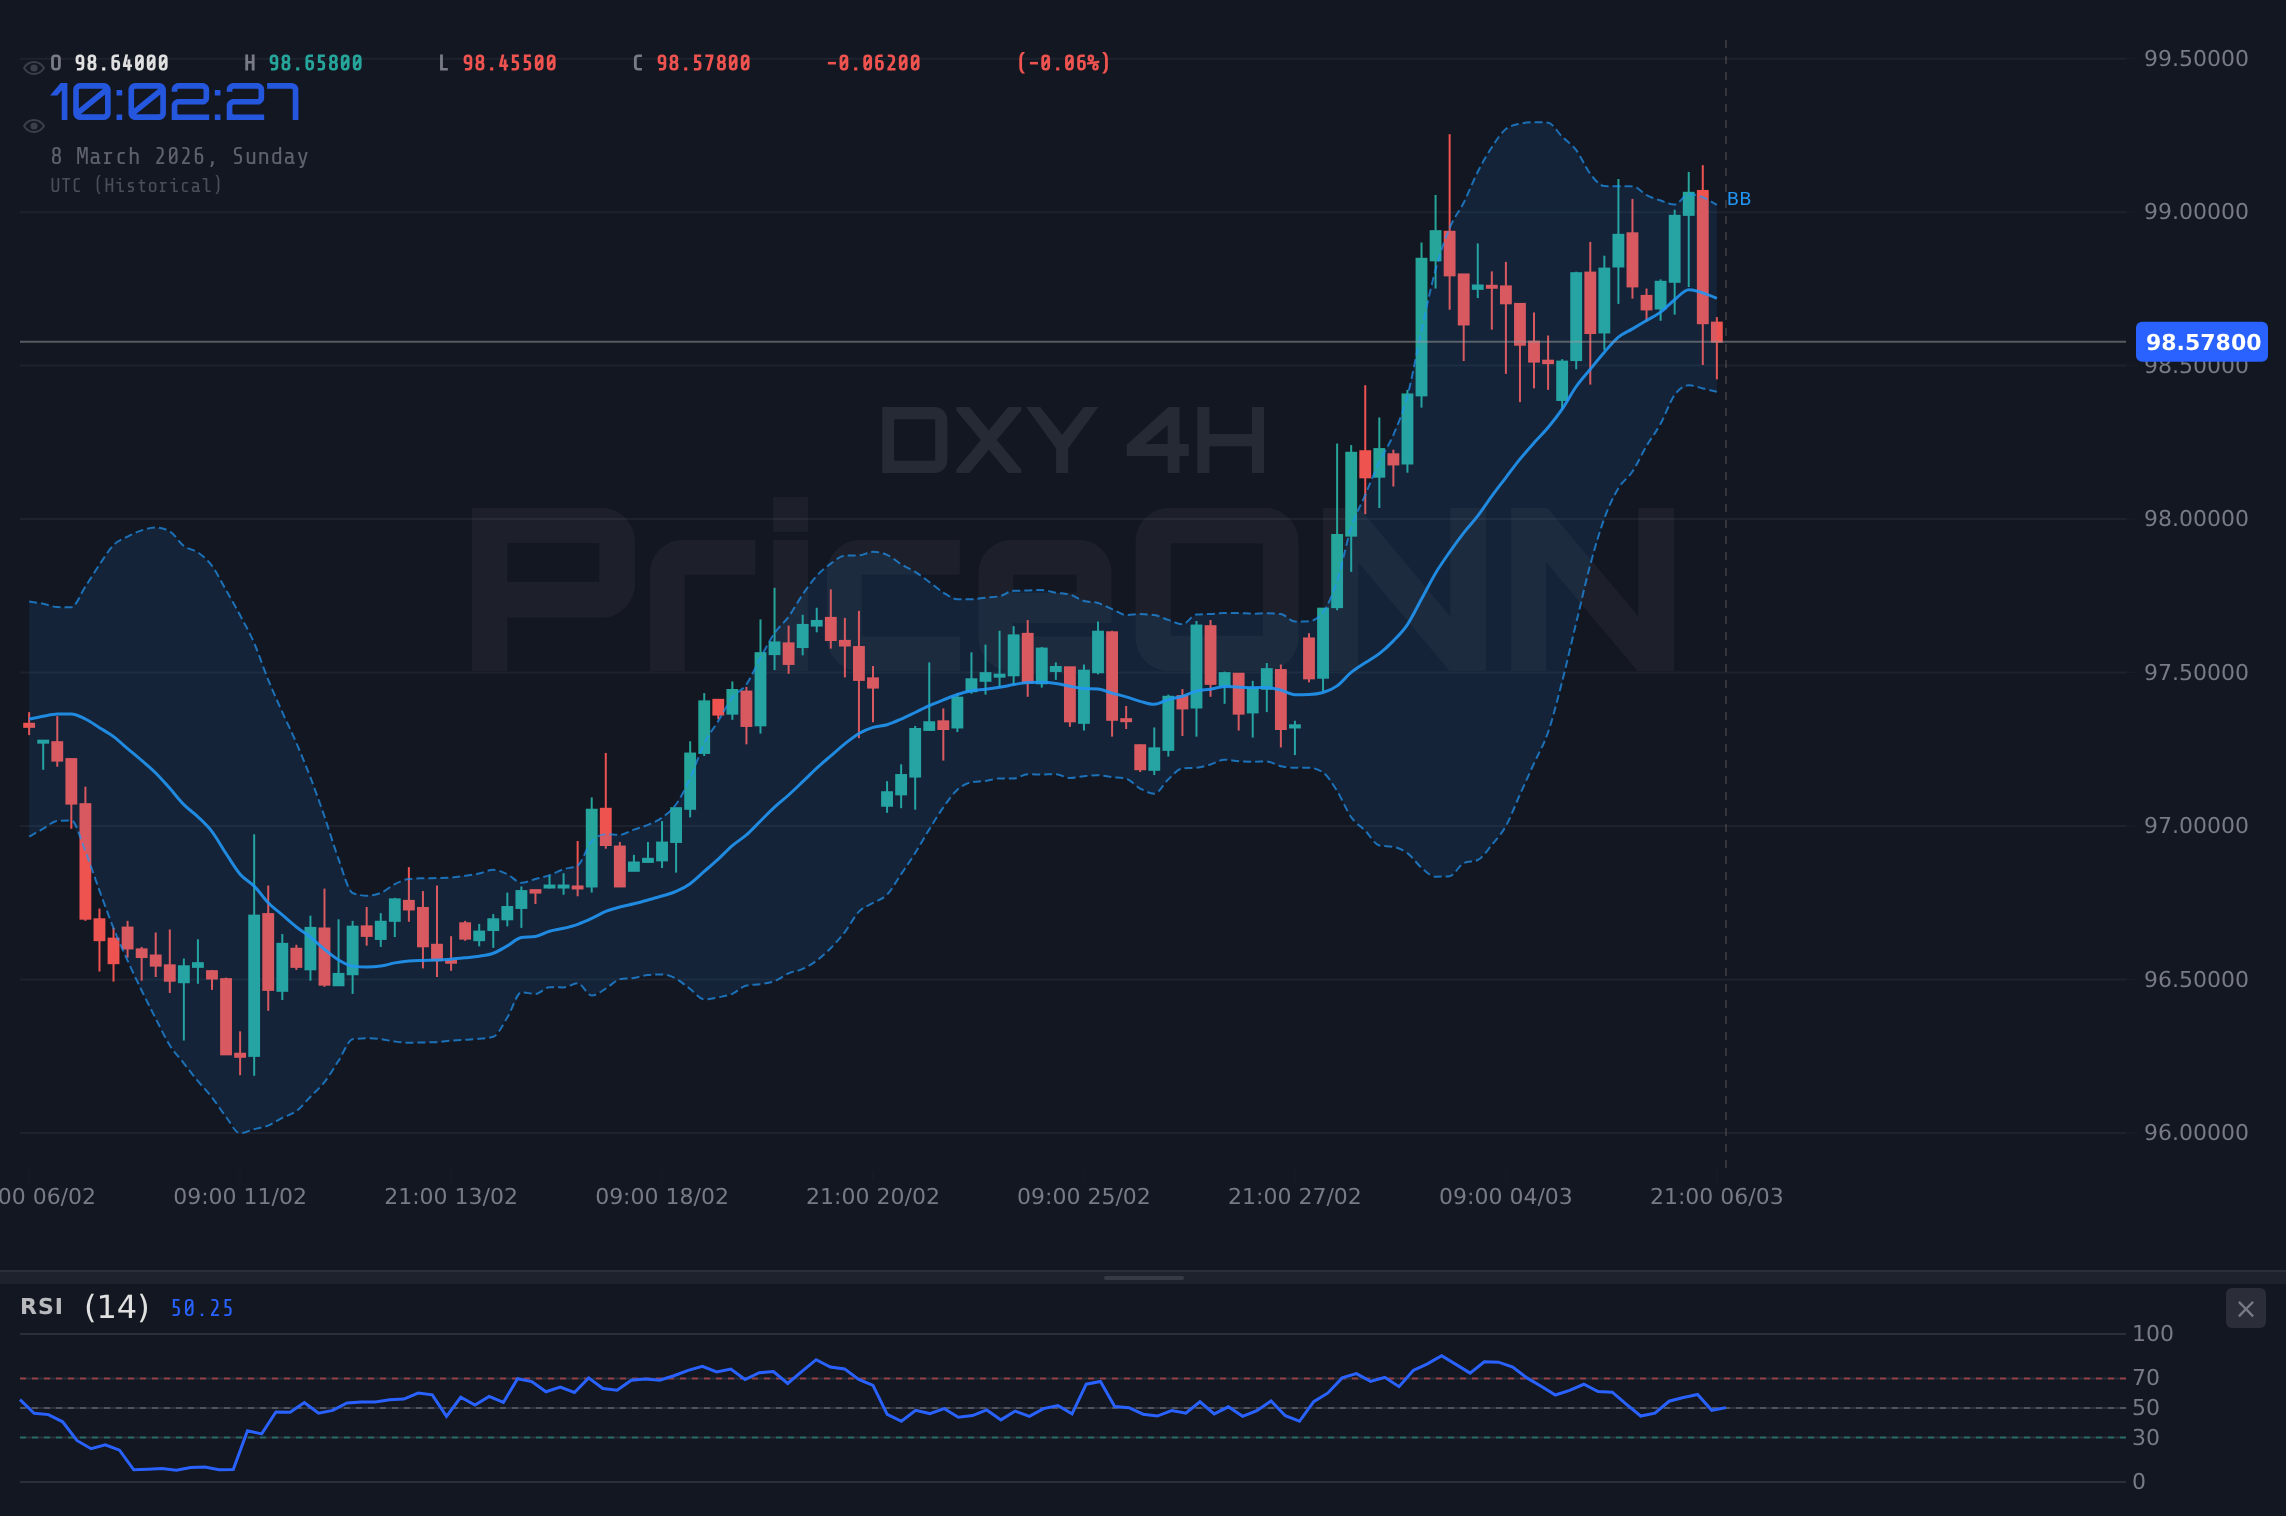
Technicals as the Tiebreaker: DXY at $98.57
Looking at the technicals, the DXY is at a critical juncture. On the 1H chart, immediate resistance is at 98.7, followed by 98.78 and 98.9. Support sits at 98.49, with subsequent levels at 98.37 and 98.29. A break above 98.7 could signal a continuation of the bullish trend, while a break below 98.49 could lead to further downside. The 4H chart shows a strong upward trend with an ADX of 44.54, indicating bullish strength. However, the RSI is at 50.96, which is neutral, suggesting that the market is neither overbought nor oversold. The Stochastic is at 64.26, indicating bullish momentum. The 1D chart shows an RSI of 62.55, indicating bullish strength. The MACD is positive, suggesting that the bulls are in control. However, the Stochastic is at 70.48, which is nearing overbought conditions.
Multi-timeframe analysis reveals a mixed picture. The short-term charts (1H and 4H) show a bullish bias, while the daily chart shows a more neutral outlook. This suggests that the DXY could experience some short-term gains before facing resistance at higher levels. The DXY's price action analysis reveals a market grappling with conflicting forces. The fed rate decision impact on dollar index remains a dominant theme, influencing trader sentiment and technical patterns alike. With the DXY trading at $98.57, a decisive move above or below the immediate support and resistance levels will likely dictate its next direction.
Next Week's Expectations: Trade Data and the Fed
Next week, the focus will be on the upcoming trade data releases. The USD releases on March 06, 2026, will be closely watched for insights into the health of the U.S. economy. Strong trade data could reinforce the bullish narrative, while weak data could trigger a reversal. The JPY data on March 09, 2026, will also be important, as it could affect the yen and, in turn, the DXY. Traders should also keep an eye on the UK GDP momentum and Canadian labor concerns, as these could impact the broader forex market. The EUR data on March 11, 2026, will provide further clues about the health of the Eurozone economy. If the data is weak, it could put downward pressure on the euro and support the dollar.
The Fed will also be in focus next week. While no rate decision is expected, any comments from Fed officials could move the market. If Fed officials reiterate their hawkish stance, it could provide additional support for the dollar. The fed rate decision impact on dollar index is evident in the market's sensitivity to any Fed commentary. Given the current technical setup and the upcoming economic data releases, the DXY is likely to remain range-bound in the short term. A breakout above 98.7 or a breakdown below 98.49 could signal a more significant move. In the medium term, the DXY's direction will depend on the Fed's policy stance and the performance of the U.S. economy relative to other major economies.
Frequently Asked Questions: DXY Analysis
Is DXY a good buy right now?
With DXY trading at $98.57, it's a mixed bag; the 1H chart is showing bearish momentum, while the daily chart is showing bullish strength; caution is advised. A break above 98.7 or a breakdown below 98.49 could signal a more significant move.
What is the DXY price forecast for this week?
The DXY is likely to remain range-bound in the short term, between 98.49 and 98.7. A decisive break of either level could trigger a more substantial move; a test of 99.0 is possible in the medium term if bullish pressures persist.
What are the key support and resistance levels for DXY?
Key support is at 98.49, followed by 98.37 and 98.29. Resistance sits at 98.7, with subsequent levels at 98.78 and 98.9; these levels must be respected to define the trend.
Why is DXY moving today?
DXY is reacting to mixed signals, with the February jobs report raising concerns about a potential Fed pivot even as geopolitical tensions provide safe-haven demand. The market is waiting for confirmation from upcoming trade data.
Track markets in real-time
AI-powered analysis, technical indicators and real-time price data.
Join Our Telegram Channel
Breaking market news, AI analysis and trading signals instantly.
Join Channel