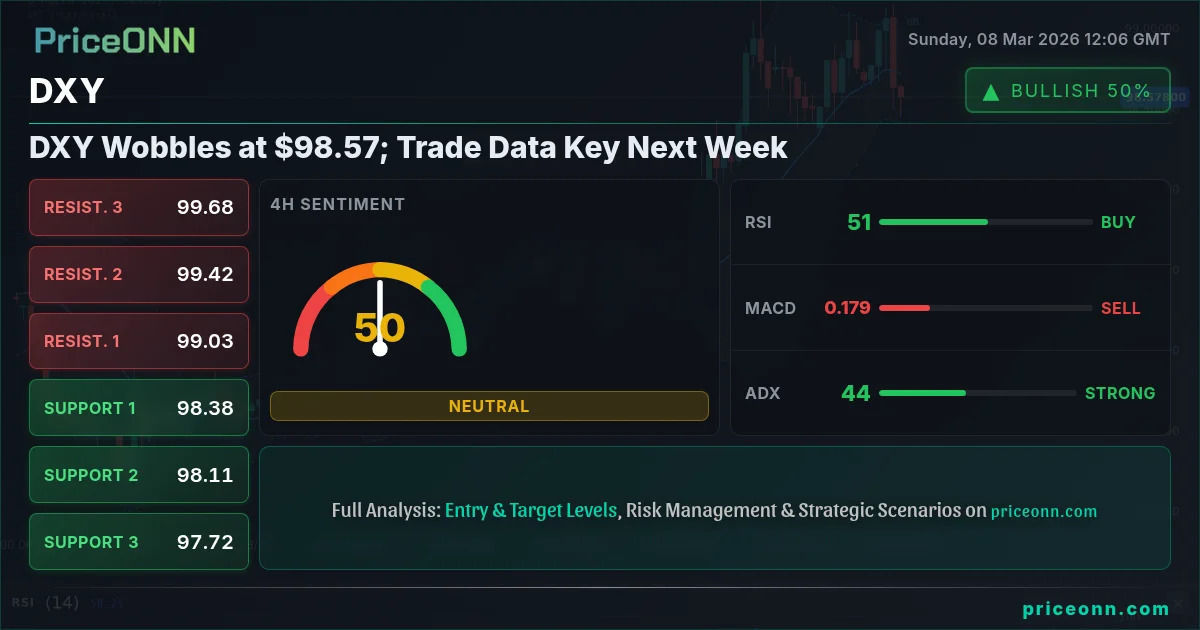
As the trading week concludes, the Dollar Index (DXY) hovers around $98.57, exhibiting a slight pullback after a week of mixed signals. The index, which measures the dollar's strength against a basket of six major currencies, is currently navigating a confluence of factors, including fluctuating risk sentiment, shifting Federal Reserve expectations, and anticipation of key trade data releases next week. The question now is whether the bulls can defend this level or if the bears will seize control.
- RSI at 41.01 on the 1H chart suggests potential for further downside pressure in the short term.
- Critical support lies at 98.49, a break below which could trigger a steeper decline.
- MACD histogram shows negative momentum, indicating bearish sentiment is currently in play.
- Upcoming trade data releases next week are expected to be a key driver for DXY volatility.
DXY today analysis reveals a market in search of direction. The dollar index bullish or bearish signals are currently mixed, reflecting the ongoing debate about the Fed's next move. After the recent jobs report, which showed a slip of 92K in nonfarm payrolls, markets are reassessing the likelihood of aggressive rate cuts this year. This uncertainty is weighing on the dollar, preventing it from mounting a sustained rally.
The technical picture for DXY is equally ambiguous. On the 1-hour chart, the RSI sits at 41.01, suggesting potential for further downside. However, the 4-hour chart paints a different picture, with the RSI at 50.96, indicating a more neutral stance. The daily chart, with an RSI of 62.55, suggests that the dollar still retains some underlying strength. Adding to the complexity, the ADX on the 4-hour chart reads 44.54, signaling a strong uptrend, while the 1-hour ADX is a mere 17.15, suggesting a weak trend. This divergence across timeframes highlights the market's indecisiveness.
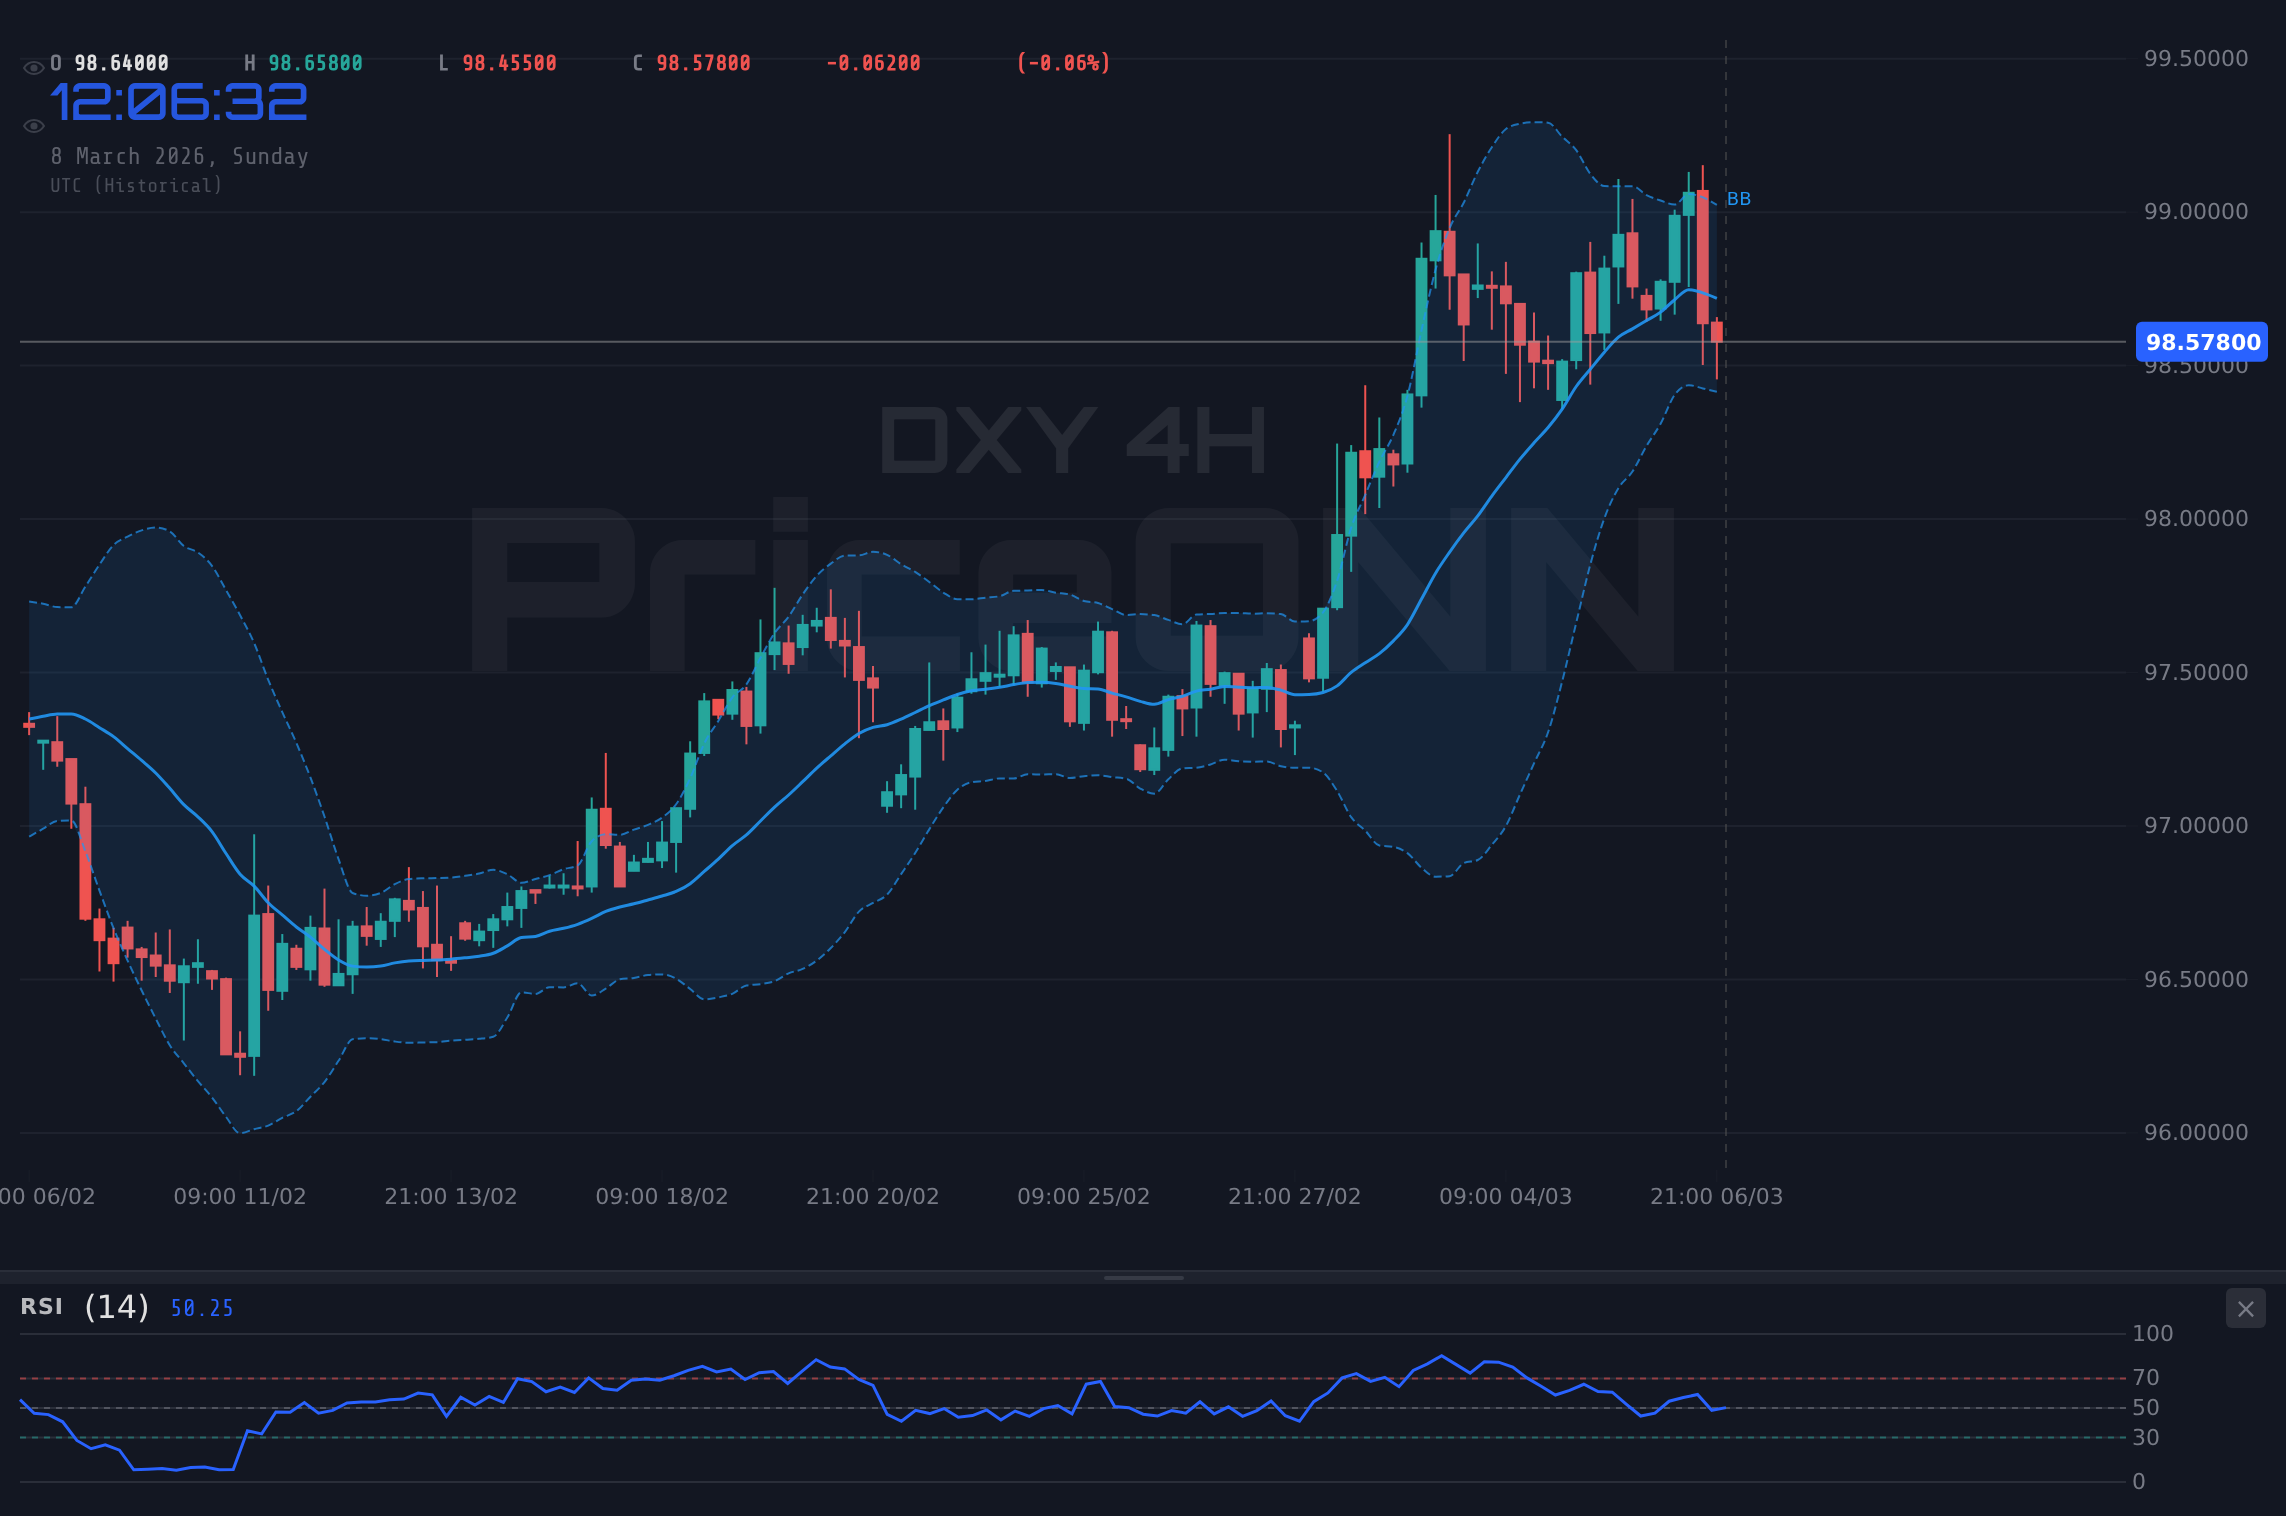
Key levels to watch for DXY include immediate support at 98.49, followed by 98.37 and 98.29. A break below 98.49 could open the door for a test of the lower levels. On the upside, initial resistance lies at 98.70, with further resistance at 98.78 and 98.90. A sustained move above 98.70 would suggest that the bulls are regaining control.
Looking at the broader market context, the recent oil crisis, triggered by Middle East tensions, is adding another layer of complexity to the DXY's outlook. As reported by PriceONN market news, the surge in crude oil prices is impacting global forex markets, with EUR/CAD experiencing a sharp decline. This flight to safety could indirectly support the dollar, as investors seek refuge in U.S. assets. However, rising oil prices could also fuel inflation concerns, potentially prompting the Fed to maintain its hawkish stance, which could be a double-edged sword for the dollar.
Furthermore, the SP500 and Nasdaq are exhibiting signs of weakness, with both indices experiencing daily declines of -1.07% and -1.25%, respectively. This risk-off sentiment could provide a tailwind for the dollar, as investors reduce their exposure to riskier assets. However, a sustained equity market correction could also weigh on the overall economic outlook, potentially prompting the Fed to adopt a more dovish stance, which could be bearish for the dollar.
The upcoming trade data releases next week will be crucial in determining the DXY's next direction. These releases will provide insights into the health of the global economy and the impact of trade policies on the U.S. dollar. Strong trade data could boost the dollar, while weak data could trigger a sell-off. Investors will be closely watching these releases for clues about the Fed's next move.
The 1H Stochastic registers 20.05/32.4, signaling oversold conditions, even as the 4H registers 64.26/63.47, signaling a potential bull run. This is exactly where patience is rewarded. One must wait for the market to show its hand. If the market breaks upward, we could see DXY challenge 99.00. If the bears press, we could see a test of 98.00.
From a trading perspective, a "watch zone" approach seems prudent at current levels. The mixed technical signals and the uncertainty surrounding the upcoming trade data releases suggest that it is best to remain on the sidelines until a clearer picture emerges. A daily close above 98.70 would open the door for a test of 99.00, while a break below 98.49 could trigger a steeper decline towards 98.00.
The strength of the dollar has implications across global markets. With DXY at 98.57, gold is under pressure. The inverse relationship between the dollar and gold means that a stronger dollar typically weighs on gold prices, as it makes the metal more expensive for buyers using other currencies. EURUSD is also feeling the effects of the dollar's strength. The pair is currently trading at 1.16115, but further dollar strength could push it towards lower levels.
The economic calendar for the coming week is relatively light, with no major U.S. data releases scheduled until Tuesday, March 10th, when trade balance figures are released. This gives traders some breathing room to digest the recent jobs report and assess the overall economic outlook. However, the lack of major data releases also means that the market could be more susceptible to geopolitical risks and other unforeseen events. Investors are also awaiting the JPY data on Monday, March 9th.
The medium-term outlook for DXY remains uncertain. The Fed's policy path is still unclear, and the global economic outlook is subject to a number of risks. However, the dollar's safe-haven appeal and its relatively high interest rates could provide some support, even in the face of these challenges. The dollar index forecast depends heavily on the data next week.
Looking ahead, traders should focus on monitoring the key support and resistance levels outlined above, as well as closely following the upcoming trade data releases. A breakout above 98.70 would signal a bullish continuation, while a break below 98.49 would suggest that the bears are gaining control. Patience and disciplined risk management will be key to navigating these choppy waters.
Frequently Asked Questions: DXY Analysis
Is DXY a good buy right now?
At its current level of $98.57, DXY presents a mixed picture. With the RSI at 41.01 on the 1H chart, there's potential for downside, suggesting caution. Traders should wait for a break above 98.70 or a hold above 98.49 to consider a buy.
What is the DXY price forecast for this week?
The DXY price forecast for this week is highly dependent on the upcoming trade data releases. A bullish scenario would see a test of 99.00, while a bearish scenario could lead to a decline towards 98.00. The probability of either scenario is roughly 50/50 at this point.
What are the key support and resistance levels for DXY?
Key support levels for DXY are 98.49, 98.37, and 98.29. Key resistance levels are 98.70, 98.78, and 98.90. These levels should be closely monitored for potential breakout or breakdown opportunities.
Why is DXY moving today?
DXY is moving today due to a combination of factors, including fluctuating risk sentiment, shifting Federal Reserve expectations, and anticipation of key trade data releases next week. The recent jobs report has added to the uncertainty, weighing on the dollar.
Volatility creates opportunity-those prepared will be rewarded. With disciplined risk management, these choppy waters can be navigated safely.
Technical Outlook Summary
| Indicator | Value | Signal |
|---|---|---|
| RSI (14) | 41.01 (1H) | Bearish |
| MACD Histogram | Negative | Bearish |
| Stochastic | 20.05/32.4 (1H) | Oversold |
| ADX | 44.54 (4H) | Strong Trend |
| Bollinger | Middle Band | Watch |
Key Levels
Support Levels
Resistance Levels
Track markets in real-time
AI-powered analysis, technical indicators and real-time price data.
Join Our Telegram Channel
Breaking market news, AI analysis and trading signals instantly.
Join Channel