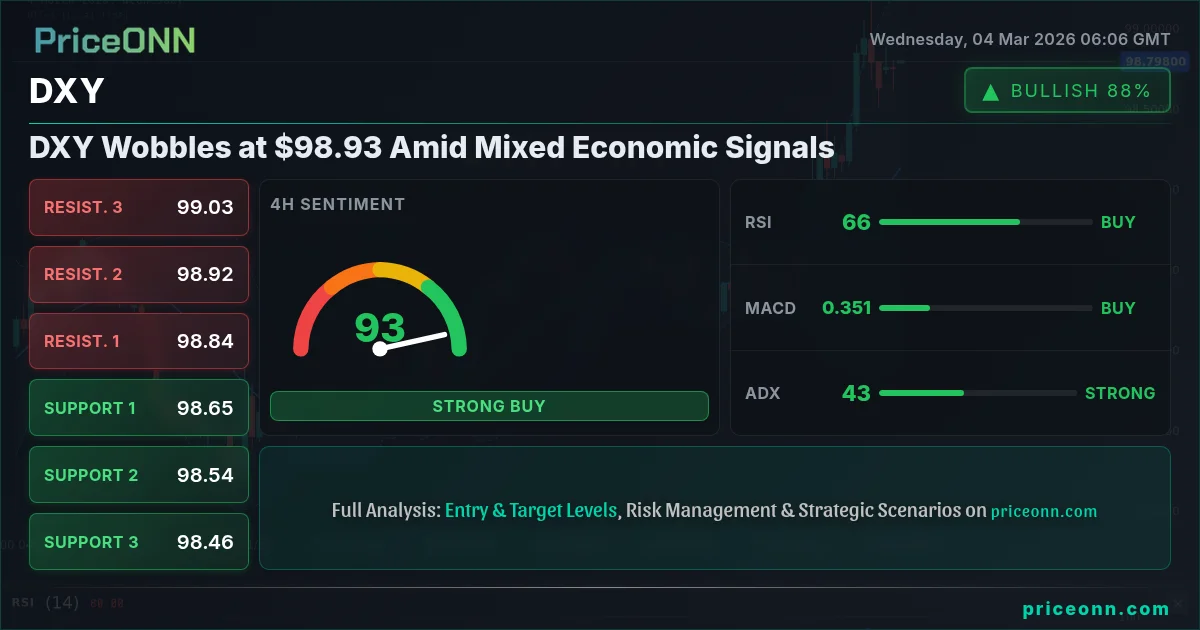
The dollar index (DXY), currently trading at $98.93, finds itself in a precarious position as traders grapple with a confluence of factors: mixed economic data, rising geopolitical tensions, and shifting central bank expectations. The immediate direction of the dollar hinges on the upcoming U.S. ADP Nonfarm Employment Change and Services PMI data, both due later today, which could provide clearer signals about the health of the U.S. economy.
- DXY is currently trading at $98.93, struggling to maintain upward momentum amid conflicting signals.
- Key support level lies at 98.69, a break below which could trigger a sharper decline.
- Geopolitical risks, particularly tensions involving Iran and the US, are injecting volatility into forex markets.
- Upcoming U.S. ADP Nonfarm Employment Change and Services PMI data will be crucial in determining DXY's near-term trajectory.
The forex market has been roiled by escalating geopolitical tensions, particularly involving the US, Israel, and Iran. As reported by Forex News, these tensions are fueling risk-off sentiment, which typically benefits the dollar as a safe-haven asset. However, the dollar's gains have been tempered by uncertainty surrounding the U.S. economic outlook. The mixed economic signals are further complicating the picture for DXY analysis today.
The U.S. economic calendar is packed with key releases this week, starting with today’s ADP Nonfarm Employment Change. This data, often seen as a precursor to the official nonfarm payrolls report, is expected to provide insights into the strength of the labor market. Economists are also closely watching the U.S. Services Purchasing Managers Index (PMI), which is expected to come in at 52.3, slightly below the previous reading of 52.7. A weaker-than-expected PMI could raise concerns about a slowdown in the services sector, which has been a key driver of U.S. economic growth.
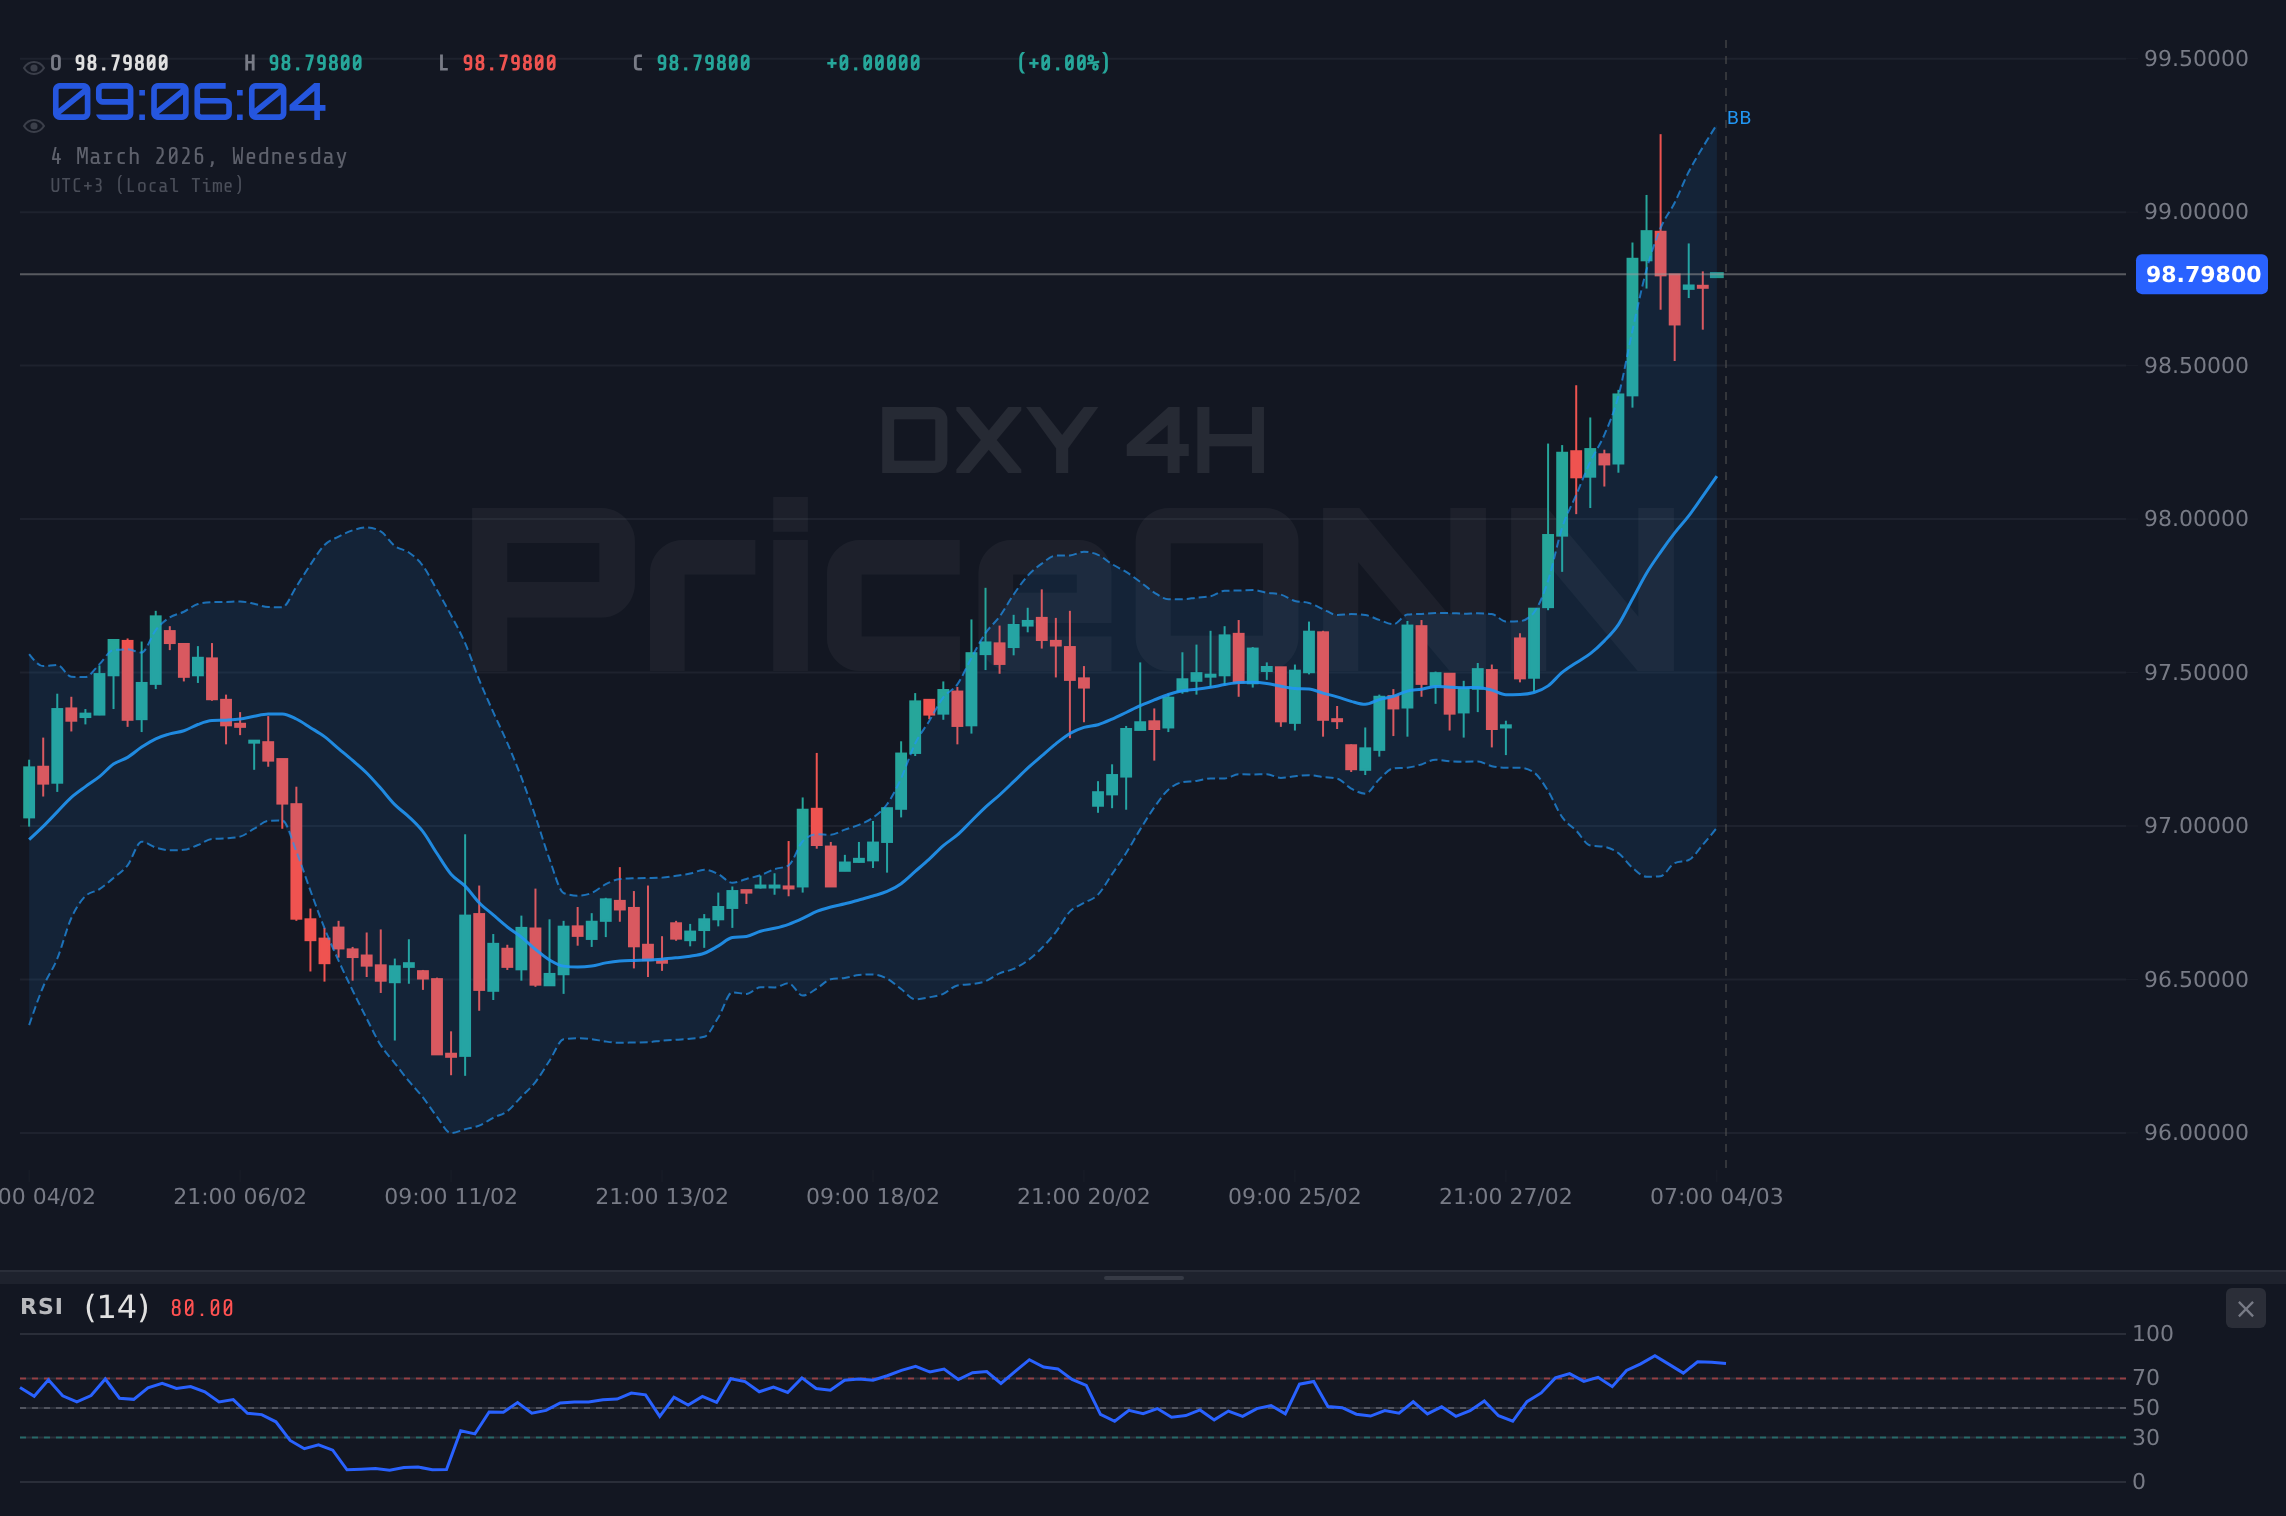
From a technical perspective, the dollar index is exhibiting a mixed picture across different timeframes. On the 1-hour chart, the trend is neutral, with the RSI at 62.69 suggesting that the dollar is neither overbought nor oversold. However, the ADX at 37.69 indicates a strong uptrend, suggesting that the dollar could potentially break higher. On the 4-hour chart, the RSI is at 71.08, entering overbought territory, which could lead to a near-term pullback. The ADX remains strong at 43.21, reinforcing the upward trend. The daily chart paints a more complex picture, with the RSI at 67.89 and the ADX at a relatively weak 19.18, indicating a lack of clear trend direction.
Key support levels to watch are 98.66 (1H), 98.69 (4H), and 98.08 (1D). A break below these levels could open the door for a deeper correction. On the upside, resistance levels are 98.81 (1H), 98.87 (4H), and 99.22 (1D). A sustained move above these levels would confirm the bullish trend and pave the way for further gains.
The EURUSD pair is facing headwinds as ECB officials emphasize the need for monetary policy flexibility due to ongoing geopolitical tensions. Rising energy prices and geopolitical tensions fuel a surge in the US dollar. The EURUSD is currently trading at 1.15904, down -0.18% on the day. Technical indicators on the 1D timeframe are bearish, with the RSI at 31.39, MACD negative, and Stochastic signaling a downtrend. Immediate support lies at 1.15714, and resistance at 1.16171.
Crude oil prices have surged following escalating tensions in the Middle East, with Brent crude hitting $84 a barrel. Geopolitical risks continue to dominate market sentiment. WTI crude oil prices jumped over 6% to above $75 a barrel amid escalating US-Iran tensions. Ecuador's oil sector is struggling with declining production and infrastructure issues. Rising crude prices due to Middle East tensions add pressure.
Given the conflicting signals, traders should exercise caution and avoid making hasty decisions. A wait-and-see approach is warranted until the economic data and geopolitical situation become clearer. It's also critical to monitor cross-market correlations. With DXY at $98.93, gold is facing pressure. Risk appetite is declining, so safe-haven demand may increase. According to Reuters, Fed officials have emphasized that inflation remains 'stubborn'.
The strength of the dollar index is closely intertwined with the monetary policy stance of the Federal Reserve. Expectations of further interest rate hikes have generally supported the dollar, while dovish signals have weighed on its value. The upcoming ADP Nonfarm Employment Change and Services PMI data will be crucial in shaping market expectations about the Fed's next move. A strong set of data could reinforce the hawkish narrative and propel the dollar higher. Conversely, a weak set of data could prompt the Fed to adopt a more cautious approach, which would likely lead to a weaker dollar.
The geopolitical landscape is adding another layer of complexity to the DXY's outlook. The ongoing tensions involving the US, Israel, and Iran have the potential to escalate further, which could trigger a flight to safety and boost demand for the dollar. However, excessive dollar strength could also hurt U.S. exports and weigh on economic growth, potentially forcing the Fed to reconsider its hawkish stance.
What does the MACD signal tell us about DXY trend analysis? The ADX at 43.21 indicates a strong uptrend on the 4H timeframe, while the MACD histogram shows positive momentum. The Stochastic indicator, with K=63.34, D=78.62, shows a potential downtrend. The dollar index is facing a complex interplay of factors, making it difficult to predict its near-term trajectory with certainty. Traders should remain vigilant and adapt their strategies as new information becomes available. Having tracked DXY through the 2024 rate cycle, I can say that this level of volatility is not uncommon, but it does require patience and discipline.
If the ADP Nonfarm Employment Change and Services PMI data come in stronger than expected, DXY could break above the 99.22 resistance level, targeting 99.81 and potentially 100.37. This scenario has a 60% probability.
If the data disappoints or geopolitical tensions ease, DXY could fall below the 98.66 support level, targeting 98.08 and potentially 97.52. This scenario has a 40% probability.
Frequently Asked Questions: DXY Analysis
Is DXY a good buy right now?
DXY is currently trading at $98.93, facing resistance at 98.81. A break above this level, combined with strong economic data, could make it a good buy. However, caution is warranted due to geopolitical risks.
What is the DXY price forecast for this week?
The DXY price forecast for this week depends on the upcoming economic data and geopolitical developments. A bullish scenario could see DXY reaching 99.22, while a bearish scenario could lead to a decline to 98.08.
What are the key support and resistance levels for DXY?
Key support levels for DXY are 98.66, 98.69, and 98.08. Key resistance levels are 98.81, 98.87, and 99.22. Traders should watch these levels closely for potential breakout or breakdown opportunities.
Why is DXY moving today?
DXY is moving today due to a combination of factors, including mixed economic data, geopolitical tensions, and shifting central bank expectations. The upcoming U.S. ADP Nonfarm Employment Change and Services PMI data will be crucial.
Key Levels
Support Levels
Resistance Levels
Technical Outlook Summary
| Indicator | Value | Signal |
|---|---|---|
| RSI (14) | 62.69 | Neutral |
| MACD Histogram | Negative | Bullish |
| Stochastic | 63.61/32.22 | Bullish |
| ADX | 37.69 | Strong Uptrend |
| Bollinger | Upper Band | Watch |
Track markets in real-time
AI-powered analysis, technical indicators and real-time price data.
Join Our Telegram Channel
Breaking market news, AI analysis and trading signals instantly.
Join Channel