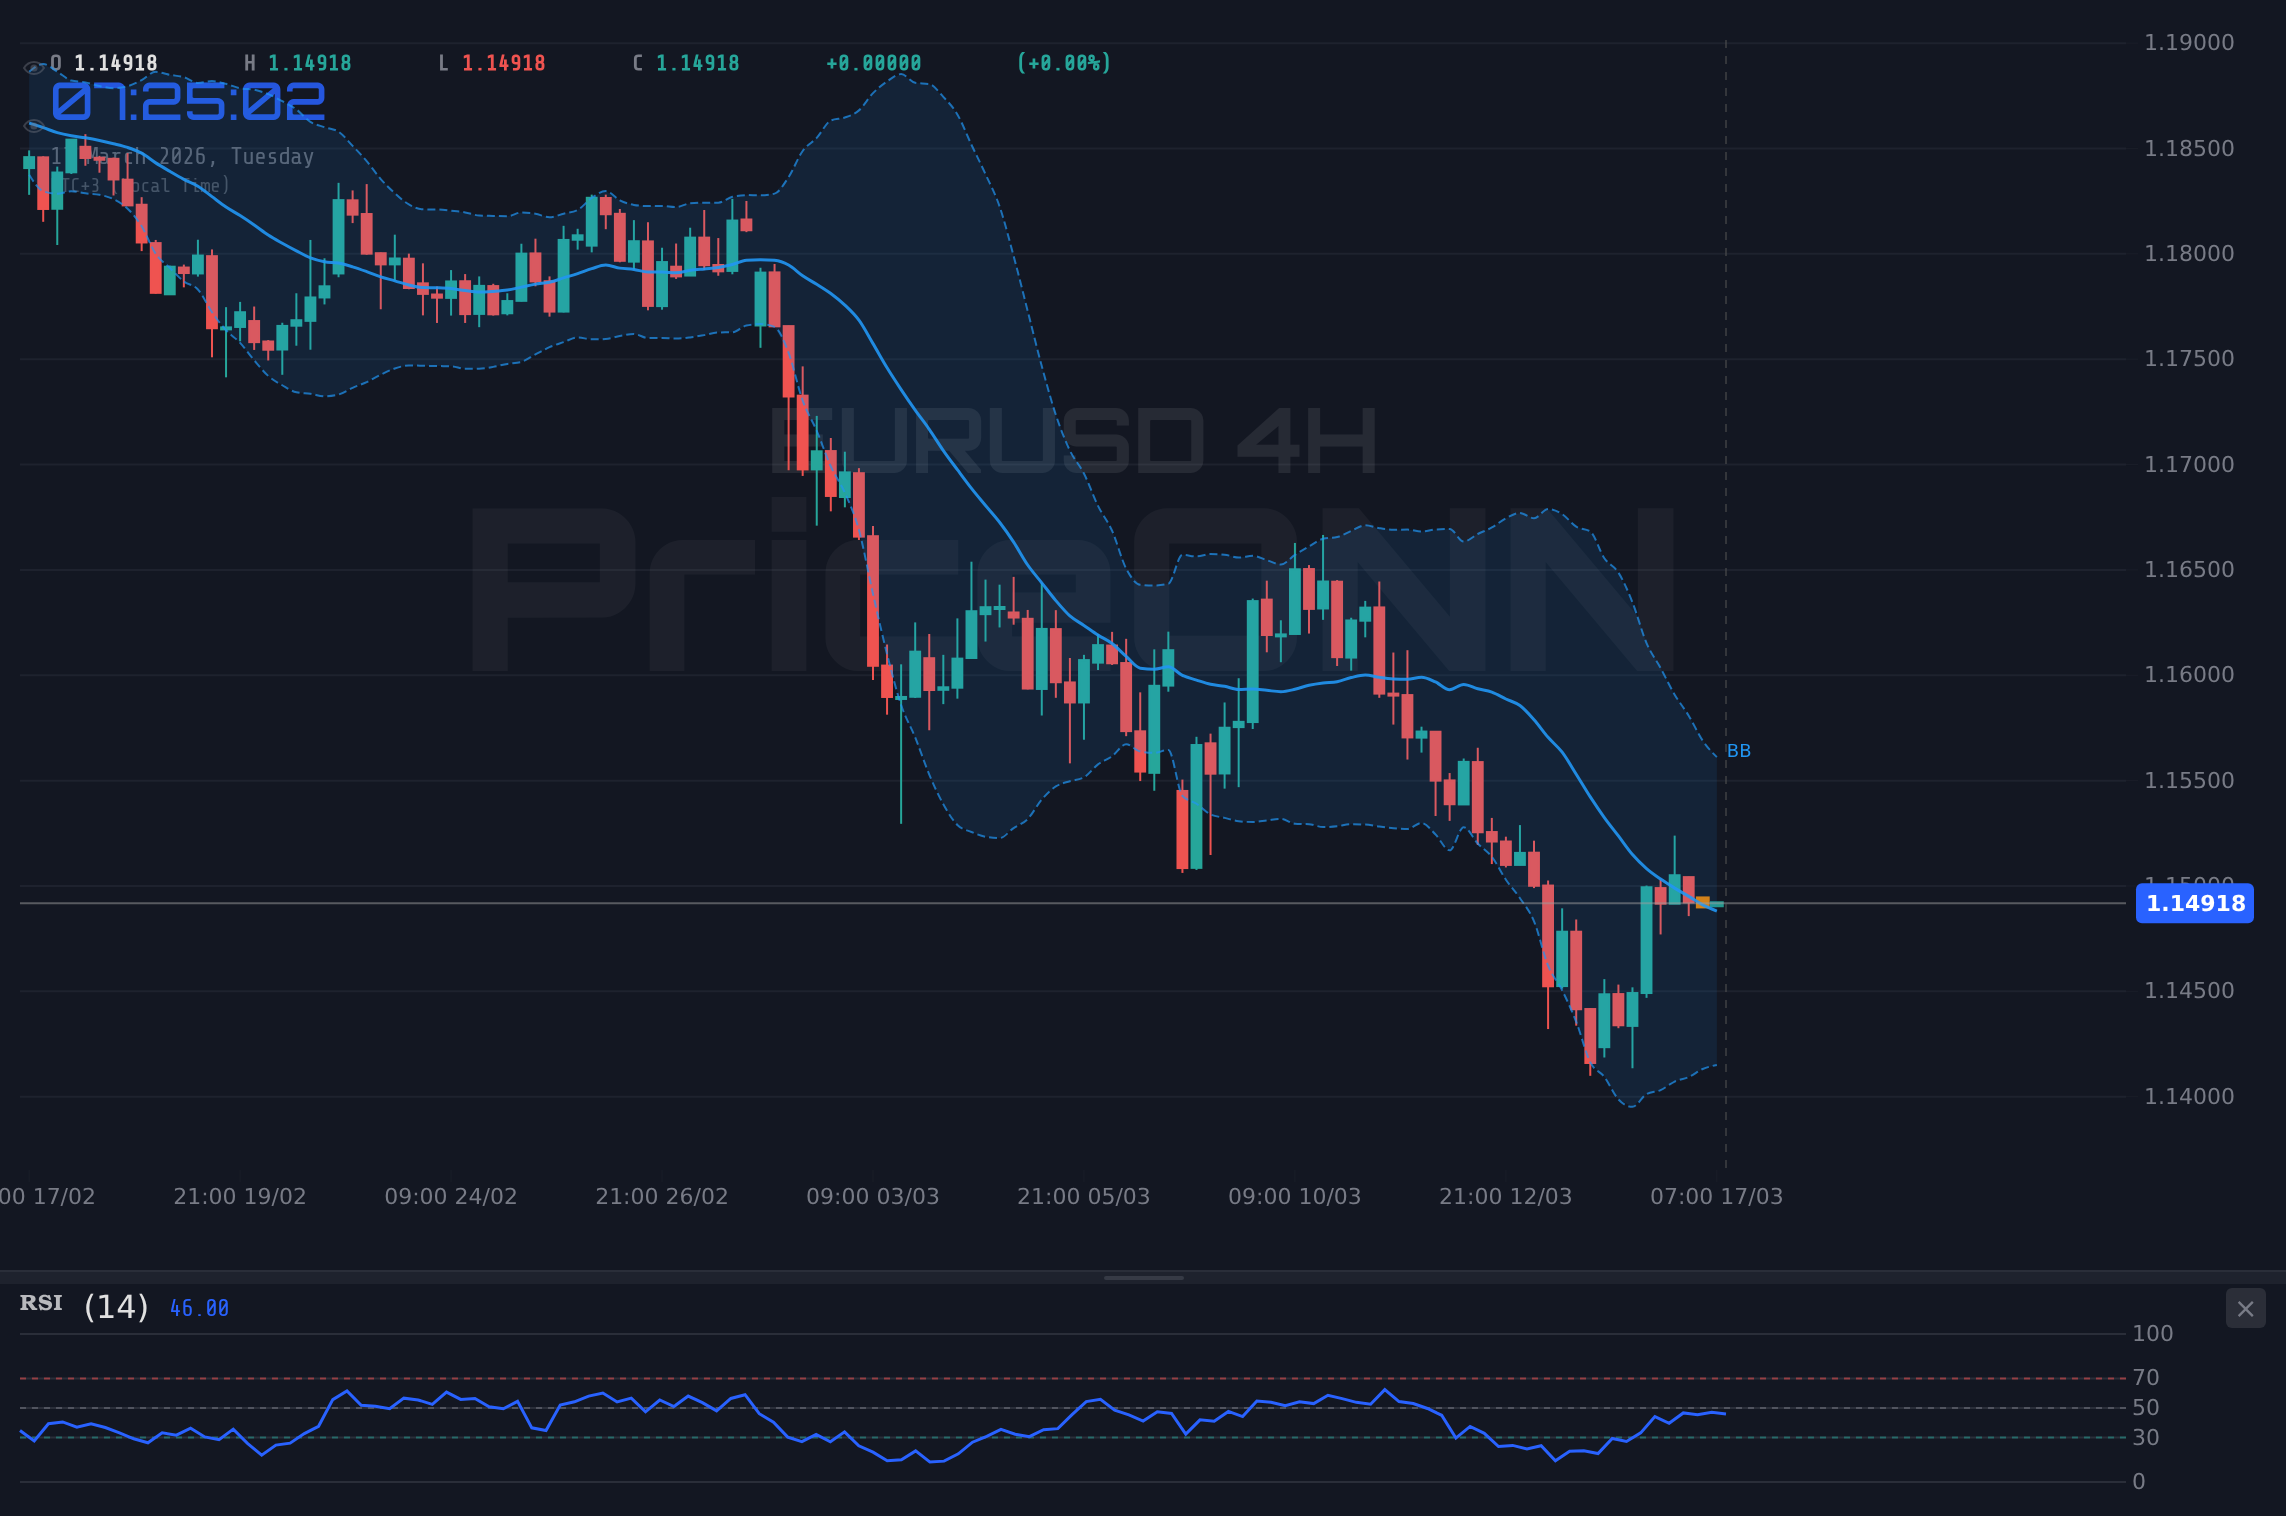
The EURUSD pair is currently navigating a crucial juncture, hovering around the $1.1491 mark, with its immediate sights set on the $1.14378 support level. This price action unfolds against a backdrop of a strengthening US Dollar Index (DXY), which has climbed to 99.68, and a broadly risk-averse sentiment gripping global markets. Equities, as indicated by the S&P 500 trading at 6682.05 and the Nasdaq at 24580.25, are showing a bearish bias, suggesting that investors are favouring safe-haven assets. This dynamic creates a complex environment for the Euro, which is finding itself under pressure from multiple fronts. The interplay between the DXY's ascent and the prevailing risk sentiment will be paramount in determining whether EURUSD can hold its ground or succumbs to further downside. Understanding these cross-market correlations is key to deciphering the near-term trajectory for the pair.
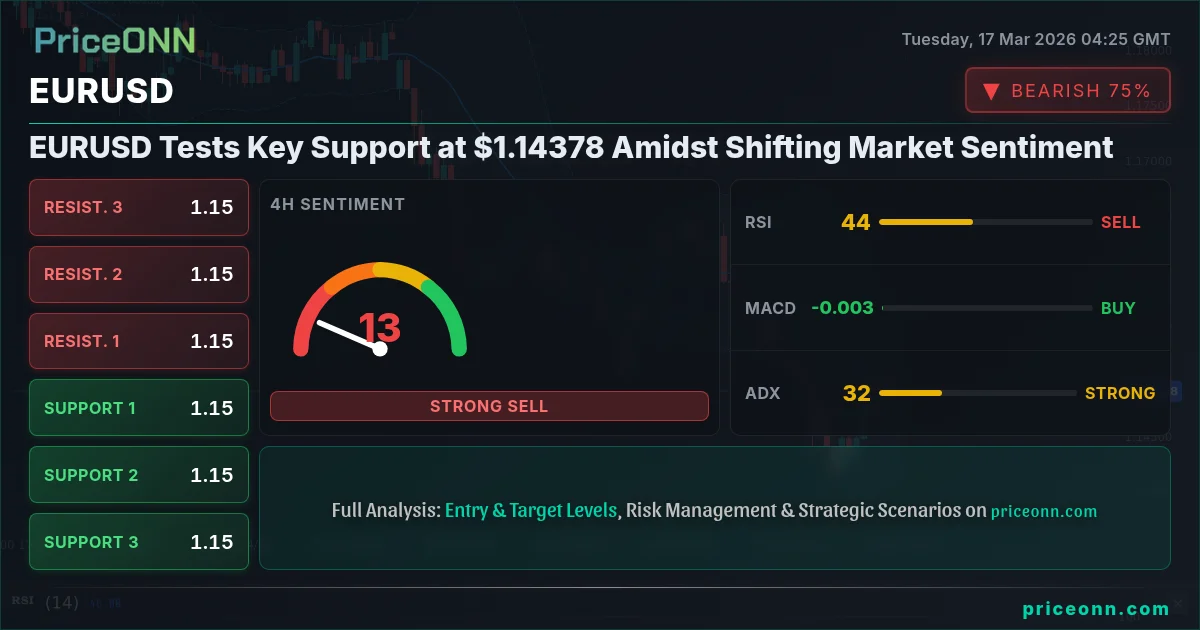
- EURUSD is testing critical support at $1.14378, with the current price at $1.1491.
- The US Dollar Index (DXY) shows strength, currently at 99.68, pressuring major currency pairs.
- Risk appetite is waning, with S&P 500 at 6682.05 and Nasdaq at 24580.25 indicating a bearish bias.
- Technical indicators on the 1H chart present a neutral signal (Al: 4, Sat: 4), reflecting indecision, while the 4H and 1D charts lean towards a 'SELL' signal.
- Geopolitical tensions in the Middle East are driving oil prices higher, with Brent crude at $103.29 and WTI at $95.98, potentially influencing inflation expectations and central bank policy.
Navigating the Cross-Market Currents: DXY and Risk Sentiment
The US Dollar Index (DXY) is currently exhibiting strength, trading at 99.68 and showing a clear upward trajectory on the 1-hour chart, supported by a robust daily trend. This strength in the dollar inherently puts pressure on other major currency pairs, including EURUSD. Historically, a rising DXY often correlates with a weakening EURUSD, as the dollar gains appeal as a safe-haven asset or due to interest rate differentials. The DXY's current upward momentum, with its 1-hour chart showing a general 'BUY' signal (8-0-0), suggests that dollar bulls are in control in the short term. This is further reinforced by the daily trend being classified as 'Uplift' with 97% strength.
Simultaneously, the broader market sentiment is leaning towards risk aversion. The S&P 500 index is trading at 6682.05, down 0.19% for the day, and the Nasdaq Composite is at 24580.25, down 0.26%. Both indices exhibit a bearish bias on the 1-hour and 4-hour timeframes, with the 1D charts showing strong downtrends (ADX at 40.73 for S&P 500). This decline in risk appetite typically drives capital towards perceived safe-haven assets. While the dollar is benefiting, other traditional safe havens like gold (XAUUSD at 5029.02) are also showing resilience and upward movement, indicating a complex risk environment where both the dollar and gold are sought after, albeit for potentially different reasons – the dollar for its reserve status and yield potential, and gold for its inflation hedging and geopolitical hedge properties.
The conflicting signals within the technical indicators for EURUSD itself warrant a closer look. On the 1-hour timeframe, the pair presents a neutral stance with an equal number of 'BUY' and 'SELL' signals (4 each), suggesting a period of consolidation or indecision. However, the 4-hour and daily charts are leaning more towards a 'SELL' signal, with 5 'SELL' and 3 'BUY' signals on the 4-hour, and a dominant 'SELL' on the daily (1 'BUY', 7 'SELL'). This divergence between short-term neutrality and longer-term bearish signals adds to the caution required when assessing the pair's immediate future. The RSI(14) on the 1-hour chart is at 54.05, indicating a neutral zone but with an upward eğilim, while on the daily, it sits at 34.03, firmly in the lower neutral zone and showing a downward eğilim. This contrast highlights the choppy, uncertain conditions traders are currently facing.
The Euro's Technical Picture: A Tale of Divergent Timeframes
Examining the EURUSD pair's technical indicators across different timeframes reveals a fragmented picture, demanding a nuanced interpretation. On the hourly chart, the RSI(14) at 54.05 suggests a slight bullish lean within the neutral territory, yet this is contradicted by the MACD, which displays negative momentum with its signal line below the MACD line. Furthermore, the Stochastic Oscillator (K=18.15, D=36.65) is firmly in oversold territory and flashing a 'SELL' signal, indicating potential downward pressure. The Bollinger Bands are positioned below the lower band, hinting at oversold conditions or a potential breakdown, though the ADX at 24.78 suggests a moderate trend strength that is neither overwhelmingly bullish nor bearish.
Moving to the 4-hour timeframe, the narrative shifts. Here, the RSI(14) drops to 46.03, indicating a more bearish sentiment within the neutral zone and showing a downward eğilim. The MACD flips to positive momentum, but crucially, it remains below its signal line, suggesting that the upward momentum might be short-lived or corrective. The Stochastic Oscillator, however, shows a contrasting bullish signal with K=81.12 and D=53.86, indicating a potential upward move and crossing above its signal line. The Bollinger Bands remain below the middle band, reinforcing the bearish outlook. The ADX here strengthens to 33.44, signalling a strong downtrend. This divergence between the RSI and Stochastic on the 4-hour chart presents a classic case of conflicting signals, where traders must weigh the prevailing trend strength indicated by the ADX against the oscillator readings.
The daily chart paints the most bearish picture for EURUSD. The RSI(14) at 34.03 is deep in the lower neutral zone, clearly indicating a downward eğilim and suggesting further downside potential. The MACD continues to show negative momentum, with the histogram below the zero line and the MACD line below the signal line. The Stochastic Oscillator (K=23.4, D=21.19) aligns with the bearish outlook, showing a 'SELL' signal as %K is below %D, though it is approaching oversold territory. Crucially, the ADX on the daily timeframe stands at 36.7, confirming a strong downtrend. The Bollinger Bands are also below the middle band, consistent with the prevailing bearish momentum. This confluence of bearish signals on the daily timeframe provides a significant headwind for any potential recovery in EURUSD, suggesting that the medium-term outlook remains challenging.
The price action itself provides critical levels to watch. The current price is $1.1491. The immediate support identified on the 1-hour chart is $1.14904, followed by $1.14864 and $1.14827. A break below these levels could accelerate selling pressure. On the resistance side, the 1-hour chart shows resistance at $1.14981, $1.15018, and $1.15058. These are the levels bulls need to reclaim to negate the immediate bearish tone. On the 4-hour chart, the key support levels are $1.14898, $1.14746, and $1.14575. The daily chart indicates more significant support at $1.14378, $1.13704, and $1.13274. These lower levels are critical psychological and technical barriers that, if breached, could signal a much deeper correction.
The Influence of Geopolitics and Commodities on the Forex Landscape
The global economic landscape is currently being significantly shaped by geopolitical tensions, particularly in the Middle East. Recent news indicates escalating conflicts and disruptions in key shipping lanes, which has predictably sent crude oil prices soaring. Brent crude is trading at $103.29, and WTI is at $95.98, both showing strong upward momentum on their respective charts. The 1-day chart for Brent crude shows a very strong uptrend (ADX 59.72) with RSI at 81.46, clearly in overbought territory, suggesting potential for a pullback but also highlighting the market's sensitivity to supply disruption fears. WTI crude also shows a very strong uptrend (ADX 53.97) with RSI at 73.97, also nearing overbought conditions.
This surge in oil prices has direct implications for inflation expectations worldwide. Higher energy costs typically translate into broader inflationary pressures, which central banks, including the Federal Reserve and the European Central Bank, are keenly monitoring. If inflation remains stubbornly high, it could compel central banks to maintain tighter monetary policies or delay anticipated interest rate cuts. This, in turn, would support currencies like the US Dollar, which benefits from higher yields, and potentially weigh on currencies like the Euro, especially if the ECB is perceived to be behind the curve or if Europe's economy is more vulnerable to energy price shocks. The recent news about oil prices plunging after reaching highs, then spiking again due to geopolitical escalations, illustrates the volatility and uncertainty that commodity markets are currently experiencing, adding another layer of complexity for currency traders.
The recent breaking news highlights this volatility. One report indicates oil prices tumbling as tensions ease, while another points to a spike as tensions escalate. This rapid shift underscores the delicate balance of geopolitical risk premiums in the oil market. For EURUSD, this translates into uncertainty regarding future monetary policy paths. If sustained high oil prices lead to persistent inflation, the Fed might be forced to hold rates higher for longer, supporting the dollar. Conversely, if global growth falters significantly due to energy costs or geopolitical instability, central banks might pivot towards easing, which could weaken the dollar. The euro's fate is also tied to European energy security and the ECB's response to inflation versus growth concerns. The current data shows EURUSD is under pressure, with the daily trend being strongly downwards (98% strength), and the RSI at 34.03 indicates room for further decline.
The strength of the Canadian Dollar (CAD) also offers a comparative perspective. News suggests that softer-than-expected Canadian inflation data (1.8% YoY) might lead the Bank of Canada to hold rates steady, potentially impacting USD/CAD. While this is a separate currency pair, it illustrates how domestic economic data, when deviating from expectations, can influence a currency's trajectory and its correlation with the US dollar. The fact that Canadian inflation is cooling could offer some breathing room for the Bank of Canada, but the overarching theme of inflation influenced by global energy prices remains a key factor. This dynamic highlights the interconnectedness of global economies and the challenge of isolating the drivers for any single currency pair.
Trade Plan: Navigating the EURUSD Uncertainty
Given the confluence of bearish technical signals on the daily timeframe, the strengthening DXY, and the prevailing risk-off sentiment, the primary trade bias for EURUSD leans bearish. However, the neutral signals on the 1-hour chart and the conflicting indicators across timeframes suggest that the market is in a state of flux, making precise entry timing critical. The ADX values provide crucial context: the 1-hour ADX at 24.78 indicates moderate trend strength, while the 4-hour ADX at 33.44 and the daily ADX at 36.7 both signal strong downtrends. This suggests that once a clear direction is established, the move could be significant.
Trade Plan: Bearish Bias
The probability for this bearish scenario is estimated at 65%, based on the strong daily downtrend, the bullish DXY, and risk-off market conditions. However, the conflicting signals on the shorter timeframes necessitate careful risk management. A close above $1.15058 would invalidate this bearish thesis and could signal a short-term correction or a reversal, potentially targeting the $1.15482 resistance level on the daily chart.
Alternative Scenario: Short-Term Bounce from Support
This bullish scenario has a lower probability (35%) given the prevailing bearish technicals and macro conditions. It would likely require a significant shift in market sentiment, perhaps a surprisingly dovish tone from the Fed or a de-escalation of geopolitical tensions, to gain traction. The Stochastic Oscillator on the 1-hour chart, currently at 18.15, does offer some potential for a short-term bounce if it turns upwards and crosses its signal line, but this would need to be confirmed by other indicators and price action.
The immediate focus remains on the $1.14378 support level. A break below this could trigger further downside, potentially targeting the $1.13704 level. Conversely, a sustained hold above this level, coupled with a break of immediate resistance around $1.15058, could signal a temporary reprieve for the Euro. The upcoming economic data releases and any further developments in geopolitical hotspots will be crucial in shaping the narrative for EURUSD in the coming days.
Traders should exercise extreme caution. The combination of strong DXY, risk-off sentiment, and conflicting technical signals creates a volatile environment. Always employ strict risk management, use stop-losses, and consider position sizing carefully. Upcoming economic events, such as the Fed decision mentioned in market chatter, could trigger sharp price movements.
Economic Calendar and Macroeconomic Undercurrents
While the provided data does not include a specific economic calendar for the coming week, market participants are keenly awaiting key economic releases that will undoubtedly influence EURUSD. The general consensus points towards a cautious stance from central banks, particularly the Federal Reserve, as they navigate inflation and growth concerns. The recent news regarding the US Dollar softening ahead of a crucial Federal Reserve decision suggests that market participants are positioning for potential policy shifts or at least seeking clarity on the central bank's forward guidance. If the Fed adopts a more dovish tone than anticipated, it could weaken the dollar and provide a reprieve for EURUSD, potentially allowing it to test higher resistance levels.
Conversely, any indication that the Fed remains committed to a tighter monetary policy or is concerned about persistent inflation could further bolster the dollar and weigh on the Euro. The European Central Bank (ECB) faces a similar dilemma, albeit with different economic conditions. News highlighted that ECB policy expectations are strengthening, implying a potential divergence in monetary policy paths between the US and Europe. If the ECB signals a more hawkish stance relative to the Fed, it could offer some support to the Euro. However, the persistent strength of the dollar and the current bearish technical outlook for EURUSD suggest that any upward movement might be met with selling pressure.
The influence of oil prices, as discussed earlier, cannot be understated. Persistent high energy costs could fuel inflation concerns globally, complicating the policy decisions for both the Fed and the ECB. The market is sensitive to any data that might indicate a shift in inflation trends. For instance, the Canadian inflation data coming in softer than expected serves as a reminder that inflation dynamics can vary significantly across economies, but the global nature of energy prices means that developments in one region often have ripple effects elsewhere. This makes it crucial for EURUSD traders to monitor not only US and Eurozone specific data but also broader commodity price movements and geopolitical events.
The correlation between EURUSD and the DXY is a critical factor to monitor. With the DXY currently at 99.68 and showing a strong upward trend, it presents a significant headwind for EURUSD. The 1-hour chart shows the DXY in a strong 'BUY' position, while EURUSD's 1-hour chart is neutral and its longer-term charts are bearish. This divergence suggests that the dollar's strength is a primary driver currently, and any weakening in the DXY would be a prerequisite for a sustained recovery in EURUSD. The S&P 500 and Nasdaq's bearish performance also reinforces the risk-off environment, which typically favours the dollar over riskier assets or currencies.
Frequently Asked Questions: EURUSD Analysis
What happens if EURUSD breaks below the $1.14378 support level?
A break below $1.14378 would confirm the bearish sentiment indicated by the daily technicals. This could trigger further selling, with the next significant support level being $1.13704. The DXY's strength and risk-off sentiment would likely accelerate this move.
Should I consider buying EURUSD at current levels around $1.1491 given the mixed signals?
Caution is advised. While the 1-hour chart shows neutral signals, the longer-term charts lean bearish. A potential short-term bounce from $1.14378 is possible (35% probability), but a confirmed break below this level increases the probability of a sustained downtrend targeting $1.14575 and below.
Is the RSI at 34.03 on the daily chart a strong sell signal for EURUSD?
An RSI of 34.03 indicates a strong downward eğilim and suggests room for further declines before becoming oversold. While not an immediate sell trigger on its own, it aligns with the overall bearish technical picture and the strong downtrend confirmed by the ADX at 36.7.
How might upcoming Fed decisions affect EURUSD if oil prices remain elevated?
Elevated oil prices could sustain inflationary pressures, potentially leading the Fed to maintain a hawkish stance or delay rate cuts. This would likely support the US Dollar, further pressuring EURUSD downwards, especially if the ECB adopts a less hawkish approach.
Navigating these complex market dynamics requires patience and discipline. While the immediate outlook for EURUSD appears challenging, opportunities arise from volatility. Staying informed, managing risk, and waiting for clear setups are the cornerstones of successful trading.
The market always presents second chances; focus on executing your plan when the probabilities align in your favour.
📊 Indicator Dashboard
| Indicator | Value | Signal | Interpretation |
|---|---|---|---|
| RSI (14) | 54.05 (1H) / 34.03 (1D) | Neutral (1H) / Bearish (1D) | Neutral momentum on hourly, bearish on daily. |
| MACD | Negative (1H) / Negative (1D) | Bearish | Momentum is favouring sellers on shorter and longer timeframes. |
| Stochastic | K=18.15, D=36.65 (1H) / K=23.4, D=21.19 (1D) | Bearish (1H) / Bearish (1D) | Both timeframes suggest downward pressure, nearing oversold on hourly. |
| ADX | 24.78 (1H) / 36.7 (1D) | Moderate Trend (1H) / Strong Trend (1D) | Trend strength is increasing on longer timeframes. |
| Bollinger Bands | Lower Band Break (1H) / Below Middle Band (1D) | Bearish Pressure | Price action indicates selling pressure across timeframes. |
Track markets in real-time
AI-powered analysis, technical indicators and real-time price data.
Join Our Telegram Channel
Breaking market news, AI analysis and trading signals instantly.
Join Channel