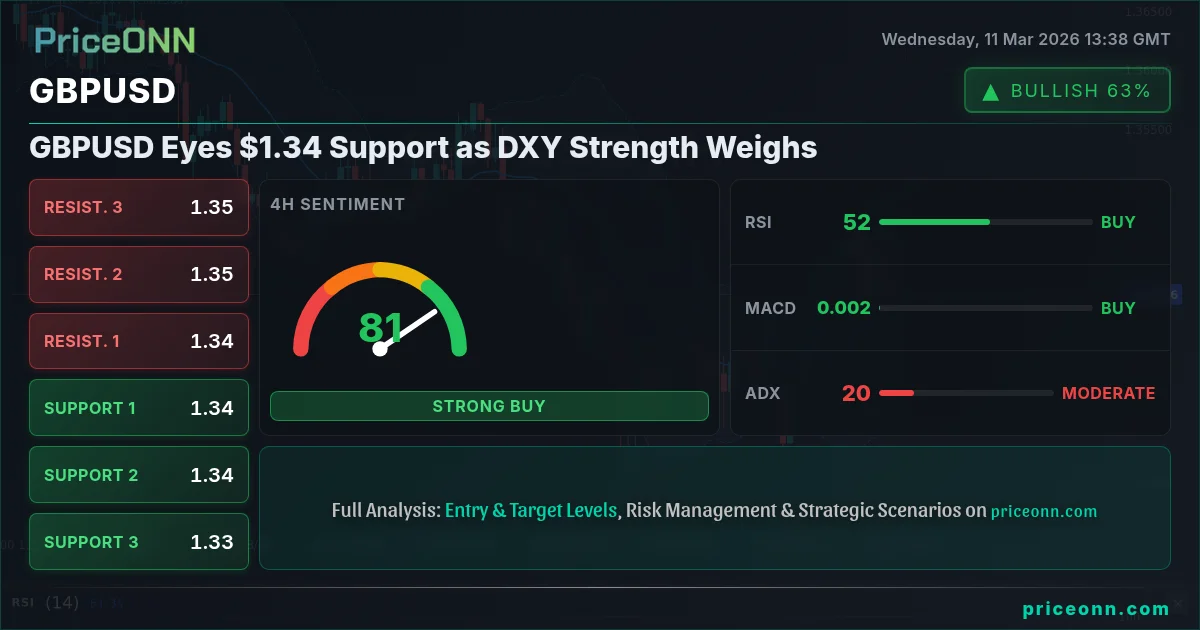
GBPUSD is currently trading around $1.34, a level that's proving to be a battleground between bulls and bears. The pair is facing downward pressure as the Dollar Index (DXY) strengthens to 98.89, while economic data from both the UK and the US add further complexity to the outlook.
The Bullish Case for GBPUSD
Despite the current downward pressure, there are arguments to be made for a potential bullish reversal. One key factor is the oversold conditions on some of the shorter-term timeframes. While the 1-hour RSI sits at 39.56, indicating further room for decline, a potential bounce could occur if the pair finds support at the 1.33861 level. Furthermore, the Stochastic oscillator on the 1-day chart presents a potentially bullish signal with K=56.4 and D=42.5. This setup suggests that while the overall trend is bearish, a short-term pullback could be in the cards. From a longer-term perspective, patient investors may see current levels as an opportunity to accumulate GBPUSD at a discount, anticipating a future recovery in the UK economy. The recent dip in oil prices, as reported by multiple news outlets, could also provide some relief to the UK economy by easing inflation concerns, indirectly benefiting the Sterling.
Historically, GBPUSD has shown resilience during periods of economic uncertainty. For example, during the Brexit negotiations, the pair experienced significant volatility but ultimately found support at key levels. Scalpers may look to capitalize on short-term bounces, while swing traders might wait for a clearer signal before entering long positions. The key is to manage risk and wait for confirmation before committing to a bullish outlook. The current levels could also be attractive for long-term investors who believe in the long-term strength of the British economy.

The Bearish Case for GBPUSD
On the flip side, the bearish case for GBPUSD is currently supported by several factors. The strengthening DXY, currently at 98.89, is putting significant pressure on the pair. The daily chart shows a strong downward trend (94% strength), with the MACD histogram further reinforcing this bearish momentum. Furthermore, the overall signal on the 1-hour timeframe is a strong sell, with 7 indicators pointing towards further downside. A key level to watch is the 1.33861 support, a break below which could open the door for a test of 1.33617. Moreover, analysts are concerned about the upcoming GDP data set to be released Friday. The forecasted reading of 0.1 is hardly encouraging and below this could trigger a further sell-off.
The bearish sentiment is further fueled by geopolitical fears. Any escalation in the Middle East could drive investors towards safe-haven assets, further strengthening the dollar and weighing on GBPUSD. From a trading perspective, scalpers may look to profit from short-term declines, while swing traders might target the 1.33617 level as a potential take-profit zone. The strong downward trend suggests that patience may be rewarded for those looking to short the pair. The current market setup is ideal for those that believe the UK economy is set for a downturn.
Technicals as a Tiebreaker: Analyzing Key Indicators
To gain further insights into the GBPUSD outlook, it's crucial to analyze key technical indicators across multiple timeframes. On the 1-hour chart, the RSI is at 39.56, suggesting further downside potential before reaching oversold conditions. The MACD histogram is also negative, further confirming the bearish momentum. However, the ADX at 19.76 indicates a weak trend, suggesting that the current downward momentum may not be sustainable in the long term. This reading means the breakout hasn't committed yet- it could go either way.
Moving to the 4-hour chart, the RSI is at 51.93, suggesting a neutral stance. However, the Stochastic oscillator shows a bearish signal with K=51.48 and D=72.62, indicating potential for a pullback. The ADX at 21.12 suggests a moderate downward trend, reinforcing the bearish bias. On the daily chart, the RSI is at 43.58, also suggesting a neutral stance, while the Stochastic oscillator presents a bullish signal with K=56.4 and D=42.5. This is an example of an indicator conflict and would suggest that caution is warranted at this time.
Overall, the technical indicators present a mixed picture. The shorter-term timeframes suggest further downside potential, while the longer-term charts indicate potential for a bullish reversal. This conflicting signal reinforces the need for patience and confirmation before making any trading decisions.
Correlation Analysis: DXY, Equities, and Oil
Understanding the correlations between GBPUSD and other asset classes can provide valuable insights into the pair's potential future movements. As previously mentioned, the DXY (Dollar Index) has a strong inverse correlation with GBPUSD. With DXY at 98.89, the continued strength of the dollar is putting downward pressure on GBPUSD. Traders should monitor the DXY closely for any signs of weakness, which could signal a potential reversal for GBPUSD. When DXY is rising, GBPUSD is typically under pressure.
Equities, particularly the S&P 500, can also provide clues about GBPUSD's direction. Generally, a risk-off environment (falling S&P 500) tends to support the dollar and weigh on GBPUSD. The S&P 500 is currently trading at 6789.05 and showing a downward trend, which could further reinforce the bearish bias for GBPUSD. A falling SP500 signals that risk appetite is declining and therefore safe-haven demand may increase.
Oil prices can also have an indirect impact on GBPUSD. Lower oil prices can ease inflation concerns in the UK, potentially benefiting the Sterling. However, the current situation is complex, as the news about the Strait of Hormuz faces mining threat can lead to higher oil prices and potentially weigh on GBPUSD due to inflationary pressure. The current situation highlights the complexities of the current market and why a cautious approach is warranted.
Fundamental Drivers: Economic Data and Central Bank Policies
The fundamental drivers of GBPUSD are primarily centered around economic data releases and central bank policies. Upcoming UK GDP data on Friday will be a critical catalyst for the pair. A strong reading could provide some support for the Sterling, while a weak number could trigger a further sell-off. The Bank of England's (BoE) monetary policy decisions will also play a crucial role. Any hints of a dovish stance could weigh on GBPUSD, while a hawkish outlook could provide support. The recent news that the Dollar Under Pressure as Aussie Hits Multi-Year High; CPI Data Looms, should also be considered.
The US Federal Reserve's (Fed) policies will also have a significant impact. Any hawkish signals from the Fed could further strengthen the dollar and weigh on GBPUSD. Traders should closely monitor economic data releases from both the UK and the US, as well as statements from central bank officials, to gauge the potential future direction of the pair. The upcoming US CPI data could box in the incoming Fed chair. February's CPI data is expected to hold steady at 2.4%, but persistent inflation above the Fed's 2% target, combined with the ongoing conflict may make it hard to ease any potential monetary policy. Macroeconomic factors in March 2026 continue to support a bearish outlook for GBPUSD.
Upcoming Events to Watch
Several key economic events are on the horizon that could significantly impact GBPUSD. On Friday, the UK GDP data will be released, providing insights into the health of the UK economy. Also, on Friday are the release of US employment figures. Traders should closely monitor these events and adjust their positions accordingly. Any surprises in the data could trigger significant volatility in GBPUSD. The 1-hour ADX sitting at 19.76 means traders should be wary of a potential breakout. It could go either way!
Frequently Asked Questions: GBPUSD Analysis
What happens if GBPUSD breaks below the $1.33861 support level?
If GBPUSD breaks below the $1.33861 support level, it could trigger a significant sell-off towards the next support at $1.33617. This move would confirm the bearish sentiment and potentially open the door for further downside towards lower levels.
Should I sell GBPUSD at current levels of $1.34 given the strong DXY?
While the strong DXY at 98.89 is putting downward pressure on GBPUSD, it's important to consider other factors before selling. The mixed technical signals and upcoming economic data releases suggest that caution is warranted. It may be prudent to wait for a clearer confirmation of the bearish trend before entering a short position. The 1-hour RSI sits at 39.56, indicating the potential for the asset to be oversold.
Is the Stochastic oscillator's bullish signal on the daily chart a reliable indicator for GBPUSD?
While the Stochastic oscillator on the daily chart presents a bullish signal (K=56.4 and D=42.5), it's important to consider this in the context of the overall bearish trend. The indicator signals should be viewed as a potential for a short-term pullback rather than a complete trend reversal. For a stronger signal, traders should consider the ADX- currently at 19.76.
How will the upcoming UK GDP data affect GBPUSD this week?
The upcoming UK GDP data will be a critical catalyst for GBPUSD. A strong reading could provide some support for the Sterling, while a weak number could trigger a further sell-off. Traders should closely monitor this event and adjust their positions accordingly. The latest data set to be released on Friday is set to be 0.1.
Technical Outlook Summary
| Indicator | Value | Signal |
|---|---|---|
| RSI (14) | 39.56 | Bearish |
| MACD Histogram | Negative | Bearish |
| Stochastic | 43.90 | Bearish |
| ADX | 19.76 | Weak Trend |
| Bollinger | Middle Band | Neutral |
Key Levels
Support Levels
Resistance Levels
Track markets in real-time
AI-powered analysis, technical indicators and real-time price data.
Join Our Telegram Channel
Breaking market news, AI analysis and trading signals instantly.
Join Channel