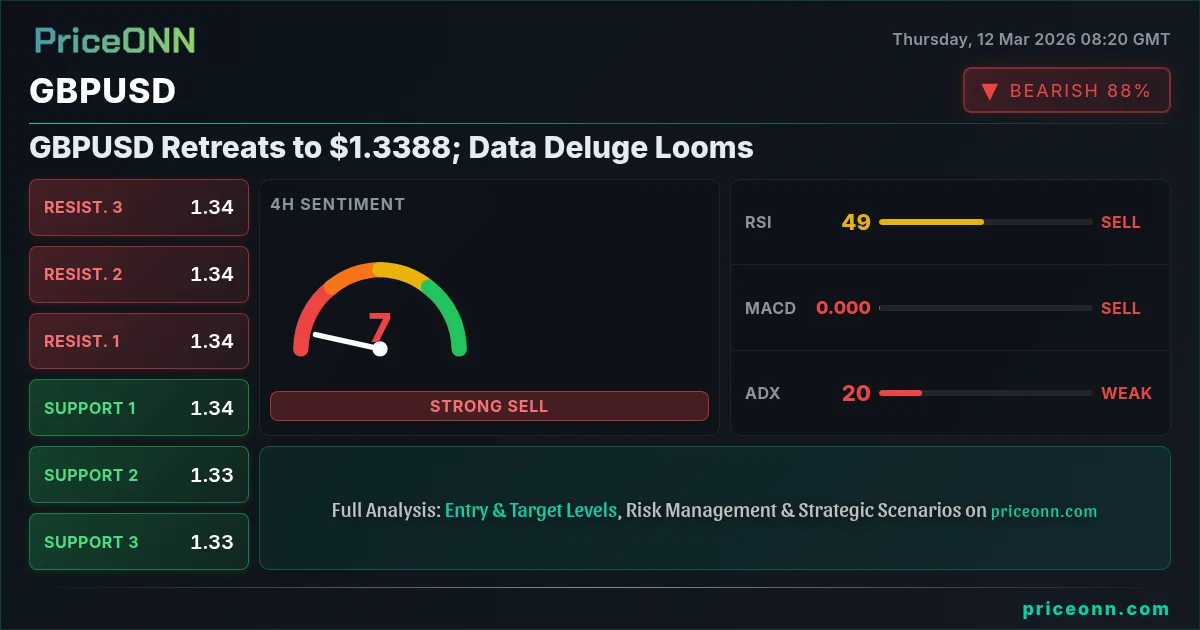
GBPUSD is trading under pressure, currently around $1.3388, as a combination of factors weigh on the pair. The dollar's strength, fueled by persistent inflation concerns and geopolitical uncertainties, is capping any potential upside for the pound. All eyes are now on upcoming data releases that could provide further clues about the future path of monetary policy.
- GBPUSD is testing support at 1.33799, the first line of defense against further declines.
- The daily RSI at 41.32 indicates bearish momentum, but is not yet in oversold territory.
- A daily close below 1.33799 could open the door for a test of the 1.3354 level.
- Dollar strength, driven by DXY at 99.1, is a major headwind for GBPUSD's recovery.
The pair's direction is heavily influenced by the broader market context. With the DXY (Dollar Index) currently at 99.1 and showing a 0.22% increase, the dollar's strength puts downward pressure on GBPUSD. Risk appetite is also declining, as indicated by the SP500's 0.29% drop, which could further bolster safe-haven demand for the dollar. Amidst this environment, GBPUSD faces significant headwinds.
From a technical perspective, the daily chart reveals a clear bearish trend. The ADX, measuring trend strength, stands at 27.63, reinforcing the downward momentum. The RSI(14) is at 41.32, suggesting further downside potential before reaching oversold conditions. The MACD histogram also displays negative momentum, further solidifying the bearish outlook. This suggests that sellers remain firmly in control for now.

Looking at the hourly timeframe, the picture is slightly more nuanced. While the trend is still neutral, with the ADX at 24.63, the RSI(14) stands at 47.13, indicating that the pair is not yet oversold on the shorter-term. The Stochastic K is at 47.34, above Stochastic D which is at 21.14, suggesting a potential for a minor short-term bounce. However, with resistance at 1.33862, any upside is likely to be limited.
Key support levels to watch include 1.33799, followed by 1.3354 and 1.33159. A break below 1.33799 would likely accelerate the decline towards the next support level. On the upside, immediate resistance lies at 1.34439, which aligns with the daily moving average. A sustained break above this level would be needed to negate the bearish outlook. The overall signal from the 1D timeframe is SELL indicating that the pair is more likely to move downwards.
The 4H timeframe, showing a strong bearish trend strength of 94%, further reinforces the overall bearish view. The RSI(14) at 43.87, while not yet oversold, is trending downwards. The Stochastic K, at 13.24 is below Stochastic D at 26.46, signalling a potential continuation of the downward trend. Immediate resistance lies at 1.34076, and a break above this level is unlikely in the current market conditions.
The recent news of oil prices soaring due to Middle East conflict disruptions adds another layer of complexity. As energy prices rise, inflation fears intensify, which could further strengthen the dollar as investors seek safe-haven assets. This could exacerbate the downward pressure on GBPUSD.
According to the economic calendar, several high-impact events are on the horizon. Friday's GBP data could provide some support for the pound if it comes in stronger than expected. However, any positive impact is likely to be offset by broader dollar strength if the US releases positive data on the same day. Traders will be closely watching these releases for potential catalysts.
Given the current technical and fundamental backdrop, a short-term trading strategy is risky. The ADX across multiple timeframes indicate that the market is choppy and ranging. A daily close above 1.34439 would open the door for a test of the 1.3482 level. This level, coinciding with previous swing highs, would likely act as a significant barrier.
Be aware that the recent volatility in oil prices could trigger unexpected market movements. The market is currently sensitive to geopolitical developments, and any escalation of tensions could lead to sharp swings in both the dollar and GBPUSD.
Traders should also be mindful of potential false breakouts. With the ADX indicating a weak trend, the market is prone to sudden reversals. Therefore, it's crucial to wait for confirmation before entering any positions. Look for sustained price action above resistance or below support before committing capital.
For swing traders, patience is key. A more conservative approach would be to wait for a clear break and retest of either the 1.34439 resistance or the 1.33799 support before initiating a position. This would provide a higher probability of success and reduce the risk of being caught in a false move.
For scalpers, the volatility may present some opportunities. However, given the lack of a clear trend, it's important to trade with caution and use tight stop-loss orders. Focus on small, quick profits and avoid holding positions overnight.
Long-term investors should remain on the sidelines for now. The technical picture is unclear, and the fundamental outlook is uncertain. It's best to wait for more clarity before committing capital to GBPUSD. A more attractive entry point may emerge in the coming weeks or months.
| Indicator | Value | Signal | Interpretation |
|---|---|---|---|
| RSI (14) | 41.32 | Bearish | Further downside potential |
| MACD Histogram | Negative | Bearish | Downward momentum |
| Stochastic | K=56.29, D=46.08 | Bullish | Potential for a short-term bounce |
| ADX | 27.63 | Weak | Trend is not strong |
| Bollinger | Middle Band | Neutral | Price is consolidating |
Frequently Asked Questions: GBPUSD Analysis
What happens if GBPUSD breaks below 1.33799 support?
If GBPUSD breaks below the 1.33799 support level, it could trigger a further decline towards the next support zone around 1.3354. This breakdown would confirm the bearish momentum and potentially accelerate the downward trend.
Should I sell GBPUSD at current levels of $1.3388 given the RSI at 41.32?
While the RSI at 41.32 suggests bearish momentum, it's not yet in oversold territory. A more conservative approach would be to wait for a confirmed break below 1.33799 before initiating a short position. Monitor price action and volume for confirmation.
Is the bearish MACD signal a reliable indicator of further downside for GBPUSD?
The negative MACD histogram reinforces the bearish outlook, but it's important to consider other factors. Look for confluence with other indicators and key price levels to increase the reliability of the signal. A break below 1.33799, combined with the MACD signal, would provide stronger confirmation.
How will the upcoming GBP data on Friday affect GBPUSD this week?
Stronger-than-expected GBP data on Friday could provide some short-term support for the pound. However, the impact is likely to be limited if the dollar continues to strengthen. Focus on the relative performance of the data compared to expectations and the broader market context.
Track markets in real-time
AI-powered analysis, technical indicators and real-time price data.
Join Our Telegram Channel
Breaking market news, AI analysis and trading signals instantly.
Join Channel