The narrative around GBPUSD has shifted decisively bearish, and the current price action near $1.3320 is painting a picture of cautious consolidation rather than a robust recovery. While the pair attempted a rebound earlier, the underlying trend, particularly on the daily timeframe, remains firmly entrenched in a downtrend. This analysis delves into the confluence of technical indicators, macroeconomic drivers, and geopolitical undercurrents shaping the outlook for the British Pound against the US Dollar.
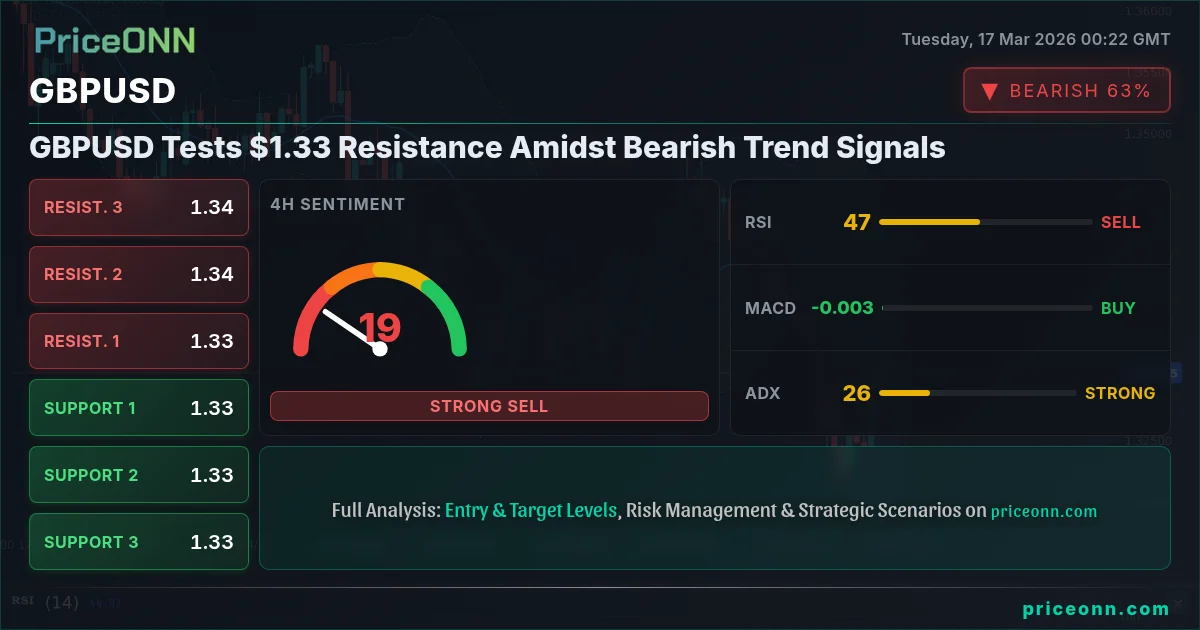
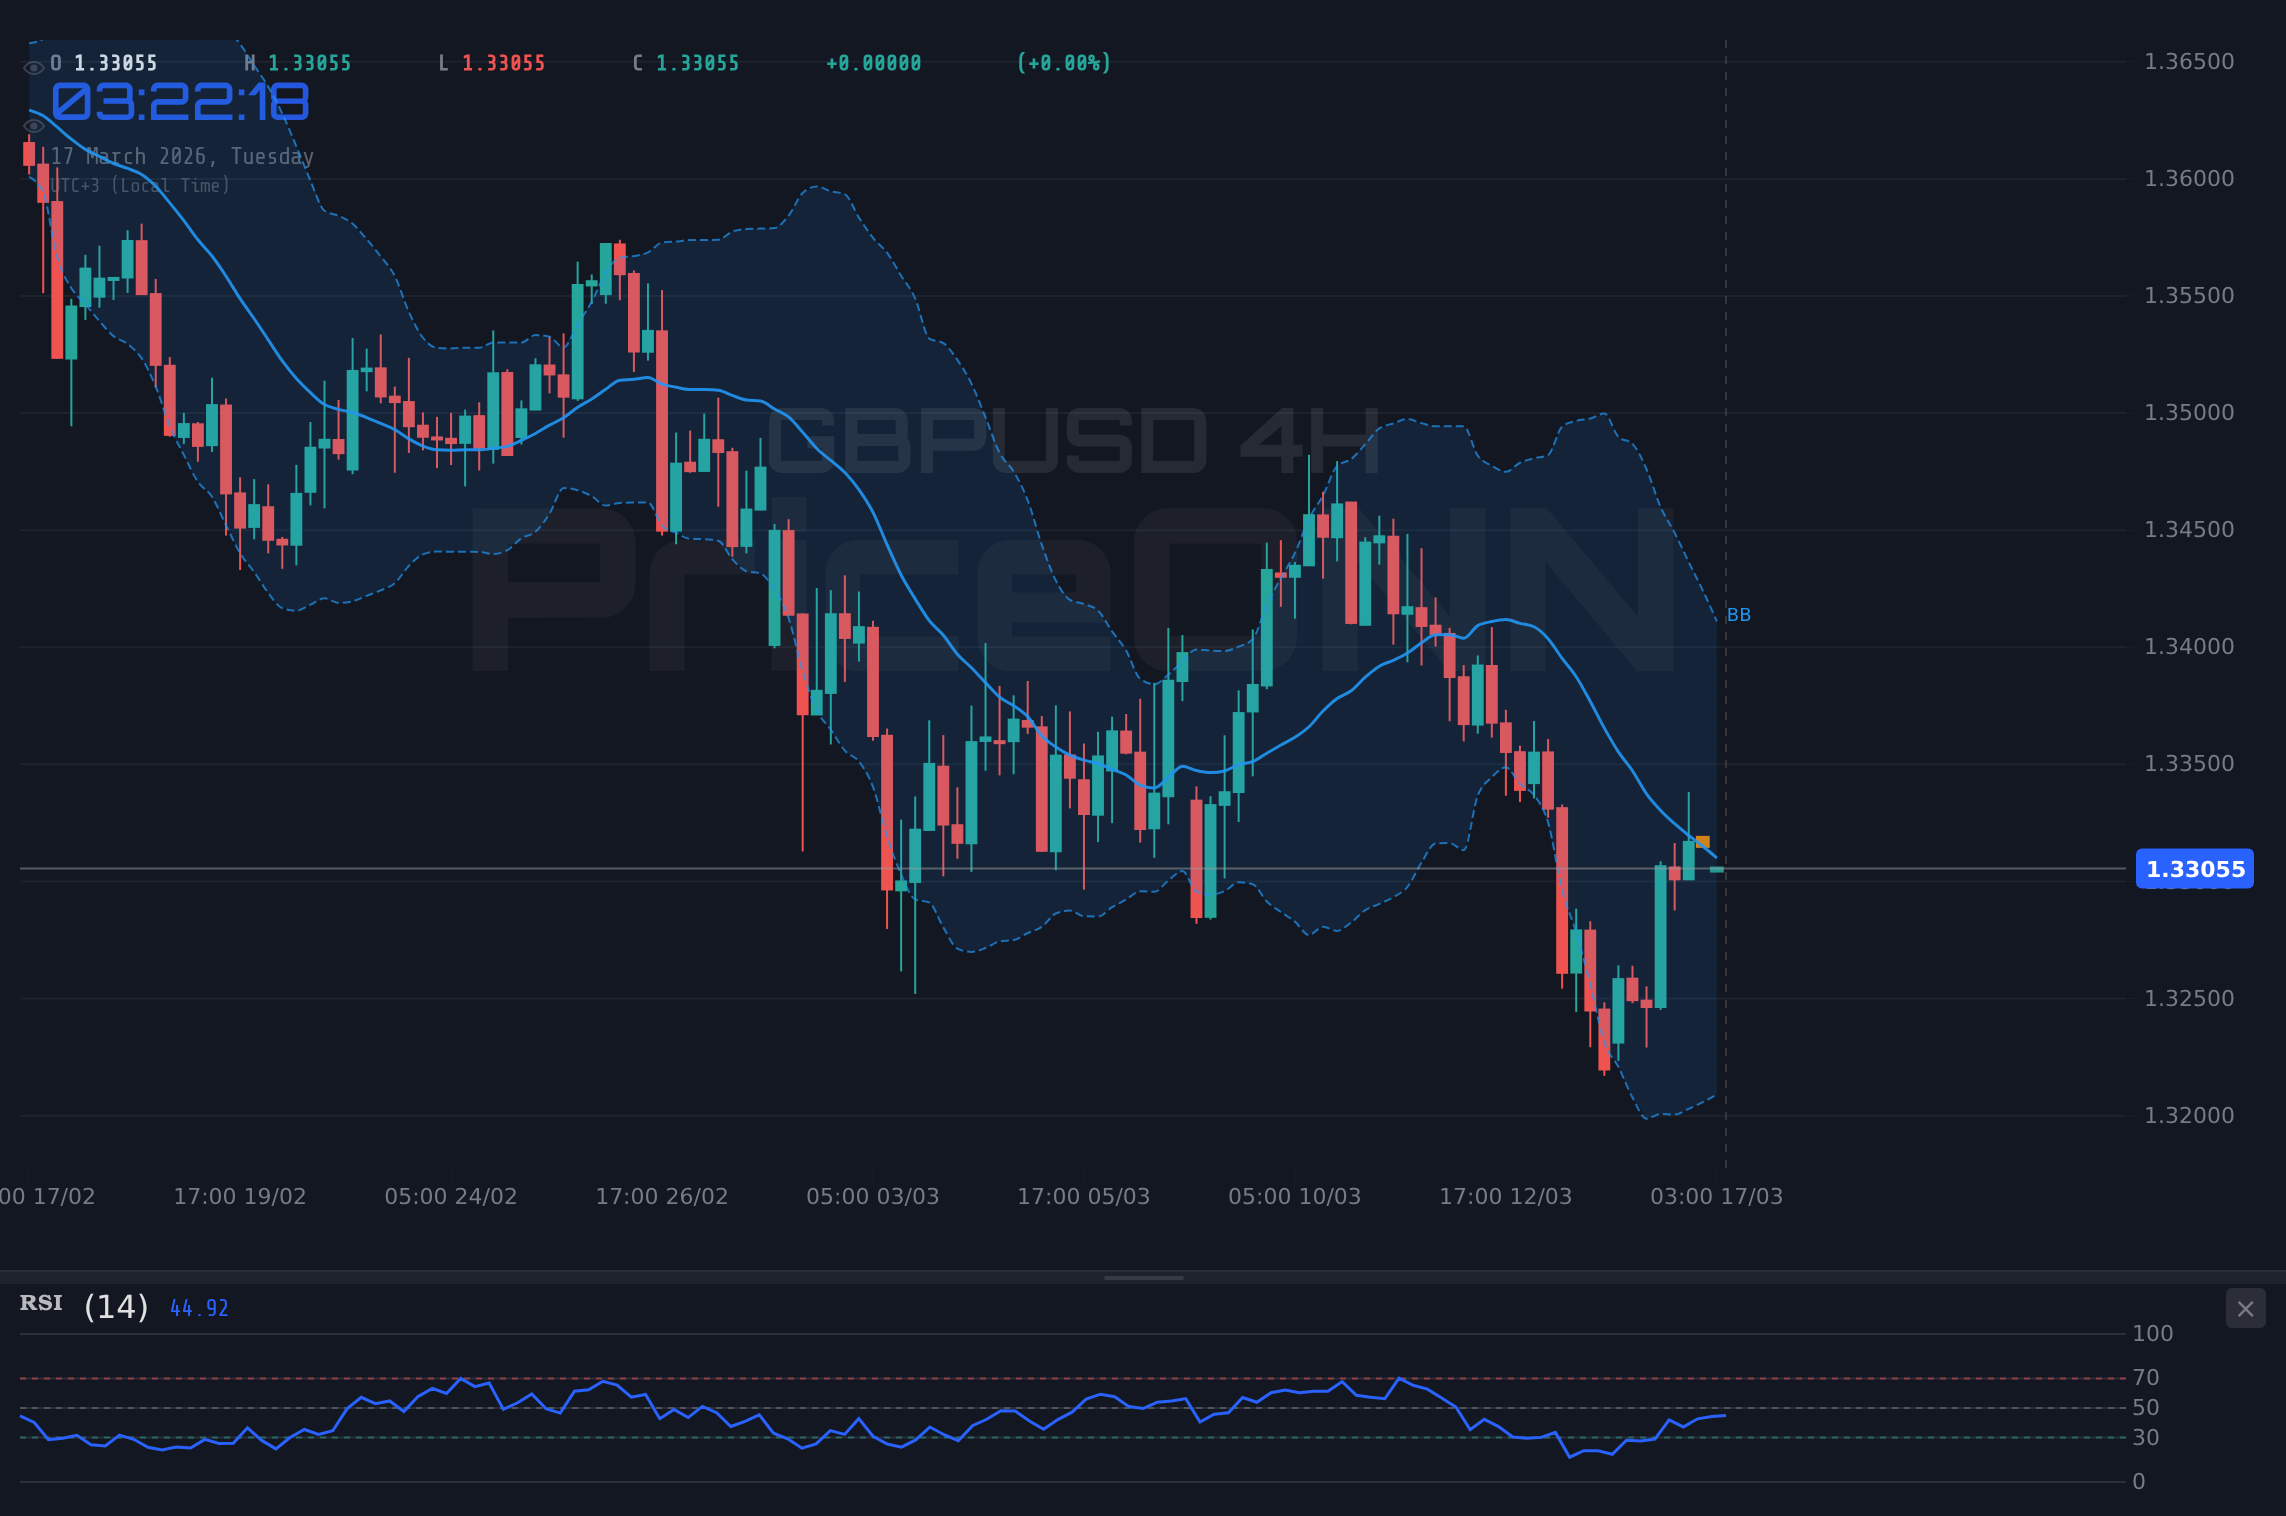
Having observed the recent price action, it’s clear that the $1.33 level for GBPUSD is not just a psychological mark but a critical battleground. The data shows a current price of $1.33106, with resistance at $1.33157 on the 4-hour chart and $1.33239 on the 1-hour chart. The fact that the pair is testing these levels after a significant daily downtrend suggests that any upward momentum might be met with renewed selling pressure. The 1-hour chart shows a potential bullish signal with RSI at 59.03 and MACD positive, but this is sharply contrasted by the daily RSI at 40.39 and a bearish MACD signal, painting a more concerning picture for the bulls. This divergence highlights the need for a multi-timeframe approach and a careful assessment of what might be driving these opposing signals.
- GBPUSD is trading near $1.33106, facing resistance around $1.33157-$1.33239.
- Daily chart shows a strong bearish trend (ADX 30.41, RSI 40.39), despite short-term bullish signals on 1H.
- DXY is at 99.64, showing a daily uptrend (ADX 31.72), which typically pressures GBPUSD.
- Oil prices (Brent $101.16, WTI $95.04) are volatile but trending lower on 1H, potentially easing inflation fears but adding to risk-off sentiment.
- Traders should watch for a break below the 1.33093 support level for potential downside continuation.
Navigating the Dollar's Strength and Risk Sentiment
DXY's Dominance and its Ripple Effect
The US Dollar Index (DXY) is currently trading at 99.64, and its daily chart exhibits a strong uptrend with an ADX of 31.72. This indicates that the dollar is gaining strength, which traditionally exerts downward pressure on pairs like GBPUSD. A rising dollar often signifies a global preference for safe-haven assets, especially when geopolitical tensions are elevated, as seen with the ongoing volatility in oil prices. The DXY's ability to hold above its 99.50 support level on the daily chart reinforces this bullish outlook for the dollar, making it harder for riskier currencies or assets to gain significant traction. The correlation is clear: as the dollar strengthens, GBPUSD tends to decline, especially when the daily trend for GBPUSD itself is bearish, as indicated by its own ADX of 30.41.
The current technical picture for the DXY on the 1-hour chart shows a neutral trend, but the daily chart's strength cannot be ignored. With RSI at 66.79, it’s moving towards overbought territory, suggesting potential for a pause or minor pullback. However, the Stochastic indicator is showing a bullish signal (%K > %D) and is in the overbought zone, which could precede a consolidation phase rather than a sharp reversal. This dynamic means that while the dollar might consolidate in the short term, the underlying strength on the daily chart suggests that any weakness in GBPUSD will likely be more pronounced.
GBPUSD's Technical Crossroads: A Battle Between Timeframes
Short-Term Signals vs. Daily Trend
The 1-hour GBPUSD chart presents a somewhat mixed, yet leaning bullish, picture. The RSI at 59.03 is in neutral territory but trending upwards, and the MACD is positive with the MACD line above the signal line. Stochastic also shows a potential rally, with K at 50.51 and D at 69.14, indicating a cross that might suggest a move higher, though it's currently in a bearish signal zone (%K
The immediate resistance levels on the 1-hour chart are $1.33166, $1.33211, and $1.33239. A sustained break above these levels would be needed to challenge the bearish narrative. However, the daily support at $1.31683, $1.31169, and $1.30168 looms large. The current price of $1.33106 is precariously positioned between these conflicting signals. The ADX readings across timeframes are particularly telling: strong downtrend on daily (30.41) and 4-hour (34.8), but a strong uptrend on the 1-hour (28.59). This suggests that the intraday moves might be volatile, but the larger trend is still down. Traders should exercise caution, as the short-term bullish signals could simply be a retracement before a larger move lower.
Global Economic Crosscurrents: Inflation, Rates, and Risk
The Shadow of Inflation and Central Bank Policy
The global economic landscape remains a complex tapestry woven with threads of inflation, evolving central bank policies, and shifting risk sentiment. While the provided data doesn't include specific central bank meeting minutes or rate hike probabilities, the general market context is crucial. The volatility in oil prices, with WTI currently at $95.04 and Brent at $101.16, suggests that inflationary pressures, while perhaps easing from their peaks, are still a significant concern. The fact that both are showing a 1-hour downtrend might indicate a temporary cooling of supply shock fears, but the daily uptrend for both commodities, particularly Brent's very strong ADX of 57.88, suggests that the underlying inflationary risk from energy is far from extinguished. This sustained elevated energy price environment keeps central banks on high alert, potentially delaying any dovish pivots and maintaining upward pressure on bond yields.
For GBPUSD, this means that the Bank of England (BoE) is likely to remain cautious. While inflation might be moderating, any resurgence driven by energy prices would complicate their policy path. The US Federal Reserve, as evidenced by the strong DXY trend, also appears to be prioritizing inflation control. This environment of higher-for-longer interest rates, or at least a reluctance to cut rates prematurely, generally supports the US Dollar, acting as a headwind for GBPUSD. The market's reaction to economic data, therefore, will be highly sensitive to its implications for inflation and future monetary policy. We need to see clear data that definitively points to cooling inflation and a less hawkish central bank stance to expect a sustained reversal in GBPUSD.
Risk Appetite and Commodity Volatility
The interplay between commodity prices and risk sentiment is a critical factor. While oil prices have seen a pullback on the 1-hour charts, the overall trend on the daily charts remains upward for Brent and WTI. This persistent strength in oil, even with short-term dips, can fuel inflation concerns and contribute to a general risk-off sentiment in the markets. We see this reflected in the mixed signals across equity indices. While SP500 (6694.15) and Nasdaq100 (24633.75) show some intraday strength, their daily charts indicate a strong bearish trend. This suggests that despite short-term rallies, the broader market sentiment might still favor caution, which benefits the US Dollar and weighs on currencies like the British Pound.
The volatility in commodities like gold (XAUUSD at 5008.92) and silver (XAGUSD at 80.93) also plays a role. Gold's daily trend is neutral, but its RSI at 47.28 and MACD negative suggest a lack of bullish conviction. Silver, while showing a daily downtrend, has support at $78.15. This overall cautious environment in commodities, coupled with the strong dollar, reinforces the bearish outlook for GBPUSD. Investors are likely to remain risk-averse, seeking the safety of the dollar rather than exposing themselves to the potential volatility of currencies like the pound, especially when domestic economic headwinds are also present.
Geopolitical Tensions: A Constant Undercurrent
The Middle East Factor and its Global Reach
Geopolitical developments, particularly in the Middle East, continue to cast a long shadow over global markets. The recent news regarding Hormuz Strait tensions and Japan tapping strategic oil reserves, alongside WTI crude falling below $95 after hitting $101, underscores the fragility of the energy markets. Escalating tensions in the region have a direct impact on oil prices, which in turn influences inflation expectations and central bank policy globally. This heightened geopolitical risk environment generally boosts demand for safe-haven assets like the US Dollar, further exacerbating the downward pressure on GBPUSD. While short-term de-escalations might provide temporary relief, the underlying geopolitical instability remains a significant risk factor that could trigger renewed risk aversion at any moment.
The market's reaction to these events is often swift and decisive. A spike in oil prices due to geopolitical flare-ups can quickly translate into a stronger dollar and weaker risk assets. Conversely, news of de-escalation, as suggested by the easing of Hormuz tensions, can lead to a temporary pullback in oil and a slight easing of risk-off sentiment. However, the persistent nature of these geopolitical risks means they are likely to remain a background factor influencing market sentiment and currency movements for the foreseeable future. For GBPUSD, this means that any positive news flow that might otherwise support the pound could be easily overshadowed by geopolitical uncertainties and their impact on the dollar's safe-haven appeal.
Trade Scenarios for GBPUSD
Bullish Scenario: A Rebound Against the Trend?
The bullish scenario for GBPUSD hinges on a significant shift in short-term momentum carrying over into the daily timeframe, coupled with external catalysts. For this to play out, we would need to see a decisive break and sustained hold above the immediate 1-hour resistance at $1.33239. This would ideally be followed by a push through the 4-hour resistance at $1.33304. Confirmation would come from the daily RSI breaking above 50 and the MACD showing a bullish crossover. A key driver could be surprisingly strong UK economic data or a dovish signal from the Bank of England that challenges current interest rate expectations. Furthermore, a significant drop in DXY below its 99.50 daily support level would provide a crucial tailwind. However, given the strong daily bearish trend (ADX 30.41), this scenario currently carries a lower probability, perhaps around 25-30%. The immediate target would be the next 4-hour resistance at $1.33445, with a more ambitious target at the daily resistance of $1.34199, though this seems unlikely in the current climate.
Bullish Scenario: Rebound Above Resistance
30% ProbabilityBearish Scenario: Trend Continuation
The more probable scenario involves the continuation of the established bearish trend on the daily chart. This thesis is supported by the strong daily ADX of 30.41 and RSI below 50. The immediate trigger would be a break below the 1-hour support at $1.33020. This would likely be followed by a move towards the 4-hour support levels at $1.32869 and $1.32728. A decisive close below $1.32581 (4-hour support) would strengthen the bearish case significantly and open the path towards the larger daily support levels. Catalysts for this move could include weak UK economic data (e.g., PMI, inflation figures), hawkish signals from the Fed, or further escalation of geopolitical risks boosting the safe-haven dollar. Given the current technical setup and market sentiment, this scenario appears more likely, carrying a probability of 60-70%. The initial target would be the 4-hour support at $1.32728, with a secondary target at $1.31683 (daily support).
Bearish Scenario: Trend Continuation Below Support
70% ProbabilityNeutral Scenario: Range-Bound Consolidation
A third possibility is a period of consolidation, where GBPUSD remains range-bound between the immediate 1-hour support at $1.33020 and resistance at $1.33239. This scenario often occurs when conflicting signals are present, or the market awaits significant news, such as upcoming economic data releases or central bank commentary. The ADX readings across different timeframes are somewhat contradictory, with a strong uptrend on 1H and strong downtrends on 4H and Daily. This could lead to choppy price action within a defined range. In this case, traders might look for opportunities at the edges of the range, but the overall trend bias would remain uncertain until a clear breakout occurs. This scenario has a moderate probability, perhaps 10-15%, and would likely persist until a catalyst forces a directional move.
Conclusion: Navigating Uncertainty with Discipline
The current technical and fundamental picture for GBPUSD presents a challenging environment for traders. While short-term charts offer glimmers of bullish potential, the dominant daily bearish trend, reinforced by a strong US Dollar and persistent geopolitical risks, suggests that downside remains the more probable path. The key levels to watch are the immediate resistance around $1.33157-$1.33239 and the support at $1.33020. A clear break above resistance could signal a short-covering rally, but a break below support is more likely to confirm the bearish trend continuation.
The interplay between the DXY's strength, oil price volatility, and central bank policy expectations will be crucial in the coming days. Investors must remain vigilant for economic data releases that could sway monetary policy expectations, as these will likely be the primary drivers of significant price moves. For now, patience and risk management are paramount. The market is offering conflicting signals across different timeframes, making it essential to wait for clearer confirmation before committing to a significant directional trade. The current price action near $1.33 suggests that the market is in a holding pattern, but the underlying bearish trend implies that a move lower is the more likely outcome if key support levels falter.
Frequently Asked Questions: GBPUSD Analysis
What happens if GBPUSD breaks below the $1.33020 support level?
A break below $1.33020 on the 1-hour chart would likely trigger further selling, targeting the 4-hour support at $1.32869 and potentially $1.32728. This would confirm the bearish trend continuation, especially if accompanied by weak UK economic data or continued dollar strength.
Should I buy GBPUSD at current levels near $1.33106, given the mixed signals?
Buying at current levels is risky due to the strong daily bearish trend (RSI 40.39, ADX 30.41). While the 1-hour chart shows some bullish signals, confirmation is needed. A more prudent approach might be to wait for a confirmed break above $1.33239 resistance or a clear break below $1.33020 support, with a probability favoring the downside.
Is the RSI at 40.39 on the daily chart a sell signal for GBPUSD?
An RSI of 40.39 on the daily chart is considered within the neutral-to-bearish range, indicating that sellers have more control than buyers. While not yet oversold, it supports the prevailing bearish trend and suggests that upside momentum is limited, making it a cautionary signal against buying.
How will upcoming Fed policy outlook and oil price volatility affect GBPUSD this week?
A hawkish outlook from the Fed would likely strengthen the DXY (currently 99.64, daily uptrend), putting more pressure on GBPUSD. Similarly, renewed spikes in oil prices (WTI $95.04) could fuel inflation concerns, reinforcing a risk-off mood and dollar strength, thus likely pushing GBPUSD lower.
Track markets in real-time
AI-powered analysis, technical indicators and real-time price data.
Join Our Telegram Channel
Breaking market news, AI analysis and trading signals instantly.
Join Channel