GBPUSD is currently trading near $1.34, facing downward pressure amid the escalating oil crisis and mixed economic signals. The currency pair is navigating a complex landscape, with the strength of the US dollar and global risk sentiment adding further layers of uncertainty.
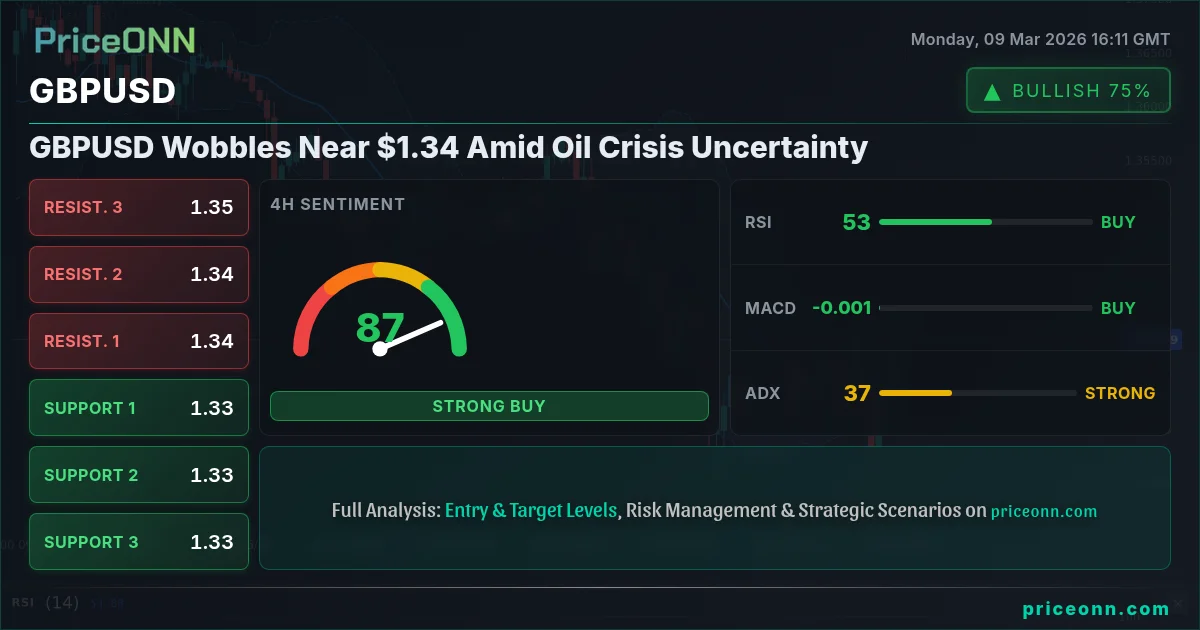
- RSI at 35.34 on the daily chart suggests potential oversold conditions, but the downward trend remains strong.
- Key support level sits at 1.33356, a break below which could trigger further downside.
- MACD histogram shows negative momentum, indicating sustained selling pressure.
- The oil crisis and its impact on global growth expectations are driving GBPUSD correlation with DXY.
Why $1.33356 is the Line in the Sand
The immediate support level for GBPUSD lies at 1.33356, a level that has acted as a crucial pivot point in recent trading sessions. A sustained break below this level could open the door for further declines towards 1.32738 and potentially 1.32374. The daily chart reveals a strong bearish trend, with the ADX at 29.48 indicating the presence of a robust downtrend. This means that the current selling pressure is not merely a short-term correction but a sustained move driven by underlying market forces.
The technical picture is further complicated by the Stochastic oscillator, with %K at 30.94 and %D at 31.54 signaling continued downward momentum. This reinforces the bearish outlook and suggests that any potential rallies may be short-lived. Traders should be wary of false breakouts and focus on confirming signals before initiating long positions.
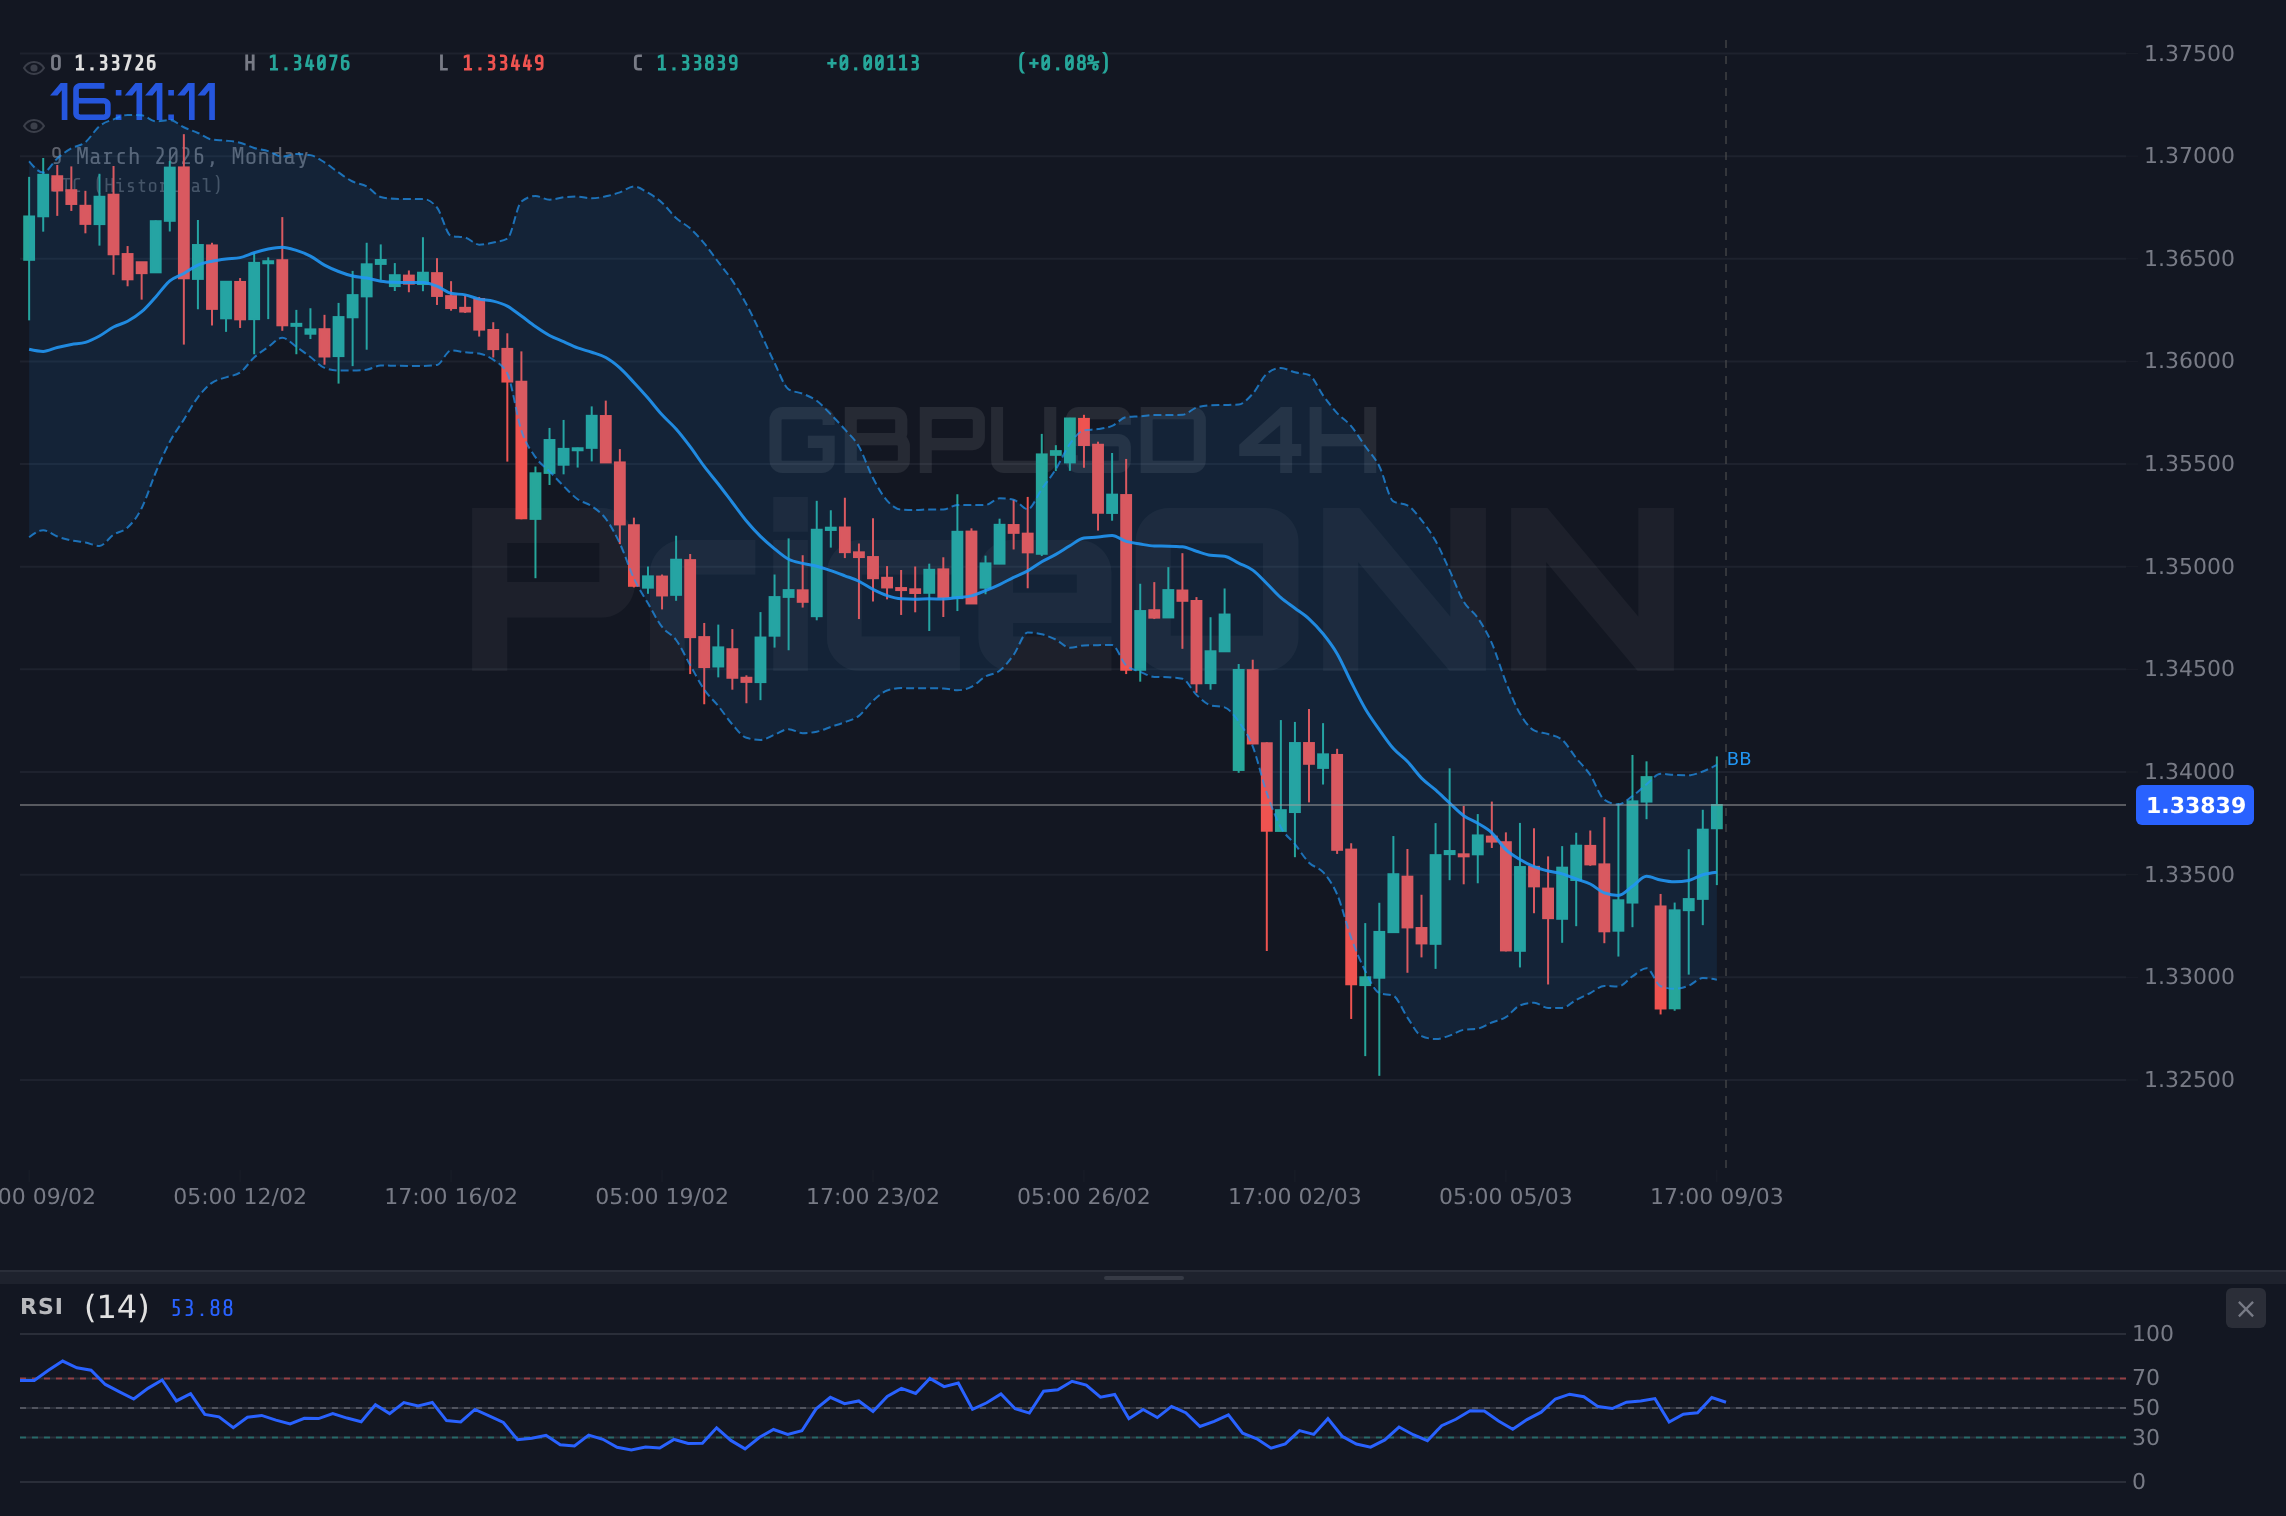
However, it's not all doom and gloom for GBPUSD bulls. The RSI at 35.34 hints at potential oversold conditions, which could lead to a temporary bounce. But the overall trend remains bearish, and any such bounce should be viewed as an opportunity to sell at higher levels rather than a signal to initiate new long positions.
Oil Crisis and its Impact on GBPUSD
The escalating oil crisis, triggered by tensions in the Middle East, is adding another layer of complexity to the GBPUSD equation. As reported by Forex Haber, the oil price surge is impacting global forex markets, with EUR/CAD experiencing a sharp decline. The rise in oil prices is exacerbating inflationary pressures, which could force central banks to adopt a more hawkish stance. This, in turn, could lead to higher interest rates and a stronger dollar, further weighing on GBPUSD.
With Brent crude oil prices near $65.73, the energy market is closely watching for further escalations. The UK, being a net importer of energy, is particularly vulnerable to oil price shocks. This vulnerability is reflected in the bearish sentiment surrounding GBPUSD, as traders anticipate the potential impact on the UK economy.
DXY Strength and GBPUSD Correlation
The strength of the US dollar, as measured by the DXY, is another key factor weighing on GBPUSD. The DXY is currently trading at 98.8, with the 1-day trend showing a bullish signal. As the dollar strengthens, it puts downward pressure on other currencies, including the British pound. This inverse correlation between the DXY and GBPUSD is a crucial consideration for traders.
The DXY's 4-hour chart reveals a strong bullish trend, with the ADX at 41.29 indicating sustained upward momentum. This suggests that the dollar's strength is likely to persist, putting continued pressure on GBPUSD. Traders should closely monitor the DXY for further clues about the direction of GBPUSD.
Economic Data and Central Bank Policies
This week's economic data releases will provide further insights into the health of the UK and US economies. The high impact event on March 11th, related to the EUR, will be in focus. Investors are also awaiting the U.S. data releases. Any signs of weakness in the UK economy could further weigh on GBPUSD, while strong US data could reinforce the dollar's strength.
The policies of the Bank of England (BoE) and the Federal Reserve (Fed) will also play a crucial role in shaping the direction of GBPUSD. Any dovish signals from the BoE could lead to further downside potential, while hawkish signals from the Fed could reinforce the dollar's strength. Traders should closely monitor central bank communications for clues about future policy moves.
GBPUSD Trade Plan: Bearish Continuation
Given the bearish technical picture and the challenging fundamental backdrop, a short position in GBPUSD appears to be a prudent strategy. The ADX at 38.88 on the 4-hour chart confirms the presence of a strong downtrend, while the MACD histogram shows negative momentum. Although the Stochastic oscillator is approaching oversold levels, the overall trend remains bearish, suggesting that any potential rallies may be short-lived.
GBPUSD breaks below 1.33541 (1H support), triggering a move towards 1.33055 (4H support) and then 1.32728 (4H support). Continued dollar strength and negative UK economic data fuel the decline.
GBPUSD finds support at 1.33541 (1H support), leading to a bounce towards 1.33896 (1H resistance) and potentially 1.34028 (1H resistance). A weaker dollar and positive UK economic data drive the rally.
Risk Management is Key
Trading always involves risk, and it's crucial to manage your risk effectively. Before initiating any trade, make sure to assess your risk tolerance and set appropriate stop-loss levels. Given the heightened volatility in the forex market, it's particularly important to be cautious and avoid overleveraging your positions.
The upcoming economic data releases and central bank communications could trigger significant market movements. Be prepared to adjust your positions accordingly and avoid making impulsive decisions based on short-term market fluctuations. Patience and discipline are essential for successful trading.
GBPUSD: A Multi-Timeframe Perspective
Analyzing GBPUSD across different timeframes provides a more comprehensive picture of the market. The 1-hour chart reveals a neutral trend, with the ADX at 17.11 indicating a lack of strong momentum. The 4-hour chart, on the other hand, shows a strong bearish trend, with the ADX at 38.88. The daily chart confirms the bearish outlook, with the ADX at 29.48.
This multi-timeframe analysis suggests that the overall trend for GBPUSD is bearish, but there may be short-term opportunities for counter-trend trades. Scalpers may look to capitalize on intraday bounces, while swing traders may focus on shorting rallies. Long-term investors should remain cautious and avoid initiating new long positions until the bearish trend reverses.
Frequently Asked Questions: GBPUSD Analysis
Is GBPUSD a good buy right now?
Given the current bearish trend and the prevailing uncertainties, GBPUSD is not a strong buy right now. The RSI at 35.34 on the daily chart suggests potential oversold conditions, but the downward momentum remains strong. Traders should wait for a clear reversal signal before considering long positions.
What is the GBPUSD price forecast for this week?
The GBPUSD price forecast for this week is bearish, with a potential move towards 1.33356 and potentially lower towards 1.32738. The strength of the US dollar and the ongoing oil crisis are likely to continue weighing on the currency pair. However, a surprise positive development in the UK economy could trigger a temporary bounce.
What are the key support and resistance levels for GBPUSD?
Key support levels for GBPUSD are 1.33541 (1H support), 1.33356 (1D support), and 1.32738 (1D support). Key resistance levels are 1.33896 (1H resistance), 1.34028 (1H resistance), and 1.34338 (1D resistance). A break below the support levels could trigger further downside, while a break above the resistance levels could signal a potential reversal.
Why is GBPUSD moving today?
GBPUSD is moving lower today due to a combination of factors, including the strength of the US dollar, the escalating oil crisis, and mixed economic signals. The DXY is trading higher, putting downward pressure on GBPUSD. The oil price surge is adding to inflationary pressures, which could force central banks to adopt a more hawkish stance.
Volatility Creates Opportunity
The current market environment is characterized by heightened volatility and uncertainty. However, volatility also creates opportunities for those who are prepared. By carefully analyzing the technical picture, monitoring the fundamental drivers, and managing your risk effectively, you can navigate these choppy waters and potentially profit from market fluctuations.
Remember, patience and discipline are key. Wait for your setup, manage your risk, and don't be afraid to walk away if the market doesn't cooperate. The market always gives a second chance. With disciplined risk management, these choppy waters can be navigated safely.
Technical Outlook Summary
| Indicator | Value | Signal |
|---|---|---|
| RSI (14) | 35.34 | Oversold |
| MACD Histogram | Negative Momentum | Bearish |
| Stochastic | 30.94/31.54 | Bearish |
| ADX | 29.48 | Strong Downtrend |
| Bollinger | Lower Band | Watch |
Key Levels
Support Levels
Resistance Levels
Track markets in real-time
AI-powered analysis, technical indicators and real-time price data.
Join Our Telegram Channel
Breaking market news, AI analysis and trading signals instantly.
Join Channel