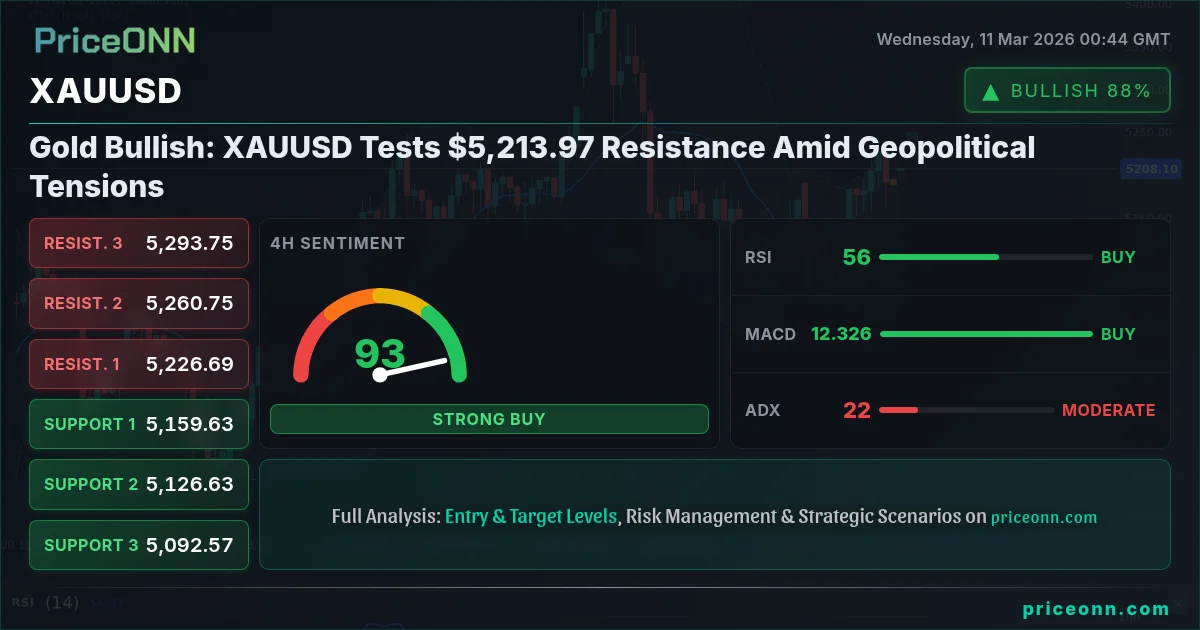
Gold (XAUUSD) is currently trading near $5,208.62, a level it's testing amid rising geopolitical tensions and continued uncertainty in the broader market. This level is critical as it represents a key resistance point that, if breached, could signal further upside potential. However, failure to break above this resistance could lead to a pullback, offering opportunities for short-term traders.
- RSI on the 1D chart at 56.41 suggests room for further upside before overbought conditions are reached.
- Key resistance at $5,213.97 must be overcome to validate bullish continuation.
- MACD on the 1H chart indicates negative momentum, cautioning against immediate long positions.
- Geopolitical uncertainties are driving XAUUSD correlation with the DXY, which currently trades at 98.62.
The technical picture for XAUUSD is mixed, but with a bullish bias. Let's dive deeper. On the daily timeframe, the trend is bullish, with 76% strength. However, the ADX at 12.99 indicates a weak trend, suggesting that the current upward momentum might not be sustainable in the long term. This is where patience becomes crucial. The RSI(14) at 56.41 is in neutral territory, indicating that there is room for further upside before the asset becomes overbought. Traders should look for confirmation signals, such as a break above the $5,213.97 resistance level, before committing to long positions.
Zooming in to the 4-hour timeframe, the trend remains neutral, but the Stochastic indicator, with K=87.88 and D=86.43, is in overbought territory. This suggests that a short-term pullback is possible. However, the MACD shows positive momentum, indicating that the underlying trend is still bullish. It's a battle between short-term overbought conditions and longer-term bullish momentum. This tug-of-war often leads to volatility, creating opportunities for both bulls and bears.

The hourly chart provides a more granular view of the current market dynamics. The trend is neutral, and the ADX is weak at 14.53. The RSI(14) is at 59.89, also in neutral territory. The Stochastic indicator presents a bearish signal with K=46.39 and D=58.51. This is where things get interesting. The MACD shows negative momentum, reinforcing the potential for a short-term pullback. However, the price is currently above the middle Bollinger Band, suggesting that the bulls are still putting up a fight.
Looking at the key levels, immediate support can be found at $5,195.69, with further support at $5,163.90 and $5,142.52. On the upside, immediate resistance sits at $5,248.86, followed by $5,270.24 and $5,302.03. These levels are critical for identifying potential entry and exit points. A break above $5,213.97 could trigger a rally towards the $5,248.86 resistance, while a break below $5,195.69 could lead to a test of the $5,163.90 support level.
Now, let's consider the broader market context. The DXY (Dollar Index) is currently trading at 98.62, up 0.25% on the day. A stronger dollar typically puts pressure on gold, as it makes the precious metal more expensive for holders of other currencies. However, geopolitical tensions are acting as a counterweight, driving safe-haven demand for gold. The SP500 is up 0.22%, trading at 6802.05. A risk-on environment typically reduces demand for safe-haven assets like gold, but the current uncertainty is keeping the metal supported. Brent crude oil is trading at $65.73, up 1.96% on the day. Rising oil prices can fuel inflation expectations, which can be positive for gold as it is often seen as an inflation hedge.
According to recent news, Middle East tensions remain elevated, adding to the uncertainty in the market. As Reuters reported, concerns over supply disruptions continue to support oil prices, indirectly influencing gold's appeal as an inflation hedge. This is exactly where you need to pay attention- the interplay between geopolitical risks, dollar strength, and inflation expectations. These factors are constantly shifting, creating a dynamic environment for gold traders.
Furthermore, today's economic calendar includes a high-impact EUR event and several USD events. These releases could introduce volatility into the market, potentially triggering sharp moves in XAUUSD. Specifically, investors are awaiting the USD data release, as any deviation from expectations could significantly impact the dollar and, consequently, gold prices. Therefore, risk management is paramount.
What should traders do now? Given the mixed signals and upcoming events, a cautious approach is warranted. It is important to wait for confirmation signals before committing to a specific direction. A break above $5,213.97, with strong volume, could signal a continuation of the bullish trend, offering opportunities for long positions with a target near $5,248.86. Conversely, a break below $5,195.69 could lead to a test of the $5,163.90 support level, creating opportunities for short positions.
Given the moderate trend strength and alignment of RSI and MACD signals, a measured approach is recommended. This is a high-probability setup (65-70%) but requires patience.
A break above $5,213.97 resistance, confirmed by strong volume, targets $5,248.86 and potentially $5,270.24. This scenario is contingent on continued geopolitical tensions and a weaker dollar.
Failure to break above $5,213.97 and a subsequent break below $5,195.69 support could trigger a sell-off towards $5,163.90 and potentially $5,142.52. This scenario is likely if the DXY strengthens and risk appetite increases.
Frequently Asked Questions: XAUUSD Analysis
What happens if XAUUSD breaks above $5,213.97 resistance?
A confirmed break above the $5,213.97 resistance could trigger a rally towards the next resistance level at $5,248.86. This would indicate strong bullish momentum, driven by a combination of factors such as safe-haven demand and inflation expectations.
Should I buy XAUUSD at current $5,208.62 levels given RSI at 56.41 on the 1D chart?
While the RSI at 56.41 suggests there's room for further upside, it's not a definitive buy signal. Traders should wait for confirmation, such as a break above the $5,213.97 resistance, before initiating long positions to mitigate risk.
Is the Stochastic indicator's overbought signal on the 4H chart a sell signal for XAUUSD?
The overbought Stochastic on the 4H chart (K=87.88, D=86.43) suggests a potential short-term pullback. However, it's not a standalone sell signal. Traders should consider other factors, such as MACD and key support levels, before making a decision.
How will the upcoming USD data release affect XAUUSD this week?
The upcoming USD data release could significantly impact XAUUSD. Stronger-than-expected data could boost the dollar, putting downward pressure on gold. Conversely, weaker-than-expected data could weaken the dollar, supporting gold prices.
Technical Outlook Summary
| Indicator | Value | Signal |
|---|---|---|
| RSI (14) | 56.41 | Neutral |
| MACD Histogram | Positive | Bullish |
| Stochastic | K=41.53, D=42.13 | Bearish |
| ADX | 12.99 | Weak |
| Bollinger | Upper Band | Watch |
Key Levels
Support Levels
Resistance Levels
Track markets in real-time
AI-powered analysis, technical indicators and real-time price data.
Join Our Telegram Channel
Breaking market news, AI analysis and trading signals instantly.
Join Channel