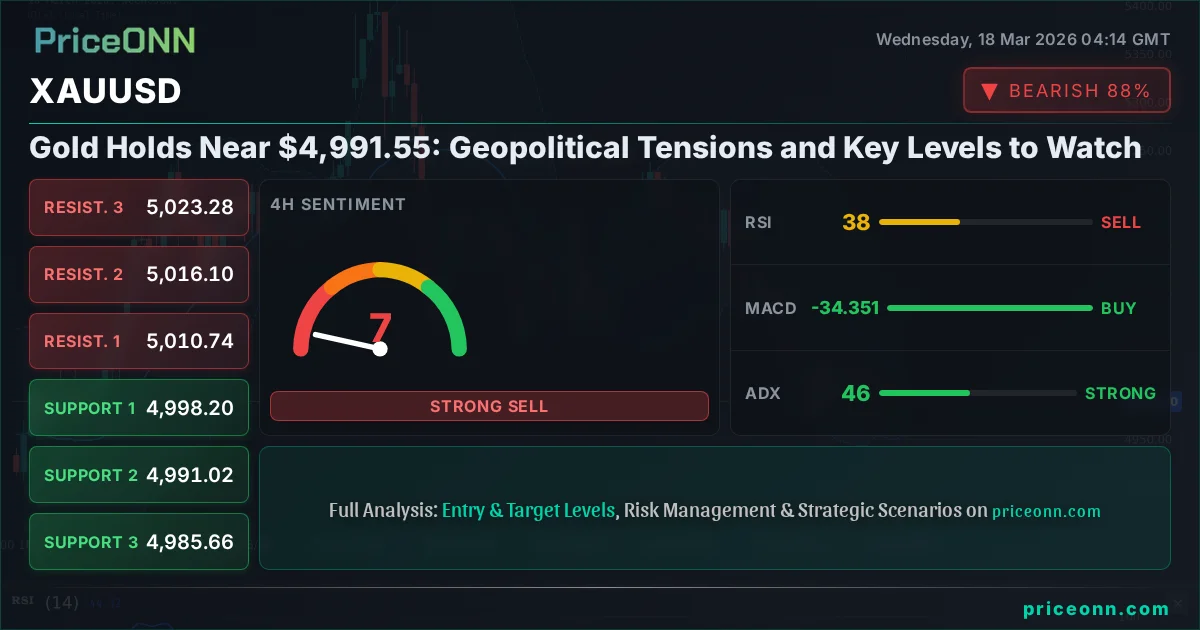
Gold is currently hovering just below the significant $5,000 mark, trading at $4,991.55. This price point comes amid a complex interplay of geopolitical anxieties and mixed technical signals, making it a critical juncture for traders and investors alike. The precious metal has seen a slight daily dip of 0.28%, translating to a $13.84 decrease, as it navigates a narrow range between $4,986.06 and $5,015.65. This consolidation phase follows a period of heightened volatility, leaving many to question the immediate direction of gold prices.
- Gold is trading at $4,991.55, showing a slight daily decline of 0.28%.
- Key support is identified at $4,985.86, with crucial resistance overhead at $5,002.26.
- The 1-hour RSI stands at 41.18, indicating a neutral stance with a slight downward bias.
- Geopolitical tensions and central bank policy expectations are key drivers influencing gold's safe-haven appeal.
From my perspective here in Frankfurt, the current market environment presents a fascinating dichotomy. We're seeing persistent geopolitical flare-ups, which traditionally bolster demand for safe-haven assets like gold. However, the DXY, or Dollar Index, is showing a strengthening trend, currently trading around 99.31. A stronger dollar typically acts as a headwind for gold, making it more expensive for holders of other currencies. This tug-of-war between safe-haven demand and dollar strength is creating the current consolidation pattern around the $4,991.55 level.
The 1-hour technical indicators paint a picture of caution rather than conviction. The RSI(14) is sitting at 41.18, firmly in neutral territory but leaning towards a bearish inclination. This suggests that while sellers aren't dominating, the momentum isn't strongly with the buyers either. Similarly, the MACD is showing negative momentum, with the MACD line below its signal line, reinforcing the slightly bearish short-term outlook. The Stochastic Oscillator, with K at 18.31 and D at 45.15, is deep in oversold territory, hinting at potential for a bounce, but the underlying trend strength, indicated by ADX at 25.08, suggests a solid downtrend is in play on this timeframe.

The Bull's Roadmap: Navigating Above $5,000
For gold bulls to regain control, a decisive move above the immediate resistance is paramount. The data indicates that the first significant hurdle lies at $5,002.26, followed by $5,012.74, and then the more substantial $5,018.66. A break and sustained hold above the $5,000 psychological level, particularly above the 1-hour resistance at $5,002.26, would signal renewed buying interest. This scenario gains traction if geopolitical tensions escalate further, prompting a flight to safety. Additionally, a softening in the DXY, perhaps triggered by dovish signals from the Federal Reserve or a dip in U.S. Treasury yields, could provide the necessary catalyst. The 4-hour chart shows resistance at $5,010.74 and $5,016.10, levels that would need to be breached for a more significant bullish move to materialize. If these levels are overcome, the next logical targets could be around the daily resistance points, starting with $5,041.99.
The daily chart, however, presents a more challenging picture for the bulls in the immediate term. While the long-term uptrend might still be intact, the current daily indicators suggest a neutral to bearish bias. The RSI(14) at 46.42 isn't showing signs of overheating, but it's also not indicating strong buying pressure. The MACD is below its signal line, and the Stochastic Oscillator is deeply oversold, with K at 12.26 and D at 22.75. This oversold condition, combined with a weak daily ADX of 13.43, suggests that any upward momentum might be short-lived unless accompanied by a significant shift in market sentiment or a clear break of the overhead resistance levels.
A bullish scenario would be further validated if we see a significant change in risk appetite across global markets. For instance, a sharp decline in the S&P 500 (currently trading around 6744.95) or Nasdaq (at 24915.74) would typically increase demand for gold as a safe haven. However, paradoxically, the S&P 500 is showing a strong daily uptrend with an ADX of 41.09, suggesting a risk-on environment, which usually dampens gold's appeal. This current divergence is a key factor to monitor. If equities continue to rally, it might put further pressure on gold unless geopolitical events override this sentiment.
Where Bears Take Control: Testing the $4,985 Support
On the flip side, a bearish outlook for gold remains a distinct possibility, especially if the current technical weaknesses persist. The immediate support level to watch is $4,985.86 on the 1-hour chart. A decisive break below this level could trigger a cascade of selling, targeting the subsequent support at $4,979.94 and then $4,969.46. The 4-hour chart reinforces this bearish potential, with support levels at $4,998.20, $4,991.02, and $4,985.66. A close below $4,985.86 on a 1-hour basis would likely lead to a test of the 4-hour support at $4,985.66, potentially opening the door for a move towards the daily support levels, starting with $4,971.11.
The broader 1-day technical picture supports a bearish case if key levels are breached. The daily RSI is at 46.42, with a downward trend, and the MACD is negative. The Stochastic Oscillator is deeply oversold, which could signal a bounce, but the ADX at 13.43 indicates a lack of strong trend, meaning price can move erratically. If gold prices fall below the $4,971.11 daily support, the next significant levels are $4,936.83 and $4,900.23. Such a move would likely coincide with a strengthening US Dollar (DXY) and potentially stable or rising equity markets, indicating a risk-on environment where gold loses its safe-haven appeal.
Geopolitical de-escalation, even temporary, could also fuel a bearish move. If tensions in the Middle East ease or if major global powers de-escalate diplomatic standoffs, the demand for gold as a hedge against uncertainty would diminish. News regarding potential price caps on fuel, like Germany's recent legislation, could also indirectly influence gold by suggesting a move towards stabilizing energy markets, which are often correlated with inflation and, by extension, gold prices. However, the current Brent crude oil price at $101.25 and WTI at $92.80, both showing daily declines, suggest that energy markets are also experiencing some pullback, which might not immediately translate into a strong bearish signal for gold.
The Waiting Game: Gold Caught in a Range?
It's entirely plausible that gold remains range-bound in the short to medium term. The conflicting signals from various timeframes and the push-and-pull between geopolitical risk and dollar strength create an environment ripe for consolidation. The 1-hour chart shows a neutral trend with strong power (88%), while the 4-hour is neutral (50% power) and the daily is also neutral (50% power). This suggests a lack of clear direction across all timeframes simultaneously.
A range-bound scenario typically occurs when market participants are waiting for a significant catalyst – either a major geopolitical event, a clear direction from central banks (like the Federal Reserve or the European Central Bank), or a decisive economic data release. The current ADX readings across different timeframes (25.08 on 1H, 46.15 on 4H, 13.43 on 1D) are particularly telling. The strong ADX on the 4-hour chart indicates a robust trend is present, but the weak ADX on the daily suggests a lack of broader commitment. This could mean that the current price action is more of a temporary pause within a larger trend, or it could be the precursor to a significant move once a catalyst emerges.
The price action around $4,991.55 is key. If gold fails to break decisively above $5,002.26 resistance, or conversely, fails to hold the $4,985.86 support, we could see gold trading sideways for an extended period. This would be characterized by lower trading volumes and a lack of clear directional bias on longer timeframes. Such a phase often precedes a significant breakout, as underlying pressures build. Traders looking for clearer signals might need to wait for a confirmed break of either the key support or resistance levels, or for a significant shift in the macroeconomic or geopolitical landscape.
The Most Likely Scenario and What to Watch
Given the current data, the most likely scenario in the immediate short term (next 24-48 hours) leans towards continued consolidation with a slight bearish bias, driven by the mixed technical signals and the prevailing dollar strength. The 1-hour and 4-hour charts show significant selling pressure, with multiple indicators suggesting a move lower. However, the daily chart's oversold Stochastic and weak ADX prevent a strong conviction bearish call. A probability of around 55% for a bearish tilt or range-bound trading seems appropriate, with a 45% chance of a bullish reversal if geopolitical events intensify or the dollar weakens significantly.
The key levels to watch are the 1-hour support at $4,985.86 and resistance at $5,002.26. A breach of either will likely dictate the next short-term move. The broader trend still holds potential for upside if longer-term bullish drivers reassert themselves, but the immediate technical picture suggests caution. Traders should be mindful of the DXY's movement; a sustained push above 99.50 would likely add pressure on gold, while a drop below 99.00 could offer some relief.
Bullish Scenario: Breaking the Chains
45% ProbabilityBearish Scenario: Downside Pressure Mounts
55% ProbabilityMarket Movers and Macro View
The global economic landscape remains a significant influence on gold prices. While geopolitical tensions are a constant backdrop, providing underlying support, the actions and rhetoric of major central banks are currently dictating the short-term price action. The Federal Reserve's stance on interest rates, in particular, is crucial. Traders are closely scrutinizing Fed officials' statements for any hints about the timing and pace of potential rate cuts. Currently, Fed Fund Futures suggest a mixed outlook, with probabilities fluctuating daily. Any indication of a more hawkish stance – suggesting rates might stay higher for longer – would likely strengthen the dollar and put downward pressure on gold. Conversely, signals of an impending pivot towards easing could weaken the dollar and boost gold prices.
The recent news about Germany capping fuel prices, while specific to the energy sector, hints at broader efforts by governments to manage inflationary pressures. Stable or falling energy prices can reduce inflation expectations, potentially lessening the appeal of gold as an inflation hedge. However, the ongoing conflicts and supply chain vulnerabilities mean that energy prices remain susceptible to sudden spikes. The current declines in Brent and WTI crude oil are noteworthy but should be viewed against the backdrop of persistent supply risks. Any renewed escalation in energy markets would likely send gold prices higher, irrespective of other factors.
Correlation analysis is vital here. The DXY's current upward momentum, trading around 99.31, is a significant headwind. Historically, a strong dollar often correlates with lower gold prices, as it increases the cost of gold for international buyers. The S&P 500 and Nasdaq are currently showing strength, indicating a risk-on sentiment. This typically works against gold, as investors favor riskier assets over safe havens during such periods. However, if this risk-on sentiment falters and equities begin to decline, we could see a rotation back into gold, especially if geopolitical fears intensify. The divergence between equities and gold is a key theme to monitor this week.
Upcoming Economic Events: Be aware of upcoming central bank communications and key economic data releases this week. Unexpected inflation figures or hawkish policy shifts could trigger significant volatility in gold and currency markets. Always manage your risk exposure accordingly.
The recent tumble in silver, down nearly 2% despite a weaker dollar and falling yields, is also an interesting data point. This suggests that the precious metals complex might be experiencing some internal weakness or is particularly sensitive to specific market flows not immediately apparent. While gold and silver often move in tandem, silver's sharper move could indicate that speculative positions are being unwound more aggressively in the white metal, potentially foreshadowing similar moves in gold if the broader bearish sentiment takes hold.
| Indicator | Value | Signal | Interpretation |
|---|---|---|---|
| RSI (14) | 41.18 | Neutral | Slight downward bias, watch for oversold conditions |
| MACD Histogram | -15.20 | Negative | Seller momentum is building |
| Stochastic (%K/%D) | 18.31 / 45.15 | Oversold | Potential for bounce, but trend is down |
| ADX | 25.08 | Strong Trend | Confirms downtrend on 1H, but daily ADX is weak |
| Bollinger Bands | Middle Band | Below MB | Price is below the middle band, indicating bearish pressure |
The Path Forward: What to Watch
Looking ahead, the price action around $4,991.55 will be critical. The immediate focus will be on whether gold can hold the $4,985.86 support level. A failure here could accelerate a move lower, targeting the daily support at $4,971.11. Conversely, a decisive break above $5,002.26 resistance, especially if accompanied by dollar weakness or escalating geopolitical news, could pave the way for a test of higher levels, potentially reaching $5,041.99.
Traders should pay close attention to the DXY. If it continues its upward trend, breaking through 99.50, gold may struggle to find upside momentum. Conversely, a DXY pullback below 99.00 could provide a tailwind. Furthermore, the equity markets (S&P 500 and Nasdaq) will be watched closely. A continued rally in stocks might suppress gold, but any sign of weakness or a shift to risk-off sentiment could trigger safe-haven flows into the precious metal.
The narrative around central bank policy, particularly from the Federal Reserve, remains a dominant theme. Any hints of a more dovish stance could be a significant catalyst for gold. Given the current technical indecision and the conflicting macroeconomic drivers, patience is likely the best strategy for now. Waiting for a clear breakout confirmation above resistance or a decisive breakdown below support will be crucial for establishing well-defined trading positions. The market is currently in a delicate balance, and it will likely take a significant event to break this stalemate.
Frequently Asked Questions: XAUUSD Analysis
What happens if XAUUSD breaks decisively below the $4,985.86 support level?
A break below $4,985.86 on the 1-hour chart would likely trigger further selling pressure, targeting the daily support at $4,971.11. This scenario is more probable if the DXY strengthens significantly or geopolitical tensions ease.
Should I buy XAUUSD at current levels near $4,991.55 given the oversold Stochastic?
While the Stochastic oscillator is oversold, other indicators like RSI and MACD show a bearish lean on shorter timeframes. A buy at current levels would be contrarian and risky; a confirmed break above $5,002.26 resistance would offer a more robust entry signal with higher probability.
Is the RSI at 41.18 a sell signal for XAUUSD right now?
An RSI of 41.18 is in neutral territory but shows a downward trend, suggesting a slight bearish bias on the 1-hour chart. It's not a direct sell signal on its own but indicates that the momentum is not in favor of buyers at this moment.
How will potential Fed rate cut expectations affect XAUUSD this week?
Expectations of earlier or more aggressive Fed rate cuts would likely weaken the US Dollar and boost gold prices, potentially pushing XAUUSD above $5,000. Conversely, signals of higher-for-longer rates would strengthen the dollar and pressure gold downwards.
Track markets in real-time
AI-powered analysis, technical indicators and real-time price data.
Join Our Telegram Channel
Breaking market news, AI analysis and trading signals instantly.
Join Channel