The geopolitical stage is set for significant market moves, with former President Trump's upcoming speech acting as a focal point for traders. Against this backdrop, gold (XAUUSD) is currently testing critical resistance near the $4,540 level. This price action is occurring amidst a complex interplay of factors, including persistent geopolitical tensions, shifting central bank expectations, and the ever-present influence of the US Dollar Index (DXY). Understanding these cross-market dynamics is crucial for navigating the current choppy waters.
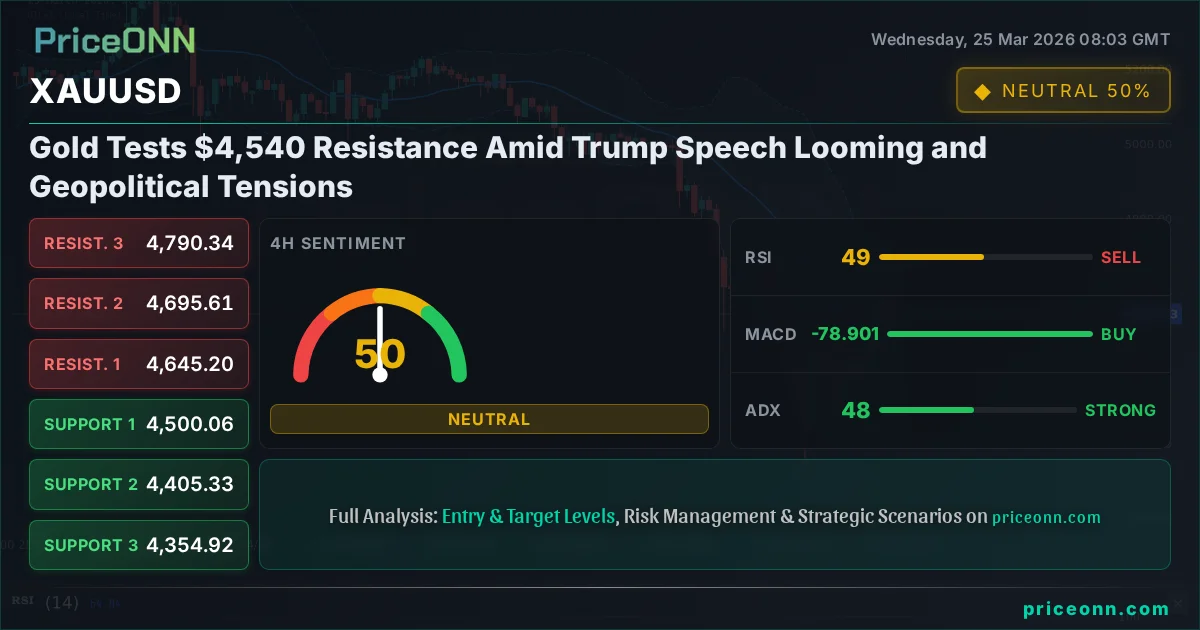
- XAUUSD is testing resistance at $4,556.97, with the immediate price holding at $4,540.40 amidst mixed signals.
- The US Dollar Index (DXY) is showing strength around 99.15, potentially capping gold's upside.
- Geopolitical uncertainty remains a key driver, supporting safe-haven demand for gold despite a strong dollar.
- Traders are closely watching the 1-hour trend indicators, which show a bullish bias (Al: 6, Sat: 2), contrasting with the daily trend's bearish outlook (Al: 2, Sat: 6).
The Trump Factor and Market Uncertainty
Former President Trump's public statements have historically been catalysts for significant market volatility, particularly in assets sensitive to geopolitical risk and economic policy shifts. His upcoming speech is expected to provide insights into potential future economic and foreign policy directions, creating a cloud of uncertainty that often benefits safe-haven assets like gold. The market is on edge, anticipating any signals that could influence inflation expectations, trade relations, or Federal Reserve policy. This anticipation itself can drive price action as traders position themselves ahead of potential market-moving news. The current price of XAUUSD at $4,540.40 reflects this delicate balance between established technical levels and the unpredictable nature of political rhetoric. The 1-hour chart shows a bullish trend with a strength of 86%, but the daily chart paints a starkly different picture, indicating a strong bearish trend with 94% strength. This divergence highlights the immediate uncertainty traders are grappling with.
The market's reaction to such events is often swift and decisive. A hawkish tone from Trump regarding trade or fiscal policy could strengthen the dollar and pressure gold, while any rhetoric suggesting a more dovish approach to economic management or a de-escalation of geopolitical tensions might see gold prices climb further. The critical resistance level at $4,556.97 on the 1-hour chart is the immediate hurdle. A sustained break above this could signal short-term bullish momentum, but a failure to do so might invite sellers back into the market, aligning with the broader bearish sentiment seen on the daily timeframe. The ADX on the 1-hour chart at 21.46 suggests a moderately trending market, while the daily ADX at 27.45 indicates a stronger downward trend. This suggests that while there's upward pressure in the short term, the longer-term picture remains challenging for gold.
Gold's Tug-of-War: Inflation Hedge vs. Strong Dollar
Gold has long been considered a hedge against inflation and a store of value during times of economic uncertainty. Currently, with inflation remaining a persistent concern in various economies, gold's appeal as a safe-haven asset is amplified. The rising oil prices, as indicated by WTI at $88.85 and Brent at $99.38, contribute to these inflation concerns. Higher energy costs can ripple through the economy, increasing production costs and consumer prices, which historically supports gold's upward trajectory. However, this narrative is being challenged by the strength of the US Dollar Index (DXY), which is currently trading around 99.15. A stronger dollar typically makes dollar-denominated assets like gold more expensive for holders of other currencies, potentially dampening demand. The DXY's 1-hour trend shows a bullish signal (Al: 7, Sat: 1), and its 4-hour trend is also leaning bullish (Al: 6, Sat: 2), indicating dollar strength is a significant headwind for gold.
The interplay between inflation hedges and currency strength creates a complex environment for gold traders. While geopolitical risks and inflation fears are pushing gold prices higher, the firming dollar is acting as a significant counterforce. On the 1-hour chart, gold's RSI is at 60.04, suggesting it's in neutral territory but with an upward bias, indicating buyers are still active. However, the Stochastic indicator on the same timeframe is flashing a bearish signal (%K
The conflicting signals across different timeframes for XAUUSD highlight significant short-term volatility. Traders should exercise caution, as a break below the 1-hour support at $4,533.22 could accelerate declines, while a sustained push above $4,556.97 might trigger a short-covering rally.
Intermarket Dynamics: Equities, Bonds, and Gold's Correlation
Gold's price action cannot be viewed in isolation. Its correlation with major risk assets like the S&P 500 (currently at 6606.8) and Nasdaq 100 (at 24206.13) provides crucial context. Both indices are showing mixed signals, with the 1-hour and 4-hour charts suggesting some bullishness, but the daily charts indicating a strong bearish trend. This risk-off sentiment in equities, particularly the bearish daily trend for both SP500 and Nasdaq, typically increases demand for safe-haven assets like gold. However, the concurrent strength in the US Dollar adds a layer of complexity. Typically, a strong dollar and falling equities would be a strong tailwind for gold. The fact that gold is only managing to test resistance rather than surge higher suggests that the dollar's strength is a dominant factor currently.
Treasury yields also play a role, though specific yield data is not provided. Generally, rising yields can increase the opportunity cost of holding non-yielding assets like gold, putting downward pressure on its price. Conversely, falling yields or fears of economic slowdown can boost gold. The current market sentiment, characterized by geopolitical uncertainty and potential shifts in monetary policy, often leads to a flight to quality, which can benefit both gold and US Treasuries. The divergence between the short-term bullish indicators for gold and the prevailing bearish trends on the daily charts for major US indices suggests that the market is in a state of flux. The ADX on the daily timeframe for XAUUSD is 27.45, indicating a moderately strong downtrend, which means any upside moves might be temporary unless key resistance levels are decisively broken. The support levels at $4,533.22 and $4,521.19 on the 1-hour chart are crucial for bulls to defend.
When indicators conflict across timeframes, it often signals a period of consolidation or a potential trend reversal. Wait for a clear breakout or breakdown confirmed by volume and multiple indicators before committing to a trade.
Navigating the Technical Landscape: Levels and Signals
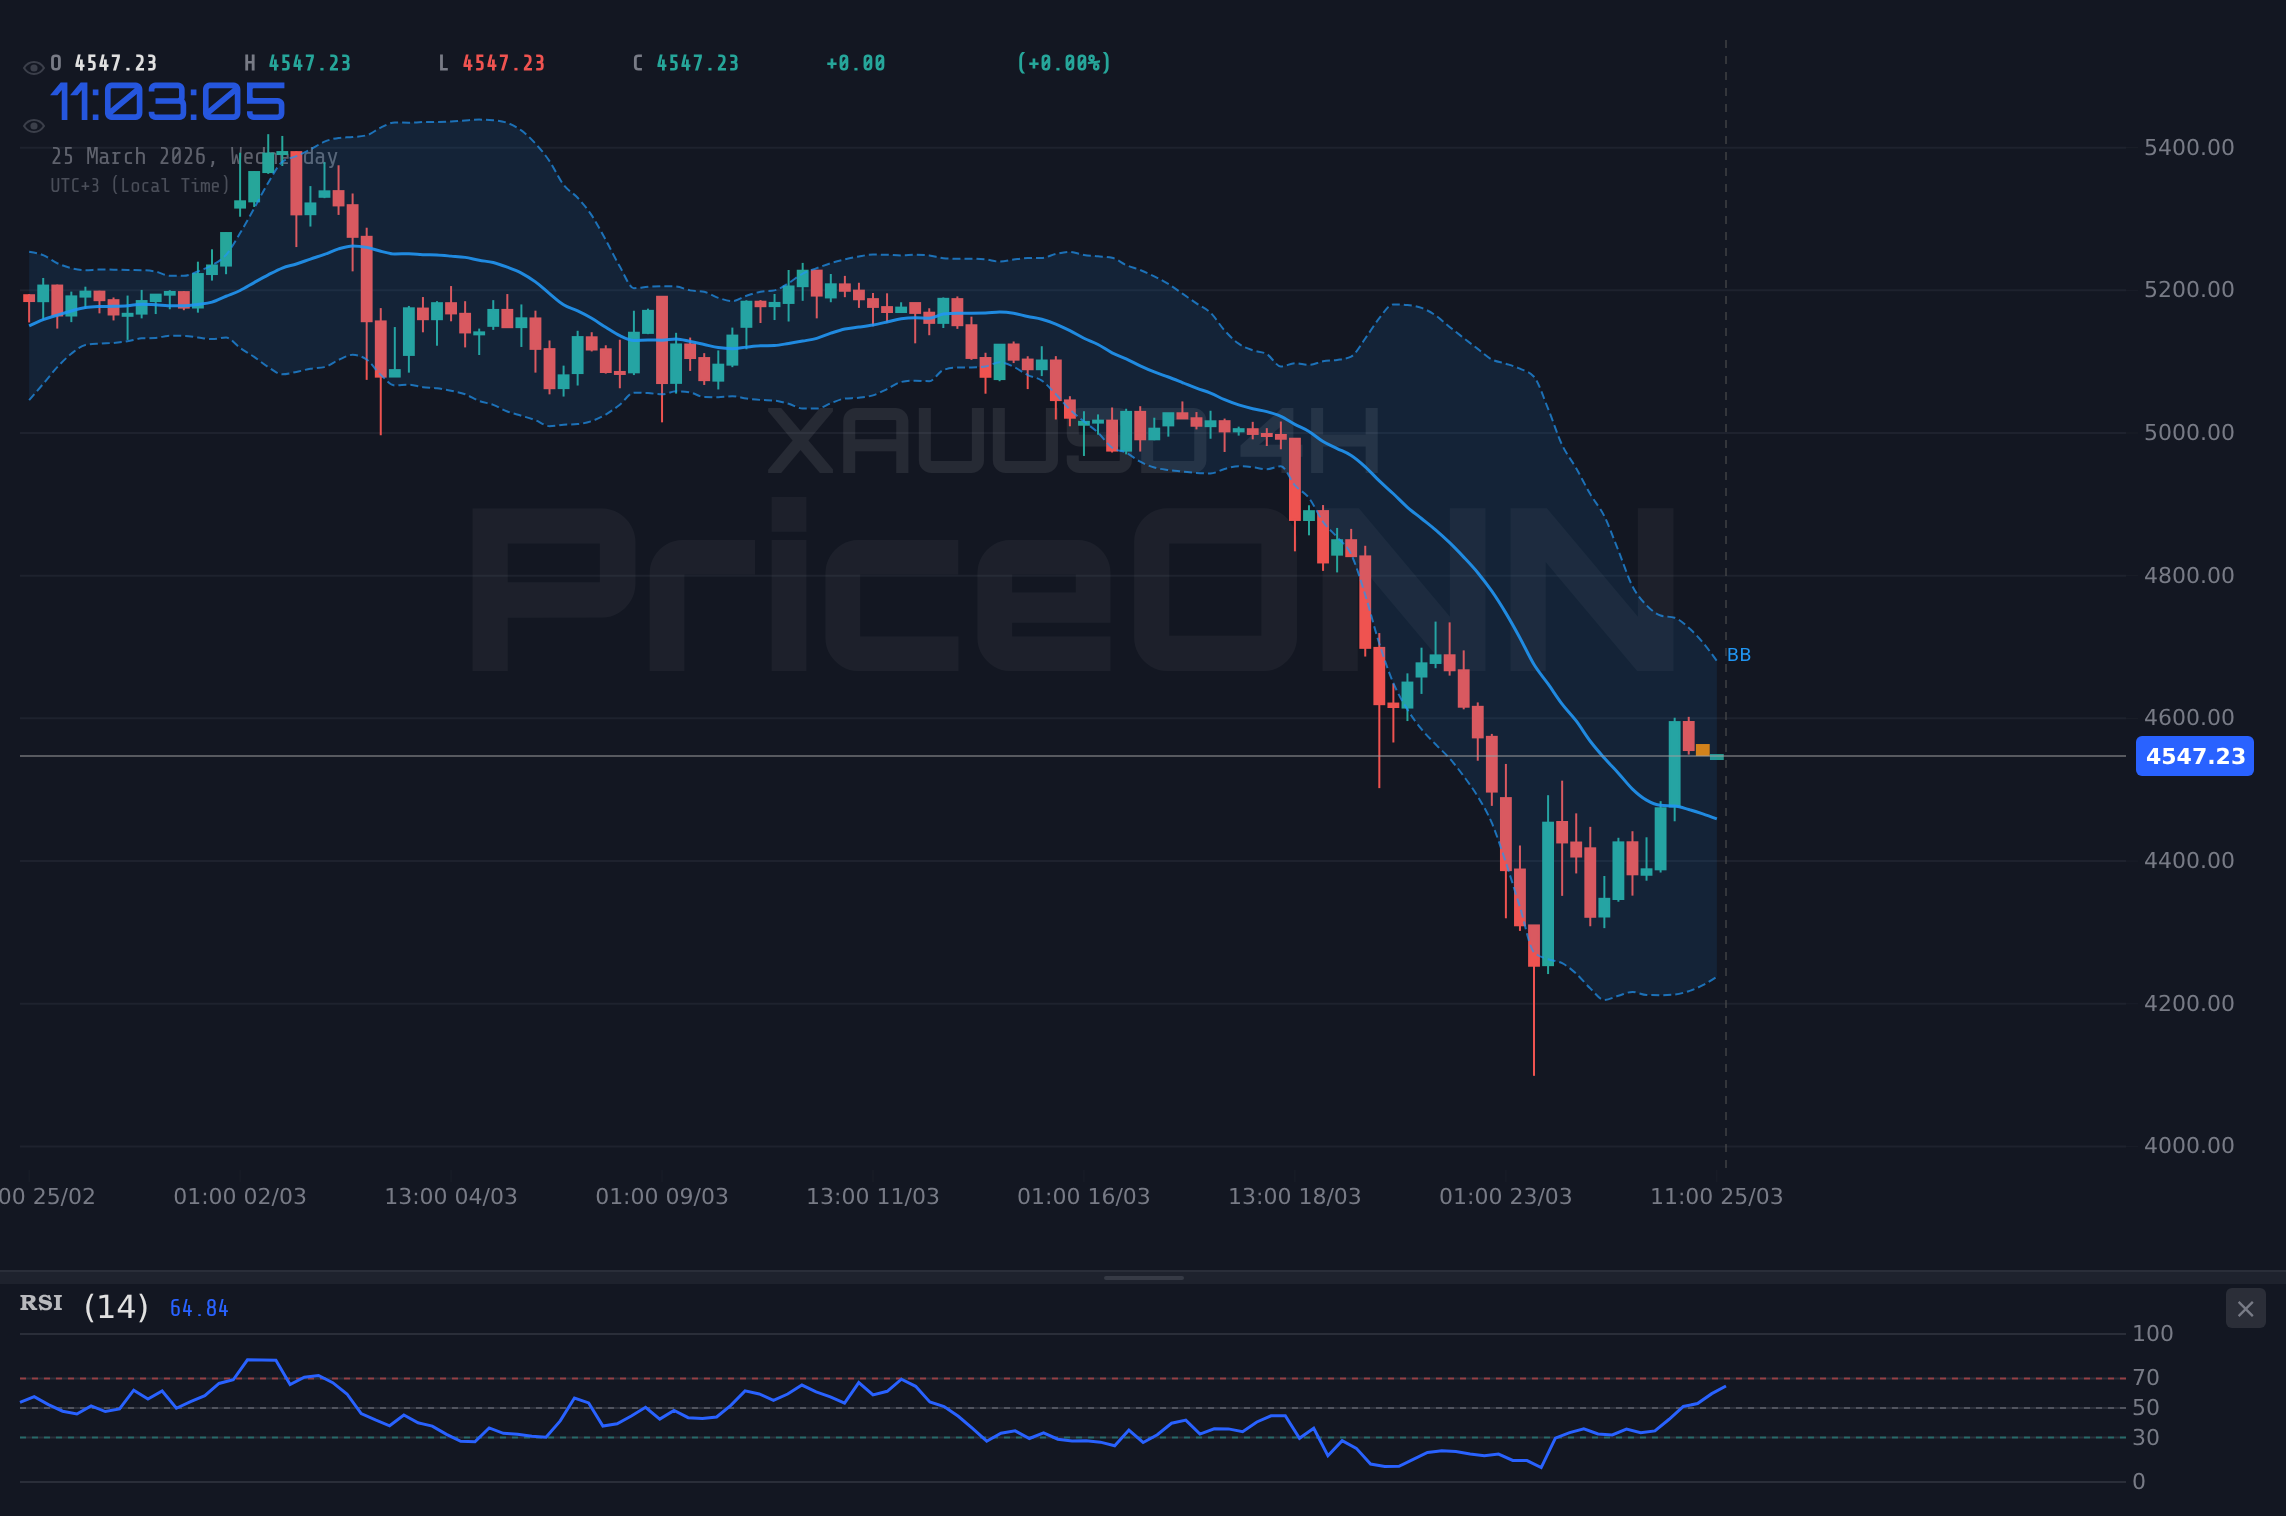
Looking at the technicals, the 1-hour timeframe for XAUUSD presents a near-term bullish picture. The trend is strong (86% strength), with the price trading above the middle Bollinger Band and MACD showing positive momentum. The RSI at 60.04 is in neutral territory with an upward bias. However, the Stochastic indicator flashing a bearish divergence (%K
The 4-hour timeframe offers a more neutral perspective, with trend strength at 50%. While MACD and Stochastic show positive signals, the RSI at 48.89 leans towards a bearish trend, and the ADX at 47.56 indicates a strong downtrend. This suggests that the short-term bullishness might be a counter-trend move within a larger bearish structure. Key support on this timeframe lies at $4,500.06, $4,405.33, and $4,354.92. The daily chart, however, paints a decidedly bearish picture. The trend strength is 94% bearish, with RSI at 35.13, negative MACD momentum, and the price trading below the middle Bollinger Band. The daily ADX at 27.45 confirms a strong downtrend. This significant divergence between the 1-hour and daily charts underscores the critical nature of the current price action around $4,540.40. The market is essentially caught between short-term optimism and longer-term pessimism.
The stark contrast between the 1-hour bullish signals and the daily bearish trends for XAUUSD suggests that the current move is likely a retracement within a larger downtrend, or a consolidation phase before a significant move. The $4,556.97 resistance is the immediate battleground.
Economic Calendar and Upcoming Catalysts
The economic calendar for the upcoming week, while not featuring major event risks like NFP or CPI today, still holds potential catalysts. The provided data shows several USD-denominated events with previous actuals and forecasts. For instance, a USD event on an unspecified date had an actual reading of 52.4 against a forecast of 51.5, indicating a stronger-than-expected performance. Another USD event showed an actual of 51.1 versus a forecast of 52, suggesting a slight miss. These subtle deviations can influence currency markets and, by extension, gold. More significantly, the upcoming speech by former President Trump could overshadow much of the scheduled economic data, depending on its content. Any pronouncements on trade policy, particularly concerning China or the EU, could trigger significant risk-off or risk-on sentiment, directly impacting gold.
Furthermore, the ongoing geopolitical narratives, such as the situation in the Middle East and the broader global economic outlook, continue to provide a backdrop for safe-haven demand. While specific high-impact events like FOMC or CPI are not listed for today, the market remains sensitive to any news that could alter the inflation outlook or central bank policy trajectory. The recent surge in oil prices, with WTI at $88.85 and Brent at $99.38, adds to the inflationary narrative, which is generally supportive of gold. However, the Fed's stance on inflation and interest rates remains a key determinant. If the Fed signals a continued hawkish stance, it could reinforce dollar strength and cap gold's gains, even amidst geopolitical uncertainty. Traders will be scrutinizing any subtle cues from economic data releases and political statements for direction.
“The market is a giant washing machine. Put your money in, round and round it goes, and it comes out cleaner.” – Joe Rogan (adapted for trading)
Scenario Analysis: Charting Potential Paths for XAUUSD
Given the conflicting signals and the high degree of uncertainty surrounding geopolitical events and central bank policy, a scenario-based approach is prudent. The current price of $4,540.40 for XAUUSD places it at a critical juncture, testing short-term resistance ($4,556.97) while still being well below longer-term support levels. The strength of the DXY around 99.15 and the bearish daily trend for major indices like the SP500 and Nasdaq also weigh on the yellow metal.
Bearish Scenario: Retreat to Support
65% ProbabilityConsolidation Scenario: Choppy Trading
25% ProbabilityBullish Scenario: Resistance Breakout
10% ProbabilityFAQ Section: Addressing Your XAUUSD Queries
Frequently Asked Questions: XAUUSD Analysis
What happens if XAUUSD breaks above the $4,556.97 resistance level?
A sustained break above $4,556.97, confirmed by strong volume and positive momentum across multiple timeframes, could signal a short-term bullish move. The immediate target would be $4,568.69, with a secondary target at $4,580.72. However, given the daily bearish trend, this move might face significant headwinds.
Should I buy XAUUSD at current levels near $4,540.40 given the mixed technical signals?
Buying at current levels requires caution due to conflicting indicators and the looming geopolitical event. A high-probability setup would involve waiting for confirmation: either a break above $4,556.97 with bullish follow-through, or a clear retest of support near $4,533.22. The risk-reward ratio is currently unfavorable for a decisive entry.
Is the RSI at 60.04 a sell signal for XAUUSD today?
An RSI of 60.04 on the 1-hour chart is considered neutral territory with a slight upward bias. While not an immediate sell signal, it suggests that the bullish momentum might be moderating. The key is to watch for divergence (like the current Stochastic bearish signal) or a move towards overbought territory (above 70) on shorter timeframes, which could precede a pullback.
How might former President Trump's speech affect XAUUSD price action this week?
Trump's speech could be a major catalyst. Depending on his comments regarding trade, economic policy, or geopolitical relations, we could see a significant move in XAUUSD. Hawkish statements might pressure gold lower towards $4,500, while dovish or de-escalating rhetoric could fuel a rally towards $4,580 or higher, especially if it weakens the dollar.
The path forward for gold remains complex, dictated by the delicate balance between geopolitical drivers, inflation concerns, and the strength of the US dollar. While short-term indicators offer some bullish signals, the longer-term technical picture and the looming uncertainty from political events suggest caution. Traders must remain vigilant, focusing on key support and resistance levels, and adapting their strategies as new information unfolds. Patience and disciplined risk management are paramount in navigating these volatile conditions.
| Indicator | Value | Signal | Interpretation |
|---|---|---|---|
| RSI (14) | 60.04 | Neutral | Nearing overbought on 1H, but bearish on daily. |
| MACD Histogram | Positive | Bullish | Positive momentum on 1H, but daily shows negative momentum. |
| Stochastic | K=63.62, D=82.6 | Bearish Divergence | Bearish signal on 1H (%K |
| ADX | 21.46 | Moderate Trend | Moderate trend strength on 1H, strong downtrend on Daily (27.45). |
| Bollinger | Middle Band | Above Band | Price above middle band on 1H and 4H, below on Daily. |
Track markets in real-time
AI-powered analysis, technical indicators and real-time price data.
Join Our Telegram Channel
Breaking market news, AI analysis and trading signals instantly.
Join Channel