Gold is currently hovering around $4,553.40, a critical juncture as it approaches the significant resistance level of $4,595.32. The precious metal has seen a remarkable surge, climbing 3.34% today, driven by a complex interplay of escalating geopolitical tensions and fluctuating risk appetite across global markets. This upward momentum, while strong on shorter timeframes, faces a stern test at higher levels, where a confluence of technical indicators and potential macro shifts could dictate its next major move. Understanding the nuances of these competing forces is paramount for any trader looking to navigate the volatile gold market.
- XAUUSD is trading at $4,553.40, approaching resistance at $4,595.32.
- Geopolitical tensions and a rising DXY are key drivers influencing gold prices.
- RSI at 67.66 on the 1H chart indicates strong bullish momentum, but ADX at 14.86 suggests a weak trend overall.
- The 1D chart shows a neutral trend with RSI at 35.52, signalling potential downside risk despite short-term strength.
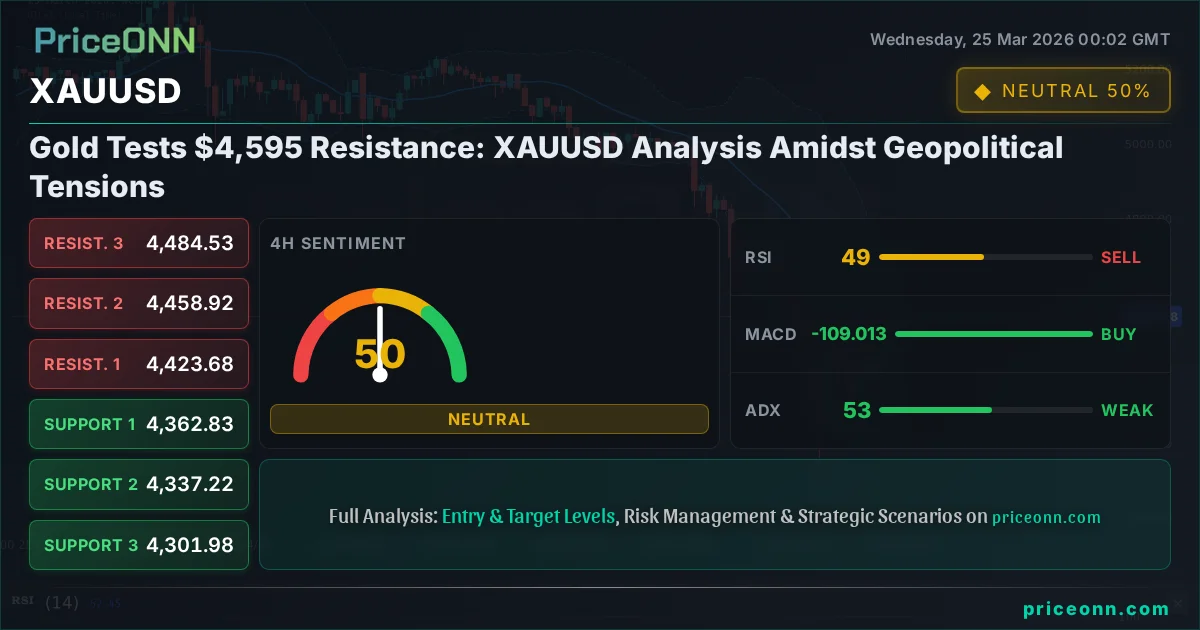
- Key levels to watch: Support at $4,465.17, Resistance at $4,595.32.
Navigating the Gold Rally: A Technical Deep Dive
The 1H Chart: Momentum Building, But Trend Weak
On the 1-hour timeframe, gold is exhibiting strong bullish signals. The price is comfortably above the $4,553.40 mark, with support identified at $4,465.17 and $4,445.94. The RSI(14) is sitting at 67.66, firmly in neutral territory but showing an upward inclination, suggesting buyers are active. MACD is also in positive territory, trading above its signal line, which typically indicates increasing bullish momentum. The Stochastic Oscillator is particularly noteworthy, with the %K line at 97.39 and the %D line at 67.09, signalling an extremely overbought condition and a strong bullish bias, though potentially indicating a short-term reversal is nearing. However, the ADX at 14.86 is a significant caveat; this low reading suggests a weak trend, meaning the current upward move might lack conviction and could be susceptible to sharp reversals. The overall signal on this timeframe is 'BUY' (7 Buy, 1 Sell, 0 Neutral), reflecting the short-term strength, but the low ADX tempers this enthusiasm.
The 4H Chart: A Mixed Picture with Conflicting Signals
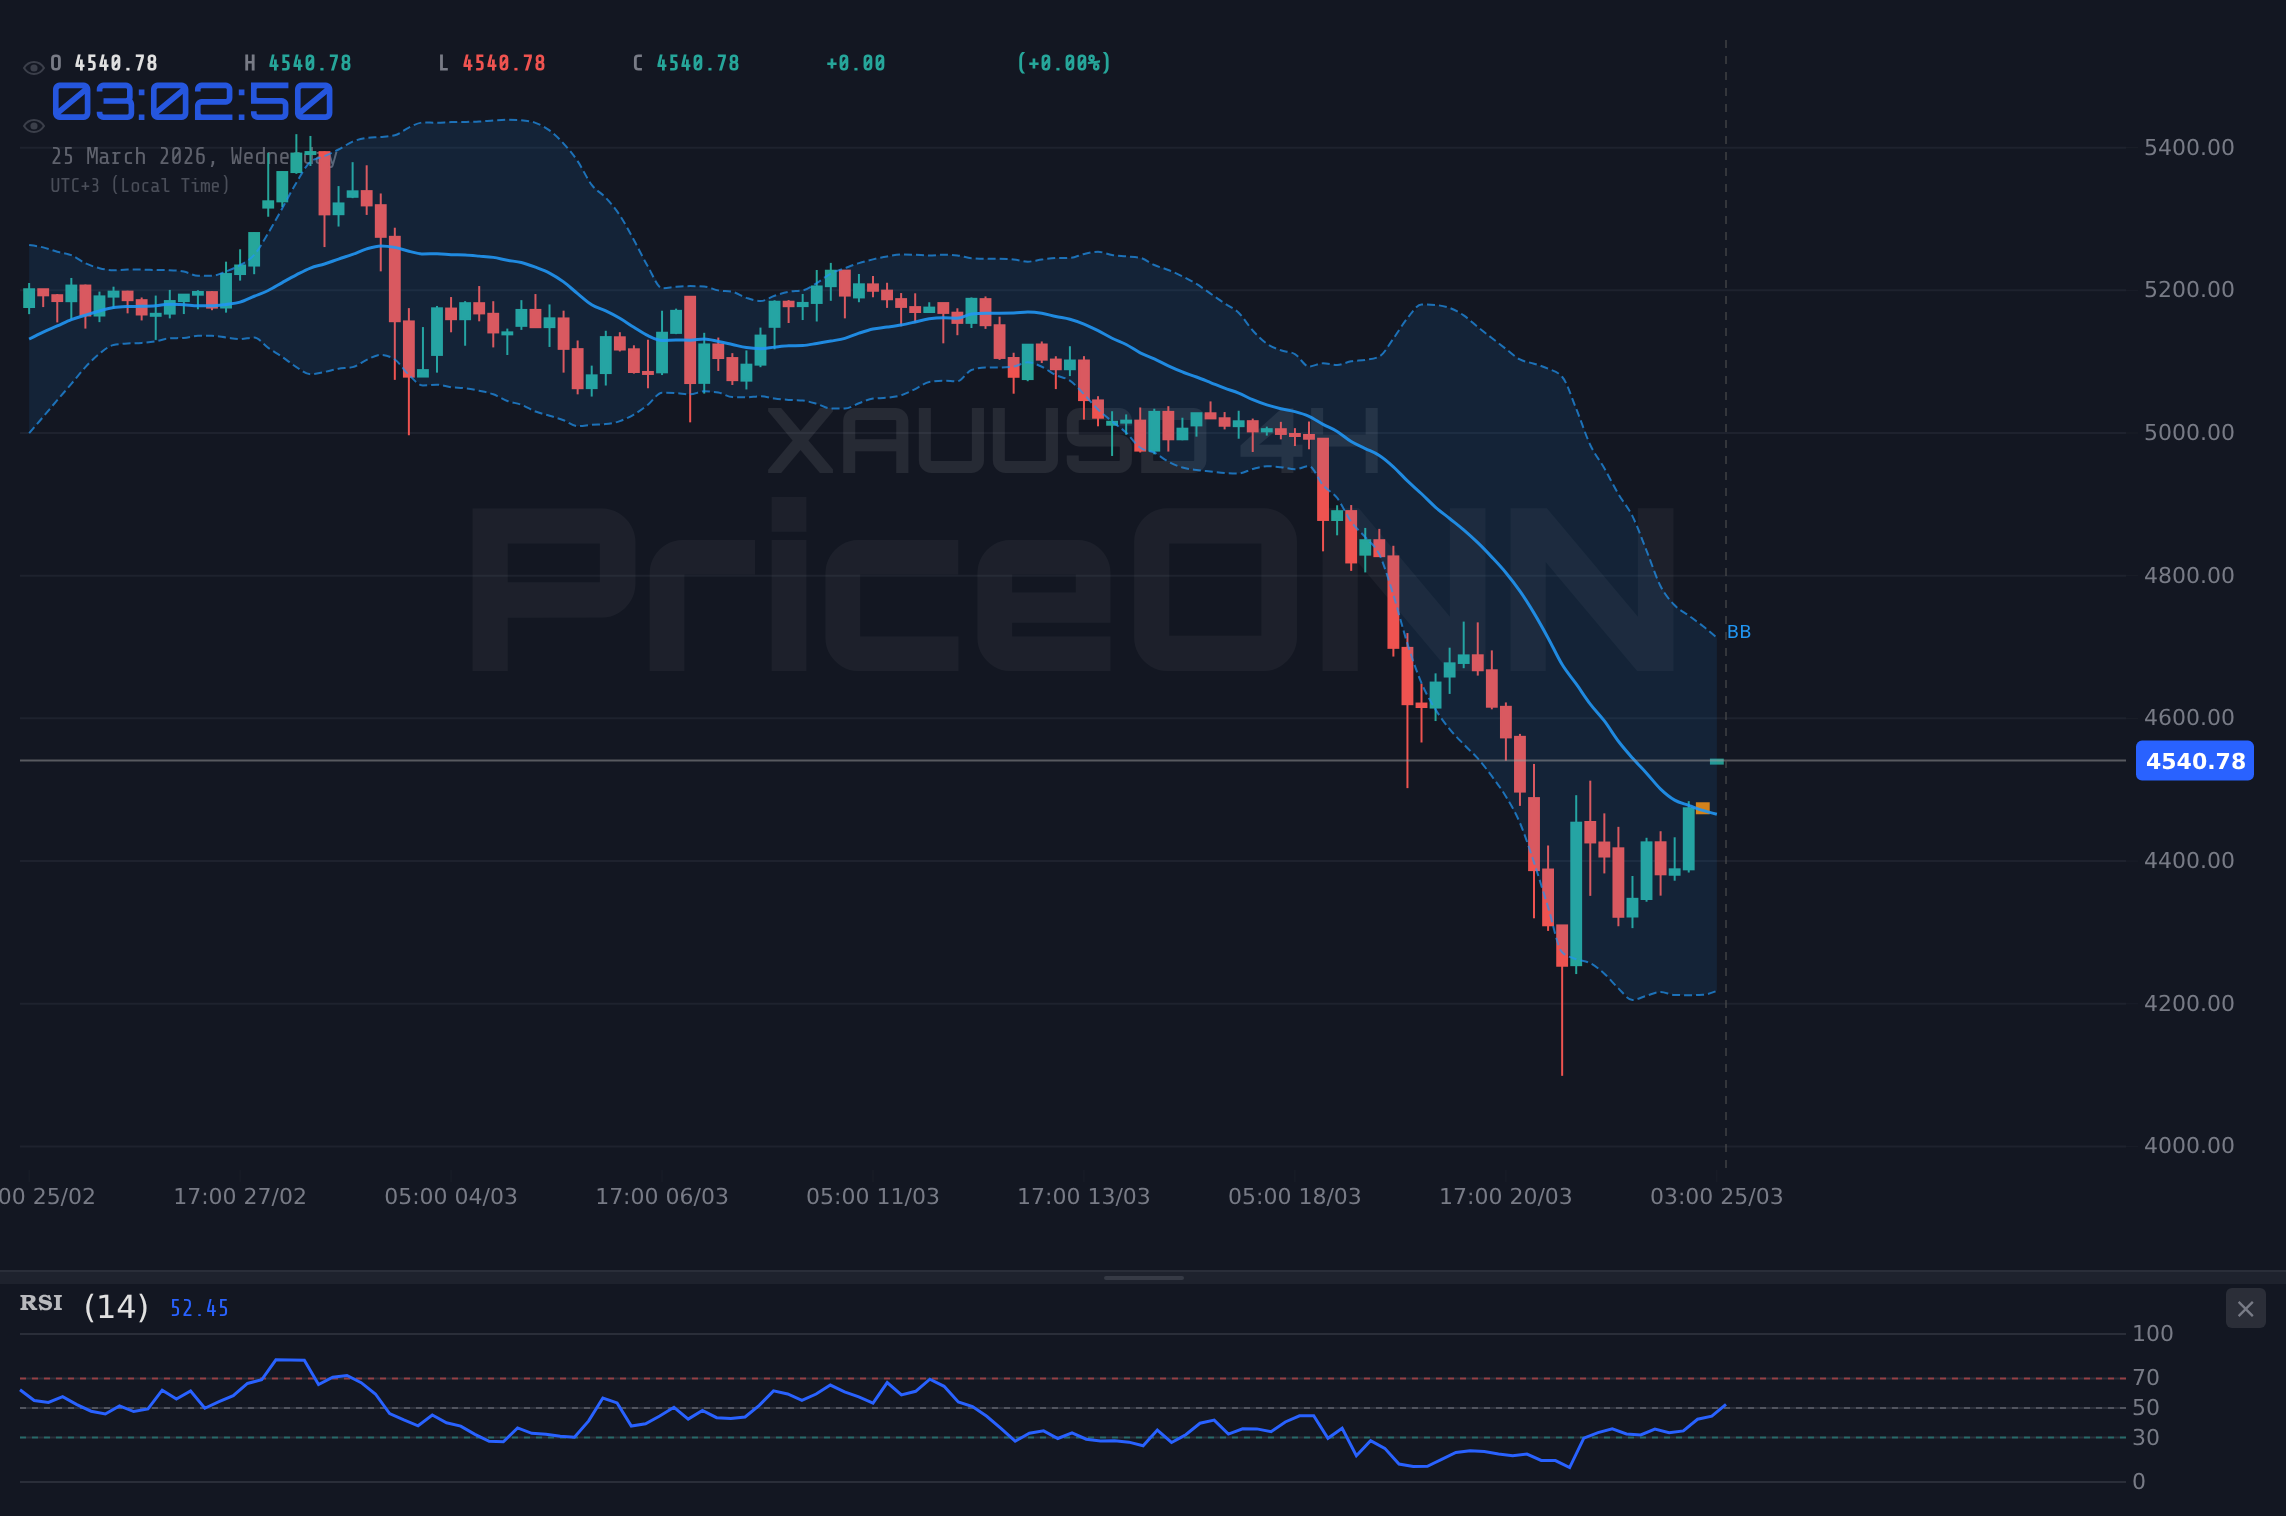
Shifting to the 4-hour chart, the picture becomes more complex. The trend is currently neutral, with a 50% strength rating. Support levels are found at $4,362.83 and $4,337.22, while resistance lies at $4,423.68 and $4,458.92. The RSI(14) is at 49.5, hovering around the midpoint and showing a slight downward trend, which contrasts with the 1-hour bullishness. MACD remains positive, still above its signal line, but the Bollinger Bands are showing the price trading above the middle band, hinting at a potential upward move, though not extreme. Stochastic is also in bullish territory (%K at 79.41, %D at 61.5), still favouring buyers. The most striking indicator here is the ADX, which stands at a very strong 53.2, indicating a powerful trend. However, the 1D chart's ADX is 25.57, suggesting this 4H trend strength might be a function of recent volatility rather than a sustained directional move. The general signal here is 'BUY' (5 Buy, 3 Sell, 0 Neutral), but the divergence between RSI and Stochastic, coupled with the conflicting ADX readings across timeframes, suggests caution.
The Daily Chart: Underlying Weakness and Caution
Zooming out to the daily chart, the underlying weakness in XAUUSD becomes more apparent, despite the intraday rallies. The trend is classified as neutral, with only 50% strength, but the signals lean towards caution. Key support levels are significantly lower, at $4,158.15 and $3,909.96, while resistance is firmly placed at $4,595.32 and $4,784.30. The RSI(14) is at 35.52, deep in the oversold-leaning territory, and showing a downward trend. This suggests that while buyers might be stepping in at current levels, the broader sentiment on the daily scale is not yet convinced of a sustained recovery. MACD is in negative momentum, trading below its signal line, reinforcing the bearish sentiment on this longer timeframe. Bollinger Bands are also below the middle band, indicating a bearish bias. Stochastic, however, shows a bullish signal (%K at 23.86, %D at 13.84), indicating a potential rebound from oversold conditions. The ADX at 25.57 points to a moderately strong downtrend, contradicting the Stochastic's bullish signal and aligning more with the RSI and MACD readings. The overall signal on the daily chart is 'SELL' (2 Buy, 6 Sell, 0 Neutral), highlighting that the current price action might be a correction within a larger bearish trend.
Geopolitical Crosscurrents: Fueling Gold's Fire
Middle East Tensions and Oil's Influence
The surge in gold prices is intrinsically linked to the escalating geopolitical tensions, particularly in the Middle East. Reports of heightened US-Iran tensions and potential disruptions to oil passage through the Strait of Hormuz have sent Brent crude prices soaring over 3% to $98.25 and WTI crude futures climbing as well. This oil shock not only fuels inflation expectations - a traditional boon for gold - but also heightens overall market uncertainty. Gold, as a classic safe-haven asset, naturally benefits from such an environment. The news that Brent crude could potentially breach $110 per barrel underscores the gravity of the situation and the potential for further inflationary pressures, making gold an attractive hedge against these risks. The correlation between rising oil prices and gold's upward trajectory is a well-established phenomenon, and current market data suggests this relationship is firmly in play.
Dollar Strength and its Double-Edged Sword
Simultaneously, the US Dollar Index (DXY) has been strengthening, climbing towards 99.50, buoyed by rising Treasury yields and hawkish signals from the Federal Reserve. As per the data, DXY is currently at 98.98, showing a 0.21% daily gain. Historically, a stronger dollar tends to put downward pressure on gold prices, as they are often inversely correlated. However, in times of significant geopolitical risk, this relationship can weaken. Investors might be seeking the safety of both the dollar and gold, creating a scenario where both assets can rise concurrently, albeit at different paces. The DXY's daily chart shows a strong uptrend (ADX at 32.74), indicating its upward momentum is robust. This presents a complex dynamic for gold: while geopolitical fears drive demand for the yellow metal, the strengthening dollar acts as a counterweight. The market will be closely watching if the safe-haven demand for gold can overcome the headwinds from a stronger dollar.
Risk Appetite and Equity Market Concerns
Global equity markets are also painting a mixed picture. While the S&P 500 and Nasdaq 100 are showing modest gains on shorter timeframes (S&P 500 at 6602.05, Nasdaq at 24204.39), there are underlying concerns. News reports indicate that foreign investors have pulled a staggering $50.45 billion from key Asian equity markets in March, the largest outflow on record, sparking fears of a 2008-style crisis in the region. This decline in risk appetite globally could further bolster demand for safe-haven assets like gold. If the broader equity markets, particularly the US indices, begin to falter significantly, it could trigger a flight to safety, potentially sending gold prices even higher. The current data shows intraday gains in US equities, but the underlying sentiment, fueled by Asian market weakness and geopolitical uncertainty, suggests this could be fragile.
The Crucial Levels: Where Does Gold Go Next?
Resistance at $4,595: The Immediate Hurdle
The most immediate and significant technical level for XAUUSD is the resistance at $4,595.32. This level represents a crucial barrier that gold needs to overcome to sustain its bullish momentum. A decisive break and hold above $4,595.32 on the daily chart would signal a potential continuation of the rally, possibly targeting the next resistance at $4,784.30. The confluence of strong short-term buying signals (1H RSI, Stochastic) with the overarching geopolitical risk premium makes a test of this level highly probable. However, the weaker daily trend indicators (RSI 35.52, ADX 25.57) suggest that breaching this resistance might be challenging. Failure to break through could lead to a sharp pullback, with support at $4,494.20 and $4,504.00 on the 1-hour chart becoming the immediate areas to watch for potential bounces before a deeper correction.
Support at $4,465: The Line in the Sand
On the downside, the first significant support level to monitor is $4,465.17 on the 1-hour chart. A break below this level would indicate that the short-term bullish momentum is faltering. If gold prices decisively fall below $4,465.17, traders will look towards the next support at $4,445.94 and then $4,436.14. A close below the $4,400 psychological level could accelerate selling pressure, potentially invalidating the recent uptrend and signalling a move back towards the daily chart's neutral territory. The daily support at $4,158.15 remains a more significant long-term floor, but a break below $4,465 would be the first sign of a significant shift in sentiment.
Trade Scenarios: Mapping the Path Forward
Bearish Scenario: The Retreat
25% ProbabilityNeutral Scenario: Consolidation
40% ProbabilityBullish Scenario: The Breakout
35% ProbabilityAssessing the Probabilities: The Path of Least Resistance
Currently, the most probable scenario appears to be a period of consolidation or a slight pullback before any significant upward move. The neutral scenario holds a 40% probability, reflecting the conflicting signals across different timeframes and the immediate resistance hurdle. The bullish scenario, while enticing given the geopolitical backdrop, carries a 35% probability, contingent on a decisive break above $4,595.32 and sustained positive news flow. The bearish scenario, with a 25% probability, looms if gold fails to overcome immediate resistance and the broader market sentiment shifts unfavorably, perhaps due to a stronger dollar or easing geopolitical fears. The strong ADX on the 4-hour chart (53.2) suggests a trend is present, but its directionality is unclear without a clear break of key levels. The daily chart's weakness cannot be ignored, implying that any upside might be capped in the short term.
Economic Calendar and Macro Drivers: What's Next?
The Dollar Index and Fed Expectations
The US Dollar Index (DXY) is currently trading at 98.98, showing a daily increase. The 1D chart indicates a strong uptrend with an ADX of 32.74. This strength, fueled by hawkish Fed signals and rising Treasury yields, acts as a significant headwind for gold. Investors are pricing in the possibility of continued restrictive monetary policy from the Federal Reserve, which typically supports the dollar. Any hints of a more aggressive stance from Fed officials or unexpected strength in upcoming US economic data, such as the US ISM Manufacturing PMI (which came in at 52.4, slightly above forecast), could further bolster the dollar and put pressure on gold. Conversely, any signs of the Fed softening its stance or weakening US economic data could provide relief to gold prices.
Inflationary Pressures and Central Bank Watch
The ongoing geopolitical instability, particularly in the Middle East, continues to fuel inflation concerns. Rising oil prices ($99.65 for Brent, $89.35 for WTI) are a direct contributor to this. While gold is often seen as an inflation hedge, the central banks' response to persistent inflation remains a key factor. If inflation remains sticky, central banks might be forced to maintain higher interest rates for longer, which could eventually dampen demand for commodities like gold by increasing the opportunity cost of holding non-yielding assets. The market is keenly awaiting upcoming economic data releases, including any new insights into inflation trends from European and US data points. For instance, the upcoming GBP data releases (Manufacturing PMI, Industrial Production) will be watched for signs of economic resilience or weakness in the UK, which could impact GBPUSD and, by extension, global risk sentiment.
Key Takeaways for Traders
What to Watch This Week
The immediate focus for XAUUSD traders will be the price action around the $4,595.32 resistance level. A clear break above this level, supported by significant volume and positive geopolitical news or a softening dollar, could signal a move towards $4,784.30. Conversely, a failure to break higher and a subsequent move below $4,465.17 could trigger a short-term sell-off, potentially targeting $4,362.83. The interplay between geopolitical risks, dollar strength, and equity market sentiment will be crucial. Traders should also keep an eye on any significant shifts in central bank rhetoric, particularly from the Federal Reserve, as this could dramatically alter the macroeconomic landscape and impact gold's trajectory. Patience will be key; waiting for confirmation of a directional move is advisable given the conflicting signals across different timeframes.
Frequently Asked Questions: XAUUSD Analysis
What happens if XAUUSD breaks above $4,595.32 resistance with strong volume?
A decisive break above $4,595.32, especially with strong volume, would likely trigger further upside momentum. The bullish scenario suggests a target of $4,784.30, as this level represents the next significant resistance on the daily chart. This would indicate that the geopolitical risk premium is outweighing the dollar's strength.
Should I buy XAUUSD at current levels of $4,553.40 given the mixed signals?
Buying at current levels requires careful risk management. While short-term momentum is bullish, the daily chart shows underlying weakness. A more prudent approach might be to wait for a confirmed break above $4,595.32 or a pullback to support around $4,465.17, depending on your risk tolerance and trading strategy.
Is the RSI at 67.66 a sell signal for XAUUSD right now?
An RSI of 67.66 on the 1-hour chart indicates strong bullish momentum but is not yet in the extreme overbought territory that typically signals a sell. However, it suggests that the market is getting extended in the short term. Combined with the weak ADX, it warrants caution against chasing the price higher without further confirmation.
How will the rising DXY at 98.98 affect XAUUSD this week?
A rising DXY typically puts pressure on gold. With the DXY currently at 98.98 and showing a strong daily uptrend, it acts as a headwind for XAUUSD. However, strong geopolitical risk aversion can sometimes cause both assets to rise. Traders should monitor if gold can maintain its strength despite dollar appreciation, which would signal strong underlying demand.
Bearish Scenario: The Retreat
25% ProbabilityNeutral Scenario: Consolidation
40% ProbabilityBullish Scenario: The Breakout
35% Probability| Indicator | Value | Signal | Interpretation |
|---|---|---|---|
| RSI (14) | 67.66 | Neutral | Approaching overbought on 1H, but still in neutral zone. Daily RSI at 35.52 shows underlying weakness. |
| MACD Histogram | Positive Momentum | Bullish | Positive on 1H and 4H, but negative momentum on Daily. |
| Stochastic | K=97.39, D=67.09 | Bullish | Extreme overbought on 1H, signalling potential reversal. Daily Stochastic shows potential rebound from oversold. |
| ADX | 14.86 | Weak Trend | Suggests current move lacks conviction; breakout is not yet committed. 4H ADX at 53.2 shows strong trend, but direction unclear. |
| Bollinger Bands | Upper Band Break | Bullish | Price trading above upper band on 1H, signalling strength or potential overextension. |
The current technical landscape for XAUUSD presents a classic battleground scenario. Short-term momentum indicators are flashing bullish signals, driven by escalating geopolitical tensions and a general flight to safety. However, the longer-term daily chart reveals underlying weaknesses, with RSI and MACD suggesting that the current rally might be a bear market correction rather than the start of a new uptrend. The critical resistance at $4,595.32 will be the key determinant in the coming days. A failure to decisively break this level could see prices retreat towards the $4,465.17 support, potentially retesting lower ground. Conversely, a strong breakout above $4,595.32, fueled by sustained risk aversion and a weakening dollar, could open the door for a more significant move higher, targeting $4,784.30 and beyond. Traders are advised to exercise caution, manage risk diligently, and wait for clear confirmation of price direction before committing significant capital. The market is providing opportunities, but patience and discipline will be rewarded.
Track markets in real-time
AI-powered analysis, technical indicators and real-time price data.
Join Our Telegram Channel
Breaking market news, AI analysis and trading signals instantly.
Join Channel