Gold is currently trading at a critical juncture, hovering just below the $4,695.27 mark. The precious metal has seen a significant surge, driven by a complex interplay of geopolitical risks, persistent inflation concerns, and shifting central bank sentiment. As traders brace for Fed Chair Powell's upcoming speech, the market is awash with anticipation and a healthy dose of caution. This analysis delves into the technical underpinnings, fundamental drivers, and potential scenarios shaping the near-term outlook for XAUUSD, examining whether the current uptrend has the legs to continue or if a correction is on the horizon.
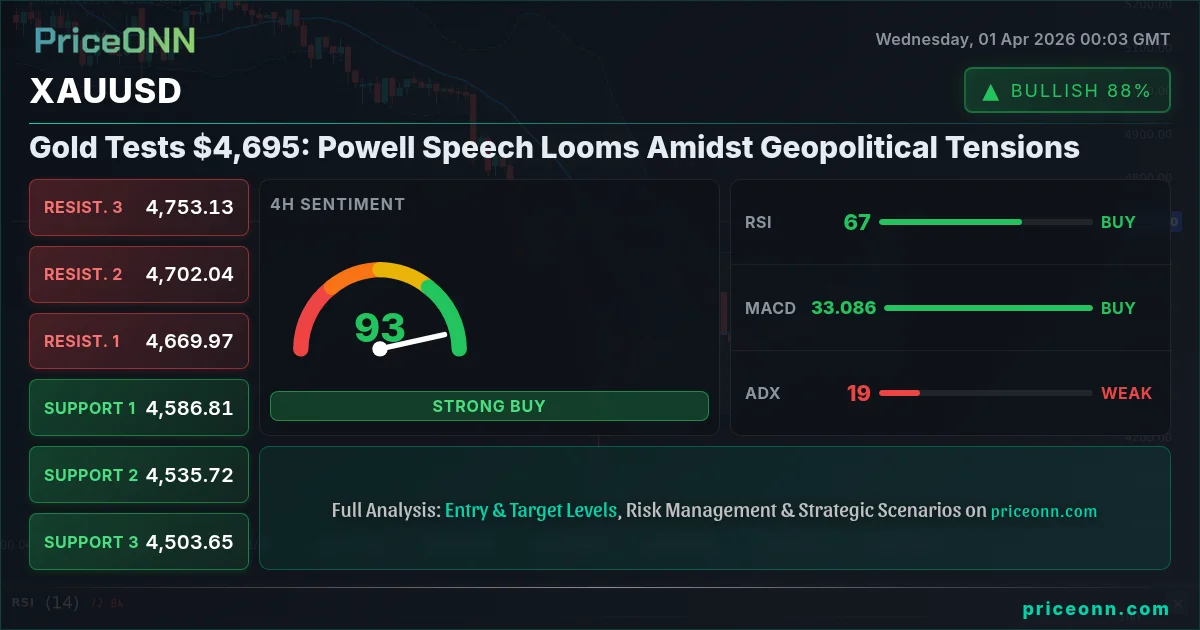
- XAUUSD currently trades at $4,695.27, with RSI at 67.36 signaling overbought pressure on the 1-hour chart, suggesting potential for near-term consolidation or a pullback.
- Critical resistance is forming around $4,730.93, while initial support is observed at $4,662.93. A break above resistance could target $4,753.13, whereas a slip below support might lead to $4,586.81.
- The MACD histogram on the 1-hour chart indicates positive momentum, but divergence on longer timeframes or overbought Stochastic readings suggest bulls may be losing steam.
- The strengthening US Dollar Index (DXY) near 99.53, coupled with mixed signals from equities like the S&P 500 (at 6546.45), adds a layer of complexity to gold's price action, highlighting correlation risks.
The Bull's Roadmap: Navigating Towards Higher Ground
The 1-hour technicals paint a decidedly bullish picture for gold, with the trend strength pegged at a robust 100%. The ADX at 37.47 confirms a strong upward momentum, and the RSI, while nearing overbought territory at 72.17, has not yet triggered a reversal. The MACD remains firmly above its signal line, reinforcing the positive sentiment. On this shorter timeframe, immediate resistance lies at $4,696.93, followed by $4,713.38 and $4,730.93. A decisive break and hold above the $4,696.93 level could open the door for further gains, potentially targeting the 4-hour resistance at $4,702.04 and even $4,753.13. The Stochastic Oscillator, with K at 88.95 and D at 91.07, is in extreme overbought territory on the 1-hour chart, indicating that while the trend is up, immediate upside might be limited without a period of consolidation or a minor pullback to relieve this pressure. However, the overall 'AL' signal across multiple indicators on this timeframe suggests that dips are likely to be viewed as buying opportunities by short-term traders.
Looking at the 4-hour chart, the bullish trend continues with 89% strength. While the ADX at 18.73 suggests a weaker trend compared to the 1-hour chart, indicating potential choppiness, the RSI at 66.6 remains in neutral territory, leaving room for further upside. The Stochastic Oscillator shows K at 89.48 and D at 77.25, signaling a bullish continuation, though also nearing extreme overbought conditions. The key here is that the price is trading above the middle Bollinger Band, indicating upward pressure. The immediate resistance levels on this timeframe are $4,669.97, $4,702.04, and $4,753.13. The 1-hour chart's strength, coupled with the broader uptrend, supports the bullish case. A sustained move above $4,700 would be a significant psychological and technical victory for the bulls, suggesting a potential retest of higher price levels. The market sentiment, as indicated by the 'AL' signals dominating the 1-hour and 4-hour charts, leans towards upside potential, with bulls likely defending support levels around $4,586.81 should any significant retracement occur.
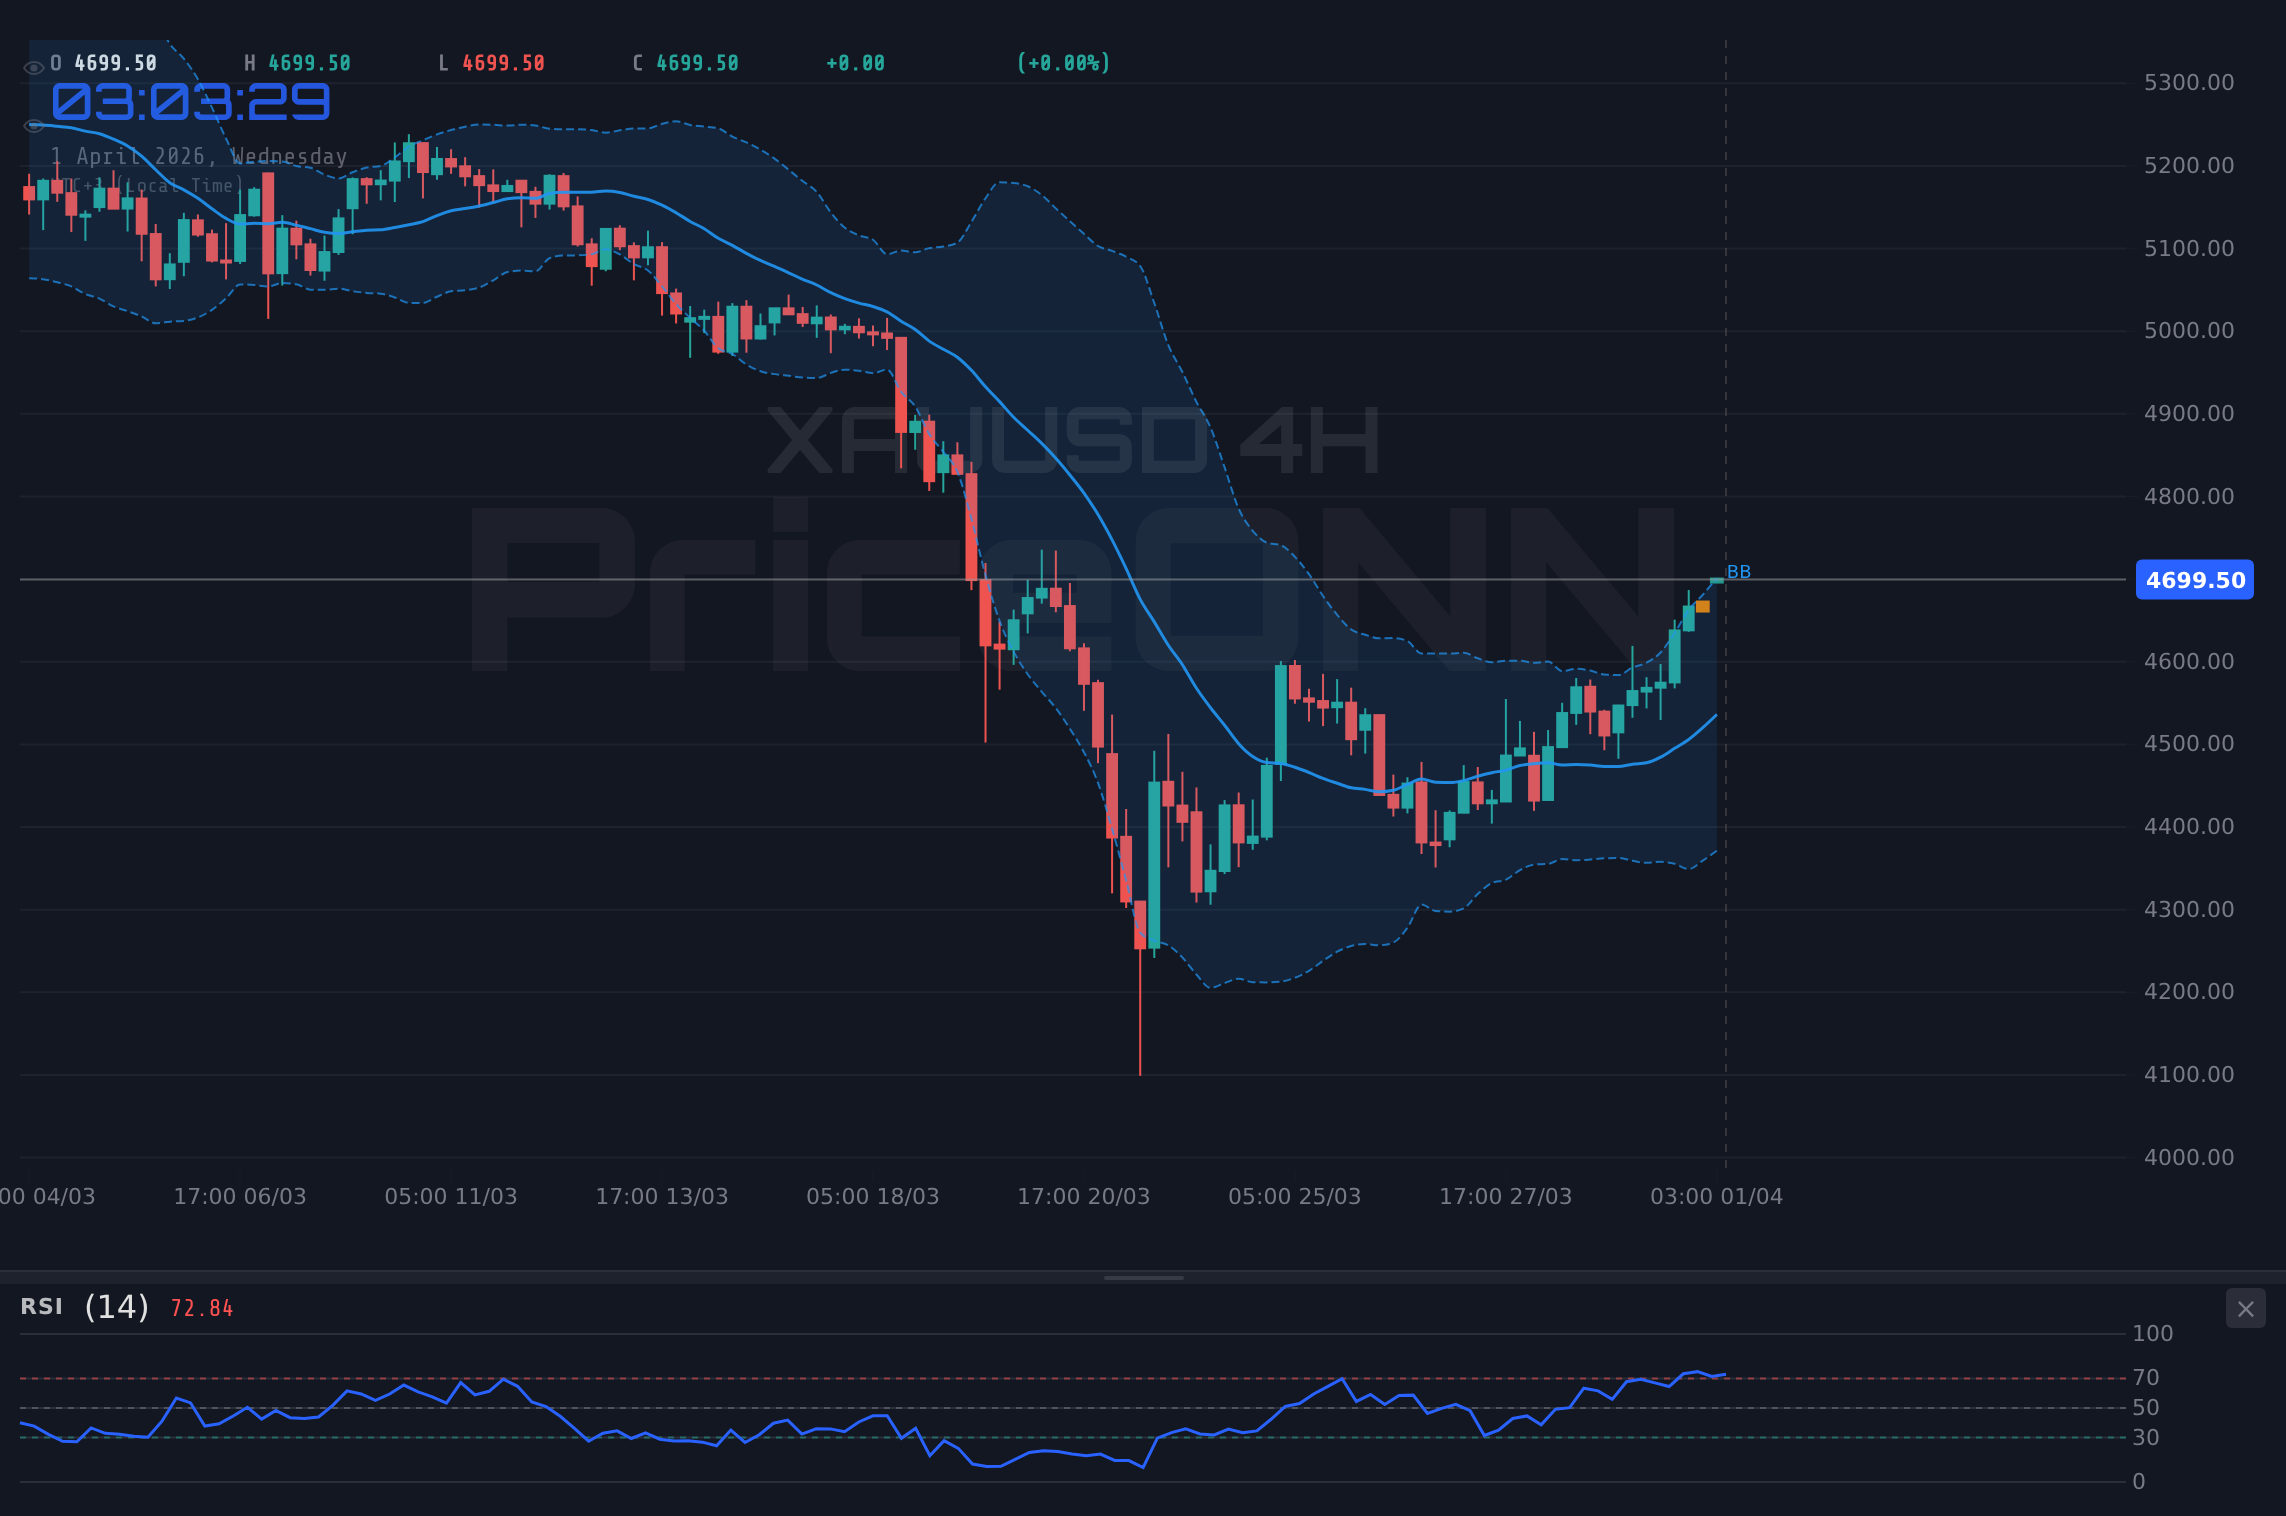
The daily timeframe presents a more nuanced picture. While the overall trend is classified as neutral with 50% strength, the ADX at 32.5 indicates a strong trend, albeit one that has been consolidating or showing conflicting signals recently. The RSI at 46.2 is in neutral territory, leaning slightly bearish, and the MACD is below its signal line, suggesting negative momentum. However, the Stochastic Oscillator shows a bullish crossover with K at 54.82 and D at 36.71, hinting at a potential bottoming process or a shift in sentiment. The price is currently trading below the middle Bollinger Band, which typically suggests bearish pressure. The daily support levels are $4,426.81, $4,342.76, and $4,265.96, while resistance stands at $4,587.66, $4,664.46, and $4,748.51. The divergence between the shorter timeframes' bullish momentum and the daily's neutral-to-bearish leanings highlights the importance of key resistance levels. A sustained push above the daily resistance at $4,587.66, and particularly above the 4-hour resistance at $4,753.13, would be necessary to invalidate the current daily consolidation and confirm a continuation of the broader bullish trend.
Where Bears Take Control: The Case for a Pullback
Despite the short-term bullish momentum, several factors suggest that the bears could regain control, leading to a significant pullback in gold prices. The most immediate concern stems from the overbought conditions on the 1-hour RSI (72.17) and Stochastic Oscillator (K=88.95, D=91.07). Extreme readings in these indicators often precede a period of consolidation or a reversal, especially if accompanied by waning volume or negative divergence on higher timeframes. The daily chart's neutral-to-bearish signals, including the RSI at 46.2 and the MACD below its signal line, also cast a shadow over the bullish outlook. If gold fails to decisively break through the immediate resistance around $4,696.93, a failure swing could develop, leading to a test of the support levels.
The primary support to watch on the 1-hour chart is $4,662.93. A break below this level would signal a loss of immediate bullish conviction and could accelerate a move towards the 4-hour support at $4,586.81. If this significant support gives way, the next logical target would be the daily support at $4,426.81. Such a decline would likely be fueled by a strengthening US Dollar Index (DXY) and a shift in risk sentiment away from safe-haven assets. The DXY is currently showing a strong downward trend on the 1-hour and 4-hour charts (ADX 39.49 and 25.99 respectively), but its 1-day chart indicates a strong bullish trend (ADX 32.46), suggesting potential for a bounce. If the DXY begins to rally, it would typically exert downward pressure on gold prices. Furthermore, if equity markets, such as the S&P 500 (currently at 6546.45) and Nasdaq 100 (at 23851.41), show signs of topping out or entering a correction, risk aversion could increase, leading investors to shed gold positions in favor of more liquid or perceived safer assets, contrary to its usual safe-haven status during extreme fear.
The geopolitical landscape, while currently supporting gold's safe-haven appeal, could also present risks. Any de-escalation in the Middle East tensions, or a perceived reduction in supply chain disruptions, might reduce the immediate demand for gold as a hedge. While Brent crude is trading at $106.88, signaling ongoing supply concerns, any positive news regarding a resolution or a significant increase in non-OPEC+ production could lead to a sharp decline in oil prices, indirectly impacting inflation expectations and gold's appeal. The daily chart's ADX of 32.5 indicates a strong trend, but the RSI and MACD are suggesting a potential shift. A break below the critical 4-hour support at $4,586.81 would be a strong bearish signal, indicating that the recent rally was a bull trap and that sellers are in firm control, potentially targeting the $4,426.81 level and below.
The Waiting Game: Consolidation and Uncertainty
In the absence of a clear directional catalyst, gold prices could enter a period of consolidation, trading within a defined range. This scenario is supported by the conflicting signals across different timeframes and indicators. The 1-hour chart shows strong bullish momentum, but the overbought Stochastic and RSI suggest a need for a pause. The daily chart, conversely, displays neutral-to-bearish leanings, indicating underlying weakness that tempers the shorter-term optimism. This divergence creates a 'waiting game' scenario where price action becomes range-bound until a decisive catalyst emerges.
During such a phase, gold might trade sideways, oscillating between the immediate support at $4,662.93 and resistance at $4,696.93 on the 1-hour chart. The wider range on the 4-hour chart, from $4,586.81 to $4,702.04, provides a broader boundary for this consolidation. Within this range, traders might look for shorter-term opportunities, but the lack of a strong trend (as suggested by the 4-hour ADX of 18.73) makes sustained moves difficult. The Stochastic Oscillator on the 1-hour chart is deep in overbought territory, while on the daily, it shows a bullish crossover but remains subdued. This conflicting positioning can lead to whipsaw price action, where small moves quickly reverse. For consolidation to persist, key economic data releases would need to be largely in line with expectations, and geopolitical headlines would need to remain stable, neither escalating nor de-escalating significantly.
The Federal Reserve's stance, particularly Chair Powell's upcoming speech, will be crucial in determining whether gold breaks out of its consolidation or remains range-bound. If Powell adopts a hawkish tone, signaling a potential delay in interest rate cuts or even further tightening, it would likely boost the US Dollar and put pressure on gold. Conversely, a dovish tone, emphasizing a commitment to reducing inflation and potentially cutting rates sooner, could weaken the dollar and support gold prices. The market's reaction to these speeches, and the subsequent price action, will dictate the next directional move. Until then, expect price action to be characterized by consolidation, with key levels acting as temporary barriers rather than definitive breakout points.
Probability Assessment: Bullish Momentum Meets Overbought Signals
Considering the current technical and fundamental landscape, the most probable scenario leans towards a cautious bullish outlook, but with a significant risk of short-term consolidation or a minor pullback. The strong 1-hour and 4-hour bullish trend signals, supported by positive MACD momentum and the overall 'AL' signals from shorter timeframes, suggest that the underlying sentiment remains positive. However, the overbought conditions on the RSI and Stochastic oscillators across multiple timeframes, particularly the 1-hour, cannot be ignored. The daily chart's neutrality adds to the uncertainty, implying that the market is awaiting a clearer direction. Therefore, a 55% probability is assigned to a scenario where gold consolidates in the near term, potentially testing lower support levels around $4,662.93 before resuming its uptrend. A 35% probability is assigned to a continuation of the bullish trend, contingent on breaking key resistance levels and Powell delivering a dovish message. The bearish scenario, involving a decisive break below $4,586.81, is assigned a 10% probability, requiring a significant shift in macro or geopolitical sentiment.
The key driver for the bullish continuation would be a strong upward break above $4,696.93, followed by a confirmed close above $4,730.93. This would likely be accompanied by a dovish surprise from the Federal Reserve or an escalation of geopolitical tensions. Conversely, a bearish scenario would be triggered by a close below $4,662.93, potentially fueled by hawkish Fed commentary or a significant easing of Middle East conflicts. The consolidation scenario, which appears most likely in the immediate short term, would involve price action remaining between $4,662.93 and $4,730.93, with volatility potentially picking up around Powell's speech.
Bullish Continuation: Riding the Momentum
35% ProbabilityConsolidation Phase: The Waiting Game
55% ProbabilityBearish Reversal: The Sell-Off Scenario
10% ProbabilityWhat I'm Watching This Week
The coming week is pivotal for gold, with several key events and data points that could dictate its trajectory. Firstly, Fed Chair Powell's speech is paramount. Market participants will be dissecting every word for clues on the future path of interest rates. A hawkish tone could trigger a dollar rally and pressure gold, while a dovish stance might offer further support. Secondly, I'll be closely monitoring the US Dollar Index (DXY). With its 1-day chart showing a strong bullish trend (ADX 32.46) despite shorter-term weakness, any signs of a sustained recovery in the dollar could act as a headwind for gold. Finally, any significant geopolitical developments, particularly concerning the Middle East conflict or major supply chain shifts, will be closely watched. Escalation could further bolster gold's safe-haven appeal, while de-escalation might reduce its attractiveness.
The technical indicators provide a mixed but predominantly bullish short-to-medium term outlook. The strong uptrend on the 1-hour chart, supported by positive MACD momentum, suggests that dips may be shallow. However, the overbought RSI and Stochastic readings on the 1-hour chart, combined with the neutral stance on the daily timeframe, indicate that the market could be due for a consolidation or a minor pullback before the next significant move. The key will be how gold reacts to the $4,696.93 immediate resistance and the $4,662.93 support. A decisive break above resistance, fueled by dovish Fed rhetoric or escalating geopolitical risks, could propel prices higher. Conversely, a failure at resistance, coupled with hawkish Fed commentary, might lead to a test of lower support levels. Patience and risk management remain critical for navigating these potentially choppy waters.
Frequently Asked Questions: XAUUSD Analysis
What happens if XAUUSD breaks above the $4,730.93 resistance level?
A sustained break and close above $4,730.93, particularly on strong volume, would signal further bullish momentum. This could trigger a move towards the next significant resistance level at $4,753.13, and potentially higher targets if the market sentiment remains strongly positive.
Should I buy XAUUSD at current levels near $4,695.27 given the overbought RSI?
Caution is advised. While the short-term trend is bullish, the RSI at 67.36 on the 1-hour chart is nearing overbought territory. Buying at these levels carries a higher risk of a short-term pullback. Consider waiting for a minor dip towards support around $4,662.93 or confirmation of a breakout above $4,730.93 for a more favorable risk/reward setup.
Is the RSI at 67.36 a sell signal for XAUUSD right now?
An RSI of 67.36 is not an outright sell signal, but it indicates strong buying pressure that may be nearing exhaustion on the 1-hour timeframe. It suggests that the market is becoming overbought and a period of consolidation or a minor correction is possible. Confirmation from other indicators or price action is needed for a definitive sell signal.
How will Fed Chair Powell's speech affect XAUUSD this week?
Powell's speech is a critical event. A hawkish tone, suggesting higher-for-longer rates, could strengthen the USD and pressure gold, potentially leading to a test of support levels. A dovish tone, hinting at rate cuts, could weaken the USD and support gold, potentially driving it towards resistance levels like $4,730.93.
| Indicator | Value | Signal | Interpretation |
|---|---|---|---|
| RSI (14) | 67.36 | Neutral | Nearing overbought on 1H, neutral on 4H, slightly bearish on 1D |
| MACD Histogram | Positive | Bullish | Positive momentum on 1H/4H, negative on 1D |
| Stochastic | K=88.95, D=91.07 | Bearish | Overbought on 1H, nearing overbought on 4H, bullish crossover on 1D |
| ADX | 37.47 | Bullish | Strong uptrend on 1H, weak trend on 4H, strong trend on 1D |
| Bollinger | Middle Band | Bullish | Price above middle band on 1H/4H, below on 1D |
Track markets in real-time
AI-powered analysis, technical indicators and real-time price data.
Join Our Telegram Channel
Breaking market news, AI analysis and trading signals instantly.
Join Channel