The intricate dance of gold prices near the $4,707 mark is currently a focal point for traders, reflecting a market caught between persistent geopolitical anxieties and shifting macroeconomic winds. Having recently tested levels around $4,707.03, the precious metal is demonstrating resilience, though not without its own internal conflicts, as seen across different timeframes. This isn't just about a number; it's about what that number represents – a potential inflection point where underlying fundamental drivers and technical signals are beginning to diverge, creating a complex landscape for investors.
- RSI at 50.77 on the 1H chart signals neutral but rising momentum for XAUUSD.
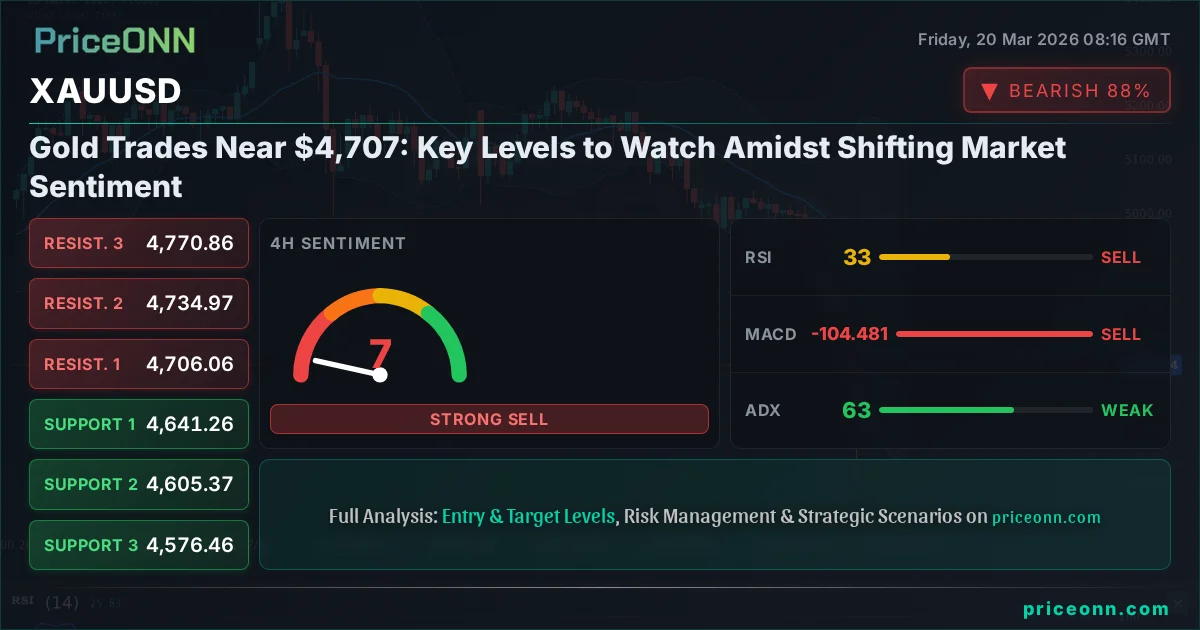
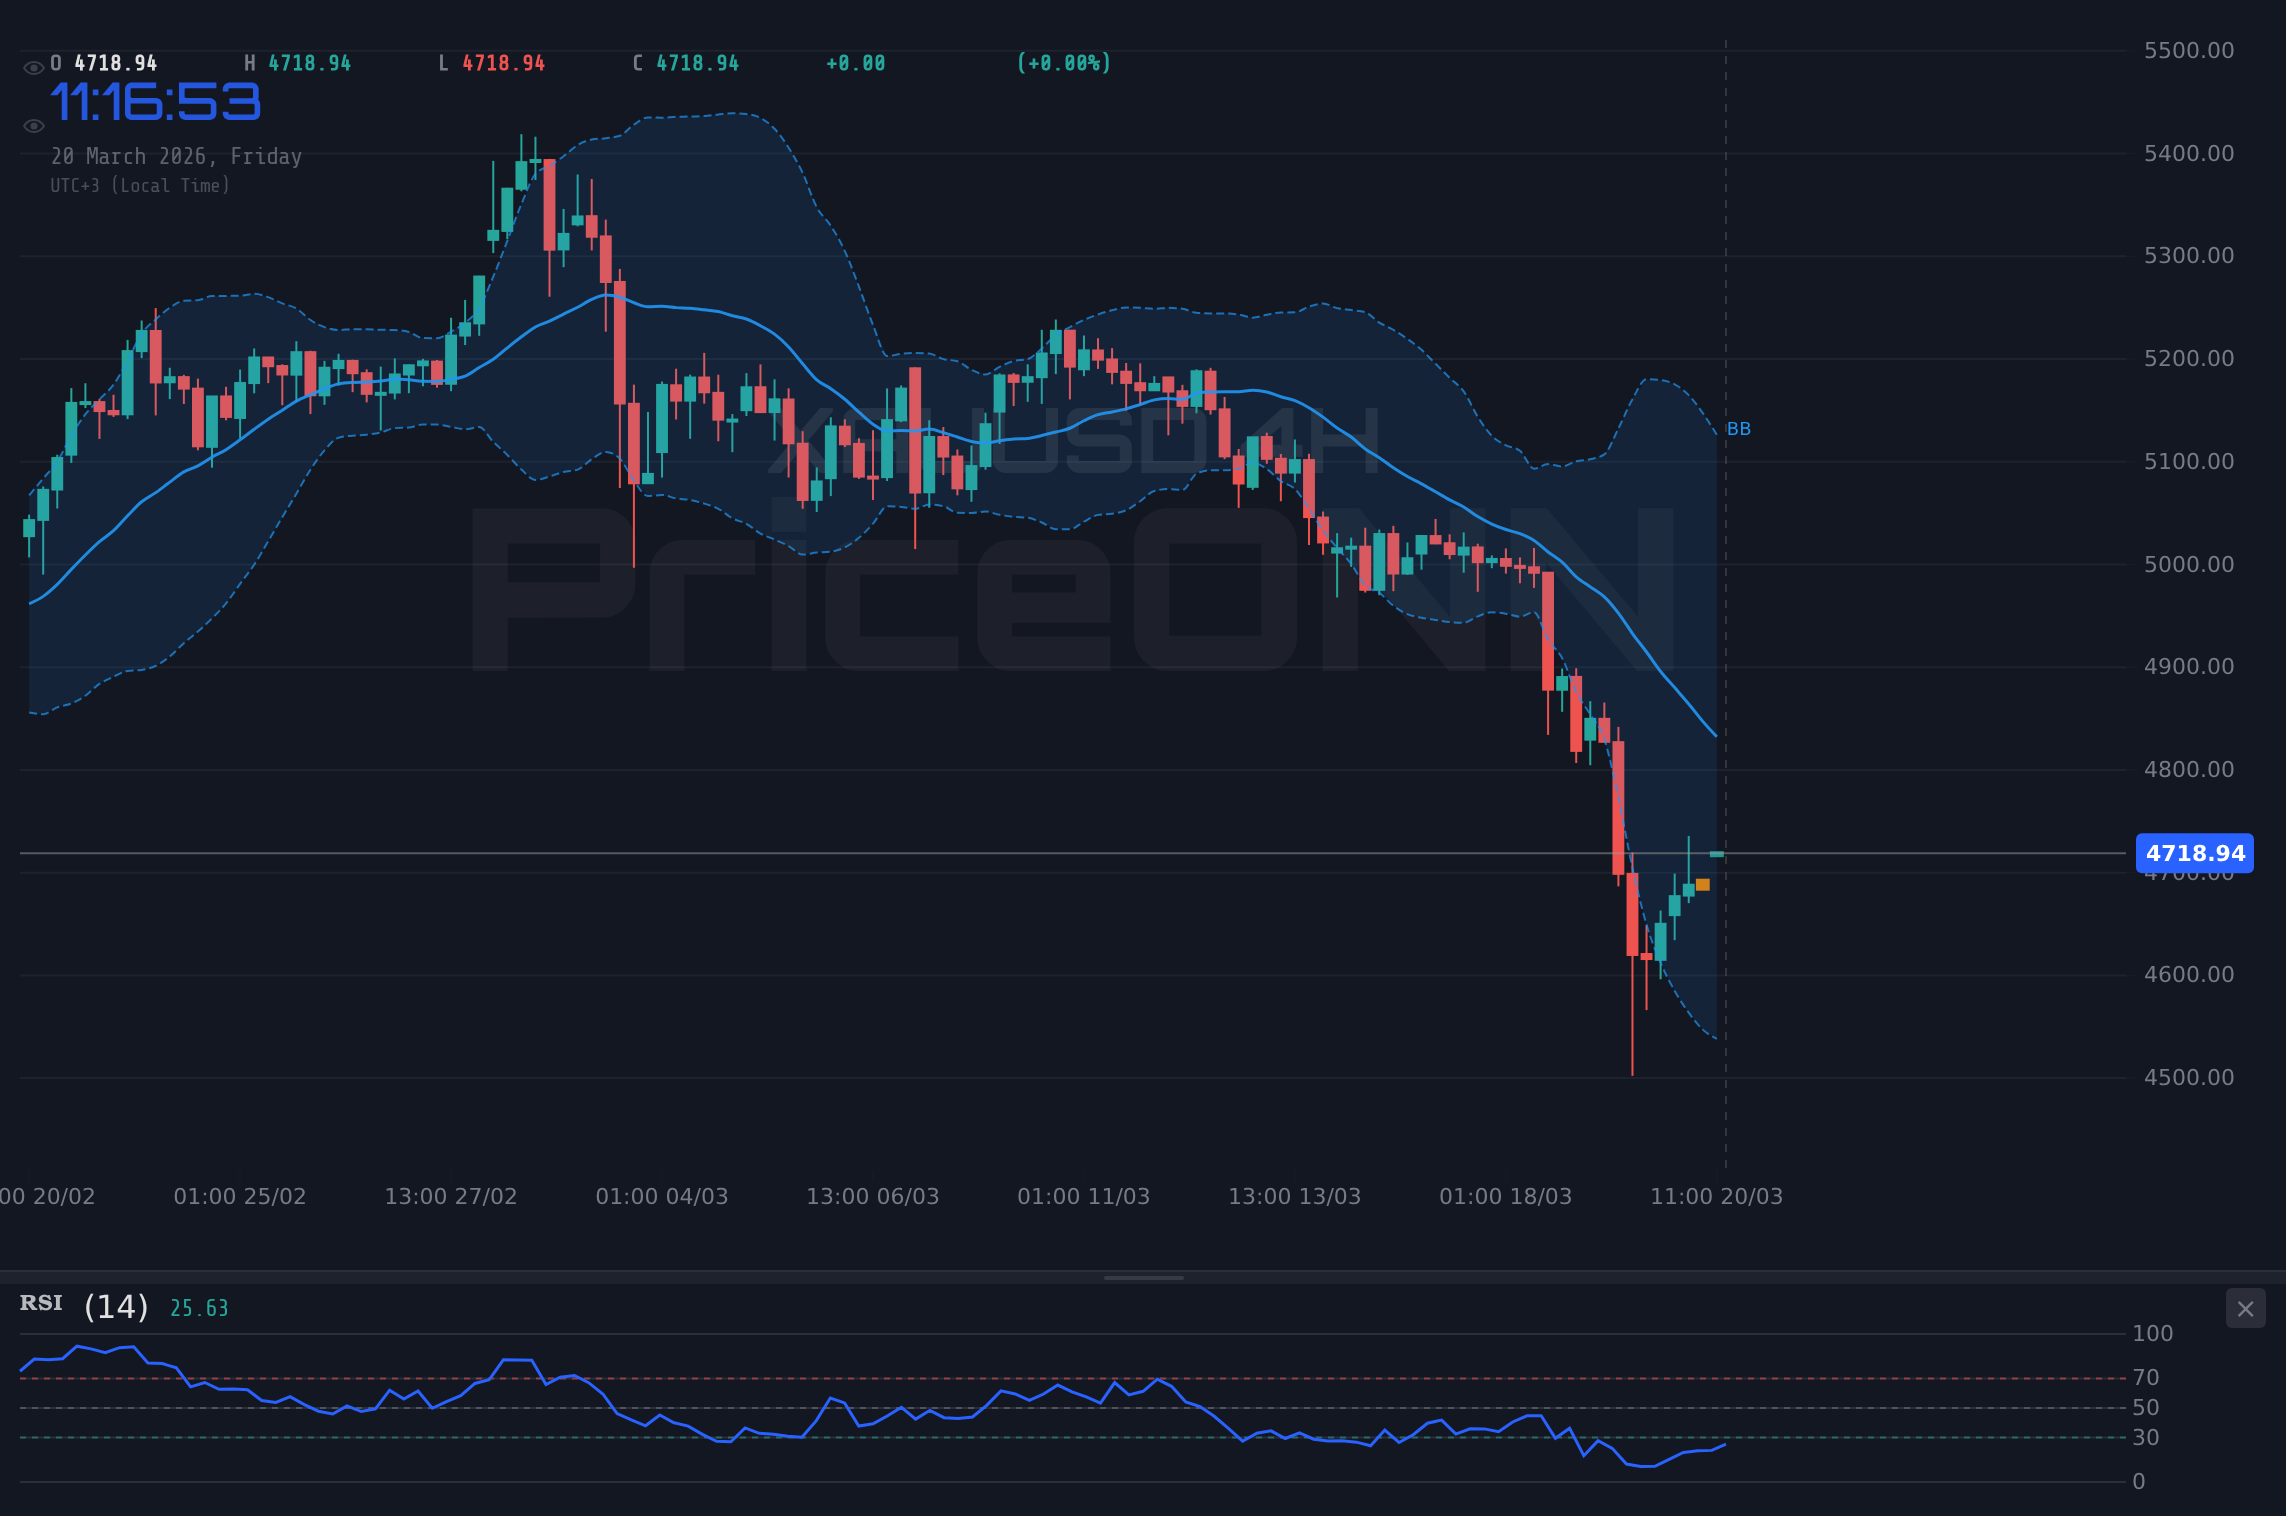
- Critical support for XAUUSD sits at $4,653.23, tested multiple times this week.
- MACD histogram shows positive momentum on 1H, but a different picture on 4H and 1D charts.
- DXY at 99.11 is currently rising, potentially pressuring gold prices due to its inverse correlation.
The current price action for XAUUSD hovers around $4,707.03, a level that has seen considerable attention. On the 1-hour chart, technical indicators present a somewhat mixed but cautiously optimistic picture. The Relative Strength Index (RSI) at 50.77 suggests a neutral stance but with an underlying upward drift, indicating that buyers are not entirely absent from the market. This is further supported by positive momentum on the MACD, with the MACD line trading above its signal line. However, this intraday strength must be viewed within the broader context. The 4-hour chart reveals a different narrative, with the RSI dipping to 31.6, signaling oversold conditions and a potential for a bounce, yet the ADX at a robust 62.64 points to a very strong downtrend, creating a clear conflict.
This divergence across timeframes underscores the challenge traders face. While the immediate hourly outlook might hint at a potential upward move, the daily and even the 4-hour charts suggest that underlying bearish pressure remains significant. The ADX, a measure of trend strength, stands at a formidable 62.64 on the 4-hour chart and 19.43 on the daily chart. The high ADX value on the 4H suggests a strong existing trend, which appears to be a downtrend despite the daily's weaker ADX. This conflict between short-term momentum and longer-term trend strength is a classic scenario that requires careful navigation. The general signal on the 1H is AL (Buy), while 4H and 1D lean heavily towards SAT (Sell), highlighting the indecision. This is exactly where traders need to pay close attention to confirmation signals and risk management.
Looking at the broader market correlations, the Dollar Index (DXY) is currently trading at 99.11, showing a 0.2% daily increase. Historically, a strengthening DXY tends to put downward pressure on gold prices, as both are often inversely correlated due to their safe-haven status and the dollar's role as the primary global reserve currency. When the dollar gains strength, it makes dollar-denominated assets like gold more expensive for holders of other currencies, potentially dampening demand. The fact that gold is currently trading near $4,707.03 despite a rising DXY is significant. It suggests that other fundamental factors, such as geopolitical tensions or inflation concerns, might be counteracting the dollar's strength, or that the dollar's rise is not yet strong enough to overcome gold's intrinsic safe-haven appeal.
Geopolitical tensions remain a significant, albeit often unquantifiable, driver for gold. Recent news highlights ongoing concerns, such as those related to the Middle East, which historically tend to boost demand for gold as a safe haven. While specific headlines can cause short-term volatility, the persistent undercurrent of global instability provides a foundational support for gold prices. The market is constantly weighing the immediate threat of conflict against diplomatic de-escalation efforts. This delicate balance means that any significant development in global hotspots can quickly shift market sentiment and, consequently, gold's trajectory. The recent news mentioning gold tumbling as oil prices skyrocket amid Middle East conflict underscores this volatile interplay.
The economic calendar also plays a crucial role. While specific high-impact events for the immediate hours might be limited, the anticipation of upcoming data releases, such as inflation figures or central bank policy statements, can create preemptive market movements. Traders often position themselves ahead of major economic announcements, leading to increased volatility. For instance, if upcoming inflation data suggests persistent price pressures, it could reignite interest in gold as an inflation hedge. Conversely, data indicating cooling inflation might reduce gold's appeal. Understanding these macroeconomic underpinnings is key to deciphering whether gold's current stance near $4,707 is a temporary pause or the precursor to a more significant move.
The divergence between short-term bullish signals (1H RSI, MACD) and longer-term bearish indicators (4H ADX at 62.64) creates significant uncertainty. Traders must watch for confirmation on higher timeframes before committing to a direction.
The 1-day chart for XAUUSD presents a picture of a market potentially oversold but still trending downwards. The RSI at 36.88 is below the 50 level, indicating bearish sentiment, and the MACD is firmly in negative territory. The fact that the price is trading below the lower Bollinger Band suggests extreme selling pressure or a potential reversal point. Stochastic indicators in the oversold region (K=16.88, D=14.49) are screaming 'buy' from a purely technical standpoint, but the ADX at 19.43 indicates a weak trend, which means these oversold signals might not be immediately acted upon. The overall signal for the daily chart is SAT (Sell), reinforcing the idea that the longer-term trend is still a dominant force.
This complex interplay of signals across different timeframes is what makes trading gold so challenging yet potentially rewarding. The 1-hour chart might entice short-term traders with its positive momentum, but the daily chart warns of deeper underlying weakness. The key is not to chase short-term fluctuations but to understand the dominant trend and wait for confluence. For instance, a sustained move above the 4-hour resistance at $4,706.06, coupled with a bullish signal on the daily RSI and MACD, would be a much stronger indication of a potential trend change than a mere hourly bounce.
Let's consider the implications of the DXY's current position at 99.11. A continued rise in the dollar index could exacerbate downward pressure on gold. If the DXY breaks decisively above key resistance levels, it might signal a broader risk-off sentiment that favors the dollar over commodities like gold. However, if geopolitical events escalate significantly, they could trigger a flight to safety that benefits gold even as the dollar strengthens, creating a complex correlation dynamic. This is where fundamental analysis becomes paramount - understanding the primary driver of market sentiment is crucial.
The recent news mentioning gold tumbling below $4,650 amidst soaring energy costs and Middle East conflict highlights how interconnected these markets are. While the current price is around $4,707, understanding these past events provides valuable context. The narrative of gold falling despite rising energy prices is counterintuitive if one solely views gold as an inflation hedge. It suggests that other factors, like a liquidity grab or a strong dollar, might have temporarily dominated market sentiment. This reminds us that no single factor dictates gold's price; it's a confluence of geopolitical events, central bank policies, dollar strength, and market liquidity.
Examining the 1H Stochastic K value at 53.12 and D value at 75.80 for XAUUSD shows a %K
When faced with conflicting signals across timeframes, patience is paramount. Look for higher timeframe confirmation (4H or Daily) before entering trades. A break and hold above the 4H resistance of $4,706.06 would be a significant bullish development, but until then, caution is advised.
The ADX value of 37.78 on the 1-hour chart indicates a strong trend, which is somewhat confusing given the neutral RSI. However, the general signal for the 1H is AL (Buy). This suggests that while the trend might be strong, the momentum is currently leaning towards buyers in the very short term. Contrast this with the 4H ADX of 62.64, which signifies an extremely strong trend, and the 1D ADX of 19.43, indicating a weak trend. This is a classic case of multi-timeframe analysis revealing a market in transition or consolidation, where short-term moves might be noise against a backdrop of longer-term indecision or a strong but potentially reversing trend.
The overall signal summary paints a picture of caution. While the 1H chart leans towards a buy signal (5 Buy, 3 Sell), the 4H and 1D charts are heavily skewed towards sell signals (4H: 1 Buy, 7 Sell; 1D: 2 Buy, 6 Sell). This overall bearish sentiment on higher timeframes cannot be ignored. The current price of $4,707.03 is sitting precariously between intraday strength and daily weakness. Traders might see short-term opportunities, but the risk of a larger trend continuation to the downside is significant. This is why managing risk is not just a suggestion but a necessity in such an environment.
The question for many traders right now is whether the current levels around $4,707.03 represent a buying opportunity or a trap. Given the conflicting technical signals and the strong bearish bias on higher timeframes, it's prudent to wait for clearer confirmation. A decisive break above the 4-hour resistance at $4,706.06, sustained by increasing volume and positive daily indicators, would signal a shift. Conversely, a failure to hold the current price and a break below the 1-hour support at $4,653.23 could confirm the bearish sentiment indicated by the longer timeframes, potentially leading to further downside.
In essence, gold is at a critical juncture near $4,707.03. The short-term technicals offer a glimmer of hope for buyers, but the overarching trend on higher timeframes remains a significant headwind. Geopolitical factors and the direction of the US Dollar Index will likely play a decisive role in the coming days. For now, patience and a vigilant approach to risk management are the most valuable tools in a trader's arsenal. Waiting for a clear signal of trend confirmation or a significant shift in market sentiment is crucial before making any substantial commitments.
Focus on confluence. Look for multiple indicators and timeframes to align before entering a trade. For XAUUSD, a confirmed break above $4,706.06 on the 4H chart, supported by bullish daily signals, would offer a higher-probability bullish setup.
The historical context also provides some perspective. Periods of high volatility and conflicting signals often precede significant market moves. Whether this current indecision resolves into an upward revision or a continuation of the downtrend will likely depend on the confluence of fundamental catalysts and technical breakthroughs. The $4,707.03 level is not just a price point; it's a battleground where bulls and bears are currently locked in a struggle for control, and the outcome will shape gold's immediate future.
Ultimately, trading gold near $4,707.03 requires a nuanced understanding of both its technical patterns and the fundamental forces at play. The conflicting signals from different timeframes suggest that the market is searching for direction. While the 1-hour chart might offer short-term trading opportunities, the longer-term perspective advises caution. Traders should remain observant, manage their risk diligently, and wait for a clear signal before deploying significant capital. The market always presents opportunities, but patience and discipline are key to capturing them effectively.
Bearish Scenario: Downtrend Continuation
65% ProbabilityNeutral Scenario: Consolidation Around $4,707
25% ProbabilityBullish Scenario: Reversal Attempt
10% ProbabilityFrequently Asked Questions: XAUUSD Analysis
What happens if XAUUSD breaks below $4,653.23 support?
A break below $4,653.23 on the 1-hour chart would likely confirm the bearish sentiment indicated by higher timeframes. This could trigger further downside towards the next support level at $4,637.38, as the market might be positioning for a continuation of the broader downtrend.
Should I buy XAUUSD at current levels near $4,707 given the conflicting signals?
Buying at current levels near $4,707.03 is risky due to conflicting signals. While the 1H chart shows some strength, the 4H and 1D charts lean bearish. A high-probability setup would require confirmation, such as a sustained break above $4,706.06 with bullish daily indicators, or a clear bounce from oversold levels on the daily chart.
Is the RSI at 50.77 a buy signal for XAUUSD right now?
An RSI of 50.77 on the 1-hour chart is considered neutral, but with a slight upward tendency. It's not a strong buy signal on its own, especially given the bearish RSI readings on higher timeframes (31.6 on 4H, 36.88 on 1D). It indicates a lack of strong momentum in either direction on the hourly chart.
How will the rising DXY at 99.11 affect XAUUSD this week?
A rising DXY at 99.11 typically exerts downward pressure on gold prices due to their inverse correlation. However, escalating geopolitical risks could counteract this effect, potentially leading to gold holding its ground or even rising if safe-haven demand intensifies. Traders should monitor both the DXY's trend and global risk sentiment.
| Indicator | Value | Signal | Interpretation |
|---|---|---|---|
| RSI (14) | 50.77 | Neutral | Neutral momentum on 1H, bearish on 4H/1D |
| MACD Histogram | Positive | Bullish | Positive on 1H, negative on 4H/1D |
| Stochastic | K=53.12, D=75.8 | Bearish | Bearish crossover on 1H, oversold on 1D |
| ADX | 37.78 | Strong Trend | Strong trend on 1H, very strong on 4H, weak on 1D |
Track markets in real-time
AI-powered analysis, technical indicators and real-time price data.
Join Our Telegram Channel
Breaking market news, AI analysis and trading signals instantly.
Join Channel