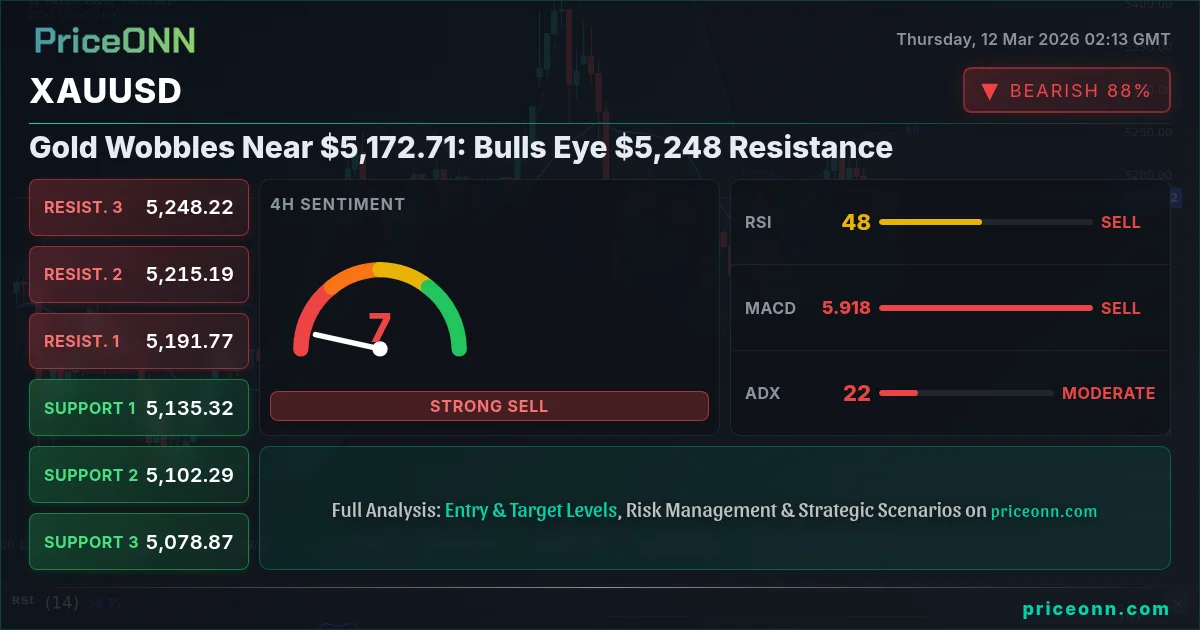
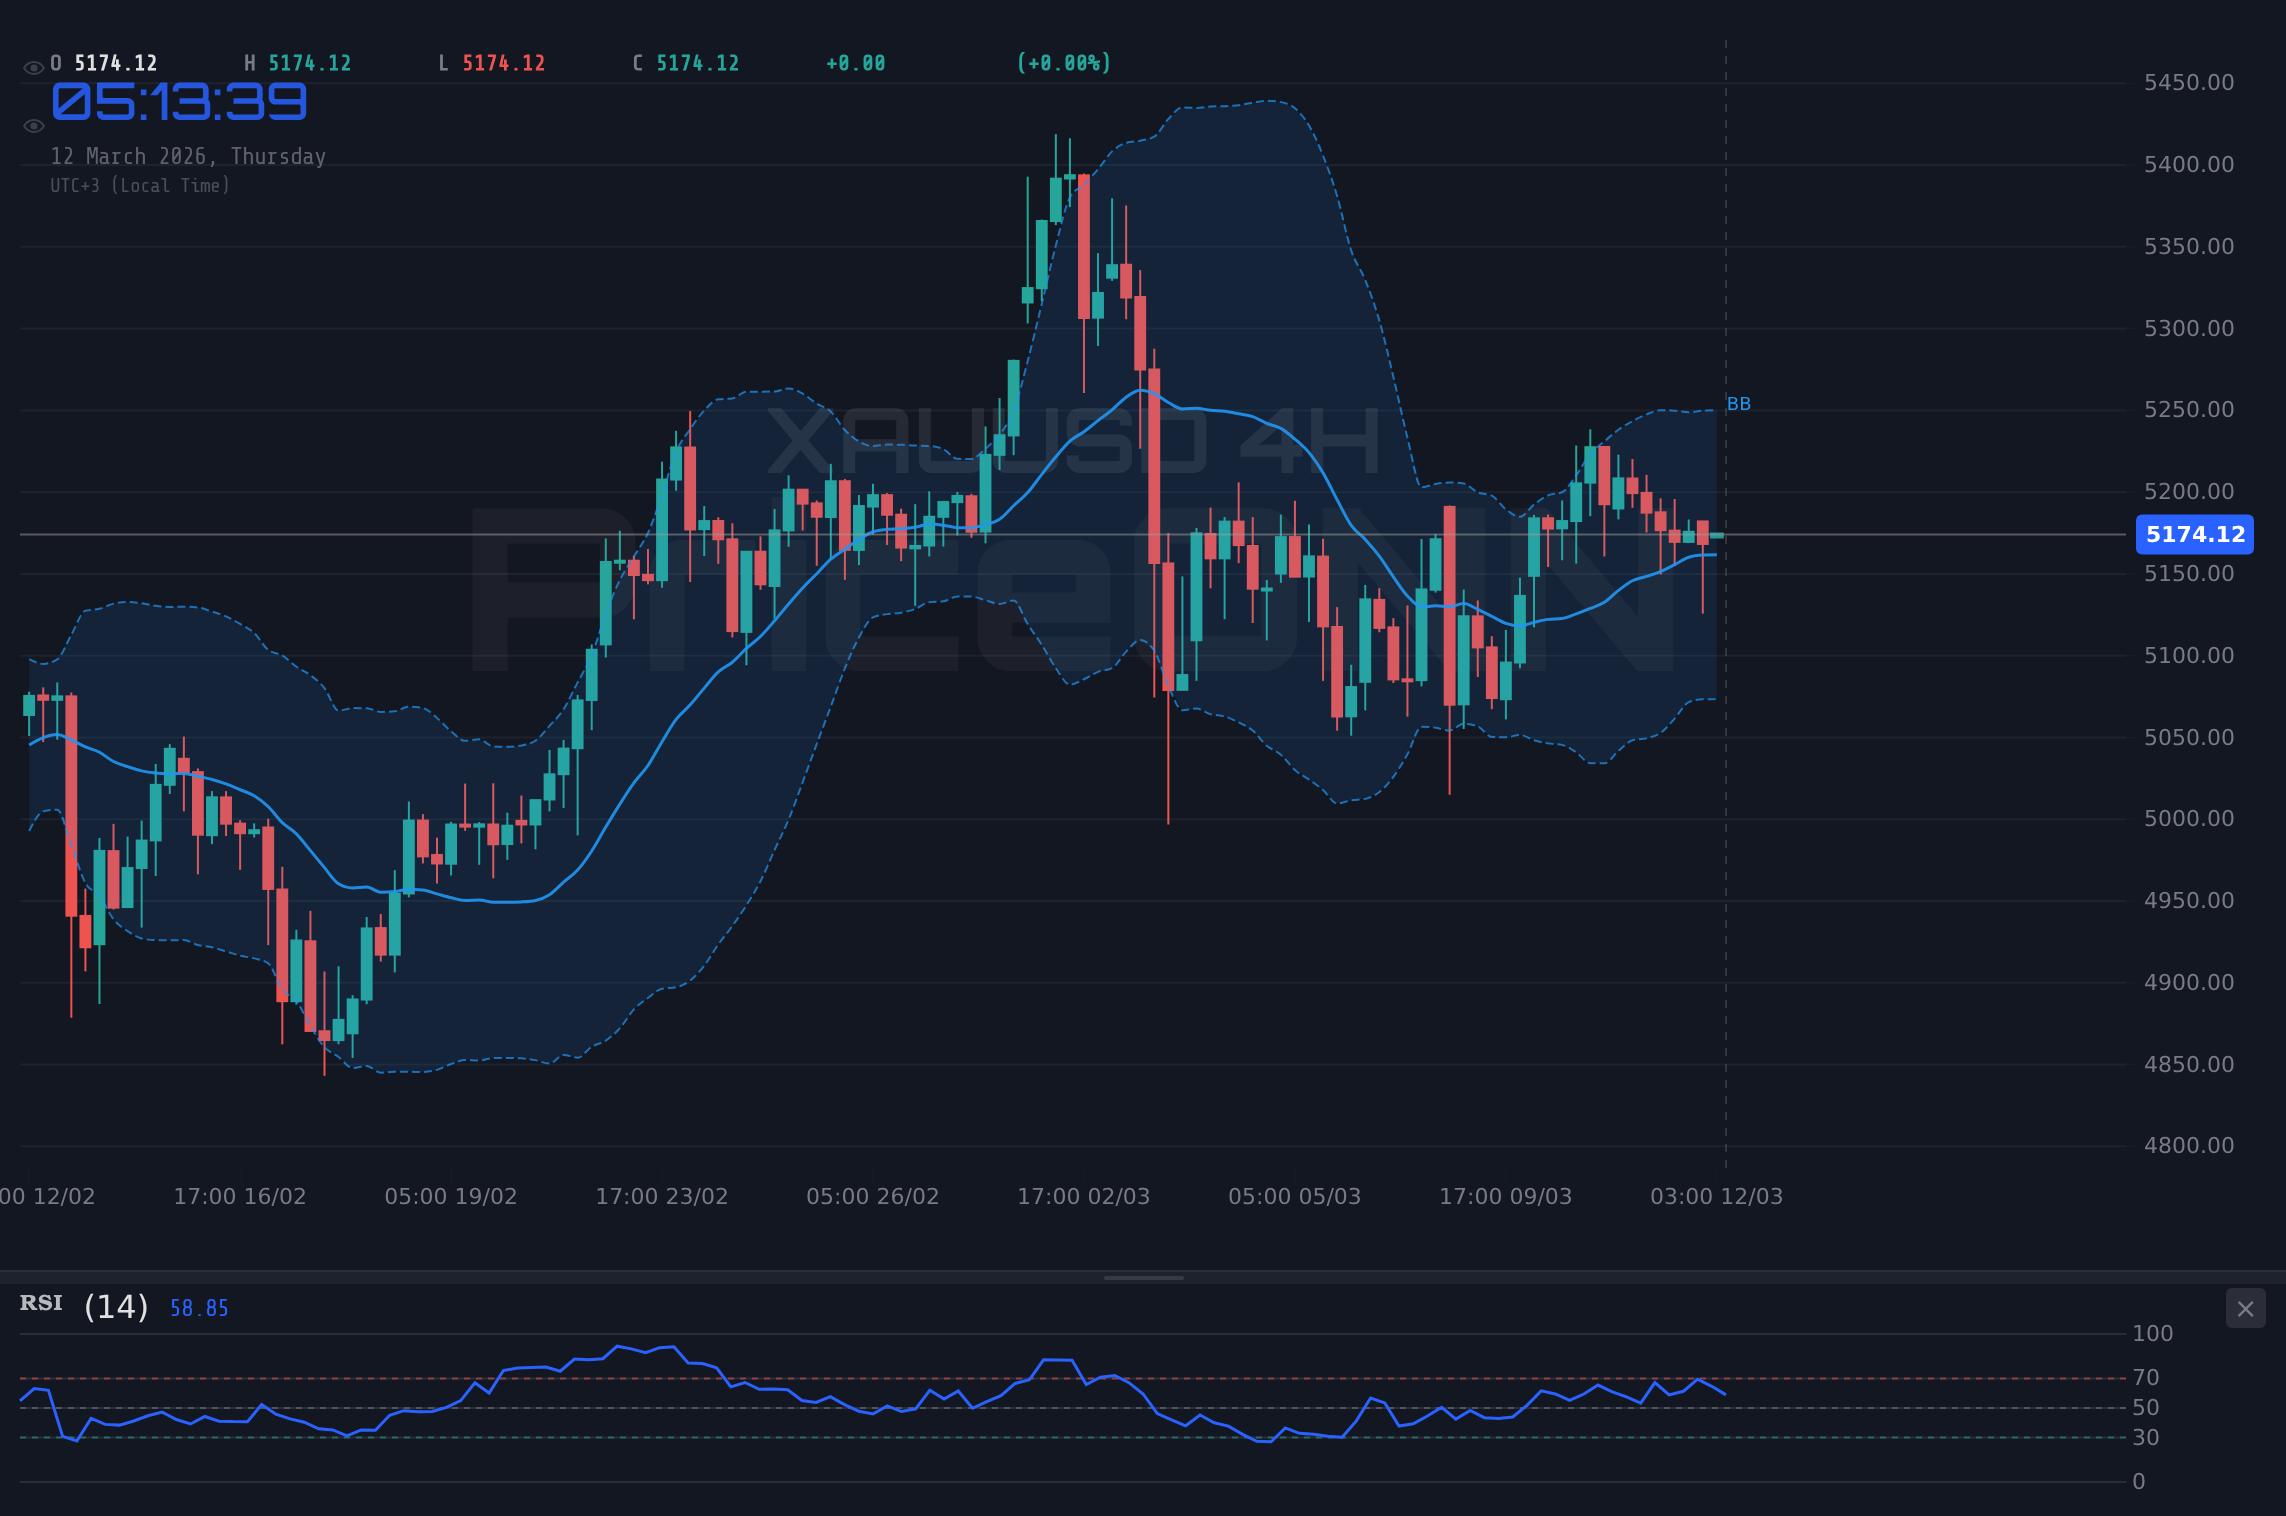
Gold is currently trading near $5,172.71, facing a tug-of-war between bullish and bearish forces. The key level to watch is the $5,168 support, which bulls need to defend to eye the $5,248 resistance. A break below this support could trigger a deeper correction, while holding above it could pave the way for further upside.
- RSI at 49.55 on the 1H chart signals neutral conditions with a slight downward bias.
- Critical support sits at $5,131.84, a break below which could accelerate losses.
- MACD histogram on the 1H chart shows negative momentum, suggesting fading bullish pressure.
- Rising crude oil prices, with Brent at $98.77, could fuel inflation and indirectly support gold as a hedge.
The Bull's Roadmap: Targeting $5,248 and Beyond
The bullish scenario hinges on gold maintaining its position above the immediate support at $5,168. The 4H chart shows a positive MACD crossover, which, if sustained, could attract further buying interest. Should the bulls manage to clear the initial resistance at $5,183.02, the next target would be $5,190.27. A successful break above this level could pave the way for a test of the $5,248.28 resistance, as indicated by the daily timeframe analysis. This scenario is likely to play out within the next week, assuming risk sentiment remains stable and the dollar index (DXY), currently at 99.12, does not strengthen significantly. The probability of this bullish scenario is estimated at 40%.
Where Bears Take Control: A Descent to $5,111
The bearish scenario would come into play if gold fails to hold the $5,168 support. The 1H chart shows a negative MACD crossover and a declining RSI, indicating weakening momentum. A break below $5,131.84 would confirm the bearish bias, potentially triggering a sell-off towards the next support level at $5,111.01. Further weakness could lead to a test of the $5,096.31 support. This scenario is likely to unfold within the next 48 hours if the DXY continues its upward trajectory, fueled by expectations of hawkish signals from the Federal Reserve. The probability of this bearish scenario is estimated at 35%.
The Waiting Game: Range-Bound Consolidation Between $5,131 and $5,183
A neutral scenario could unfold if gold remains trapped between the $5,131.84 support and the $5,183.02 resistance. This range-bound consolidation could persist throughout the week, particularly if market participants remain on the sidelines ahead of key economic data releases. The ADX on the 1H chart reads 29.36, suggesting the current trend is strong enough to hold this range. Traders might look for range-bound trading opportunities, buying near the support and selling near the resistance. This scenario is possible if the DXY remains range-bound as well. The probability of this neutral scenario is estimated at 25%.
Most Likely Scenario: A Cautious Bullish Outlook (40%)
Given the current technical picture and the prevailing market sentiment, the most likely scenario is a cautious bullish outlook. While the bearish scenario cannot be ruled out, the positive MACD crossover on the 4H chart and the potential for rising inflation to support gold suggest that bulls have a slight edge. However, traders should remain vigilant and closely monitor the DXY and risk sentiment, as these factors could quickly alter the outlook.
IF price breaks above $5,183.02 resistance, THEN target $5,190.27, followed by $5,248.28. This scenario requires a stable DXY and positive risk sentiment.
IF price breaks below $5,131.84 support, THEN target $5,111.01, followed by $5,096.31. This scenario could unfold if the DXY strengthens and risk sentiment deteriorates.
Key Triggers to Watch This Week
Several key events and data releases could influence gold prices this week. On Friday, the US will release its latest employment data, which could provide insights into the strength of the labor market and the outlook for interest rates. A stronger-than-expected report could boost the dollar and weigh on gold, while a weaker report could have the opposite effect. Traders should also monitor the DXY closely, as any significant movements in the dollar could have a direct impact on gold prices. According to Reuters, Fed officials are closely watching inflation data to determine the path of monetary policy. Additionally, geopolitical tensions involving Iran could escalate, potentially boosting safe-haven demand for gold. The Crude Oil is currently at $98.77, which could affect inflation. The market is also eyeing $90 as Iran tensions threaten Eurozone stability.
Technical Outlook Summary
| Indicator | Value | Signal |
|---|---|---|
| RSI (14) | 49.55 | Neutral |
| MACD Histogram | Negative | Bearish |
| Stochastic | K=44.35, D=41.98 | Bullish |
| ADX | 29.36 | Strong Trend |
| Bollinger | Middle Band | Watch |
Key Levels
Support Levels
Resistance Levels
A sustained break above $5,167.37 targets $5,182.07, then $5,202.9. This requires continued weakness in the DXY and stable risk sentiment.
Failure to hold $5,131.84 support leads to $5,111.01, then $5,096.31. DXY strength and risk-off sentiment would fuel this move.
Frequently Asked Questions: XAUUSD Analysis
What happens if XAUUSD breaks above $5,167.37 resistance?
A break above the $5,167.37 resistance could trigger a rally towards the next resistance levels at $5,182.07 and $5,202.9. This bullish scenario would likely be fueled by continued weakness in the dollar index and stable risk sentiment.
Should I buy at current $5,172.71 levels given RSI at 49.55?
With RSI at 49.55, the market is in a neutral zone, suggesting neither overbought nor oversold conditions. A buy at current levels would be a speculative bet on a bullish breakout. However, traders should wait for confirmation, such as a break above $5,167.37, before initiating a long position.
Is the negative MACD histogram a sell signal for XAUUSD?
The negative MACD histogram on the 1H chart indicates bearish momentum, but it's not a definitive sell signal. Traders should look for confirmation from other indicators and price action before making a decision. A break below $5,131.84 could confirm the bearish bias.
How will the US employment data affect XAUUSD this week?
The upcoming US employment data could significantly impact XAUUSD. A stronger-than-expected report could boost the dollar and weigh on gold, while a weaker report could have the opposite effect. Traders should closely monitor the data and be prepared to adjust their positions accordingly.
Track markets in real-time
AI-powered analysis, technical indicators and real-time price data.
Join Our Telegram Channel
Breaking market news, AI analysis and trading signals instantly.
Join Channel