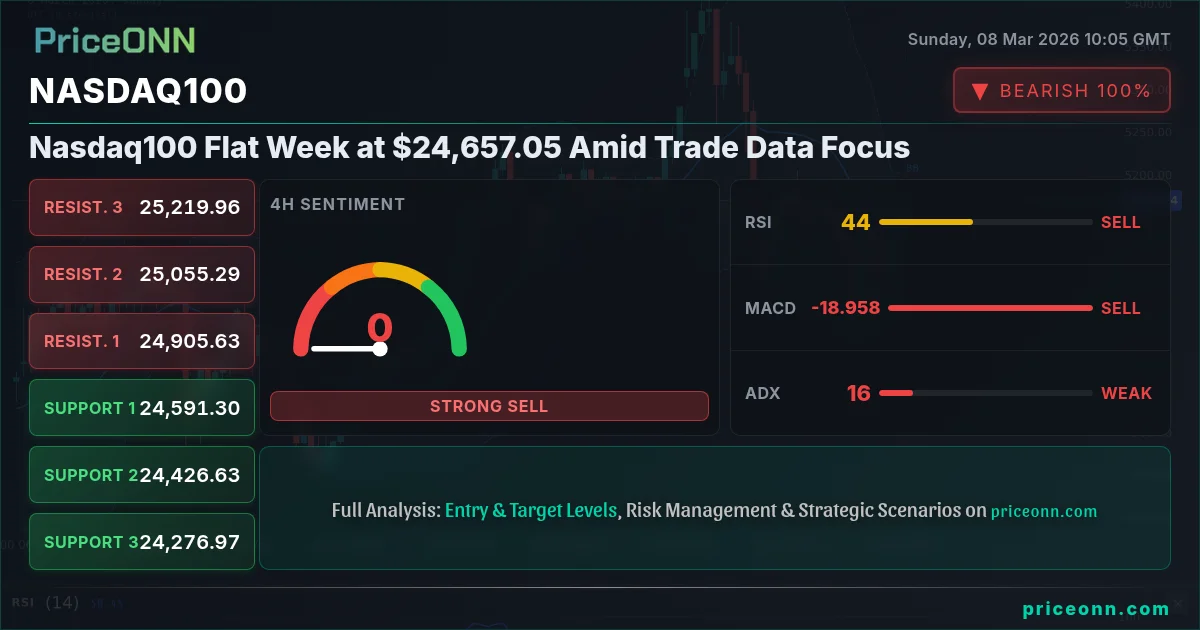
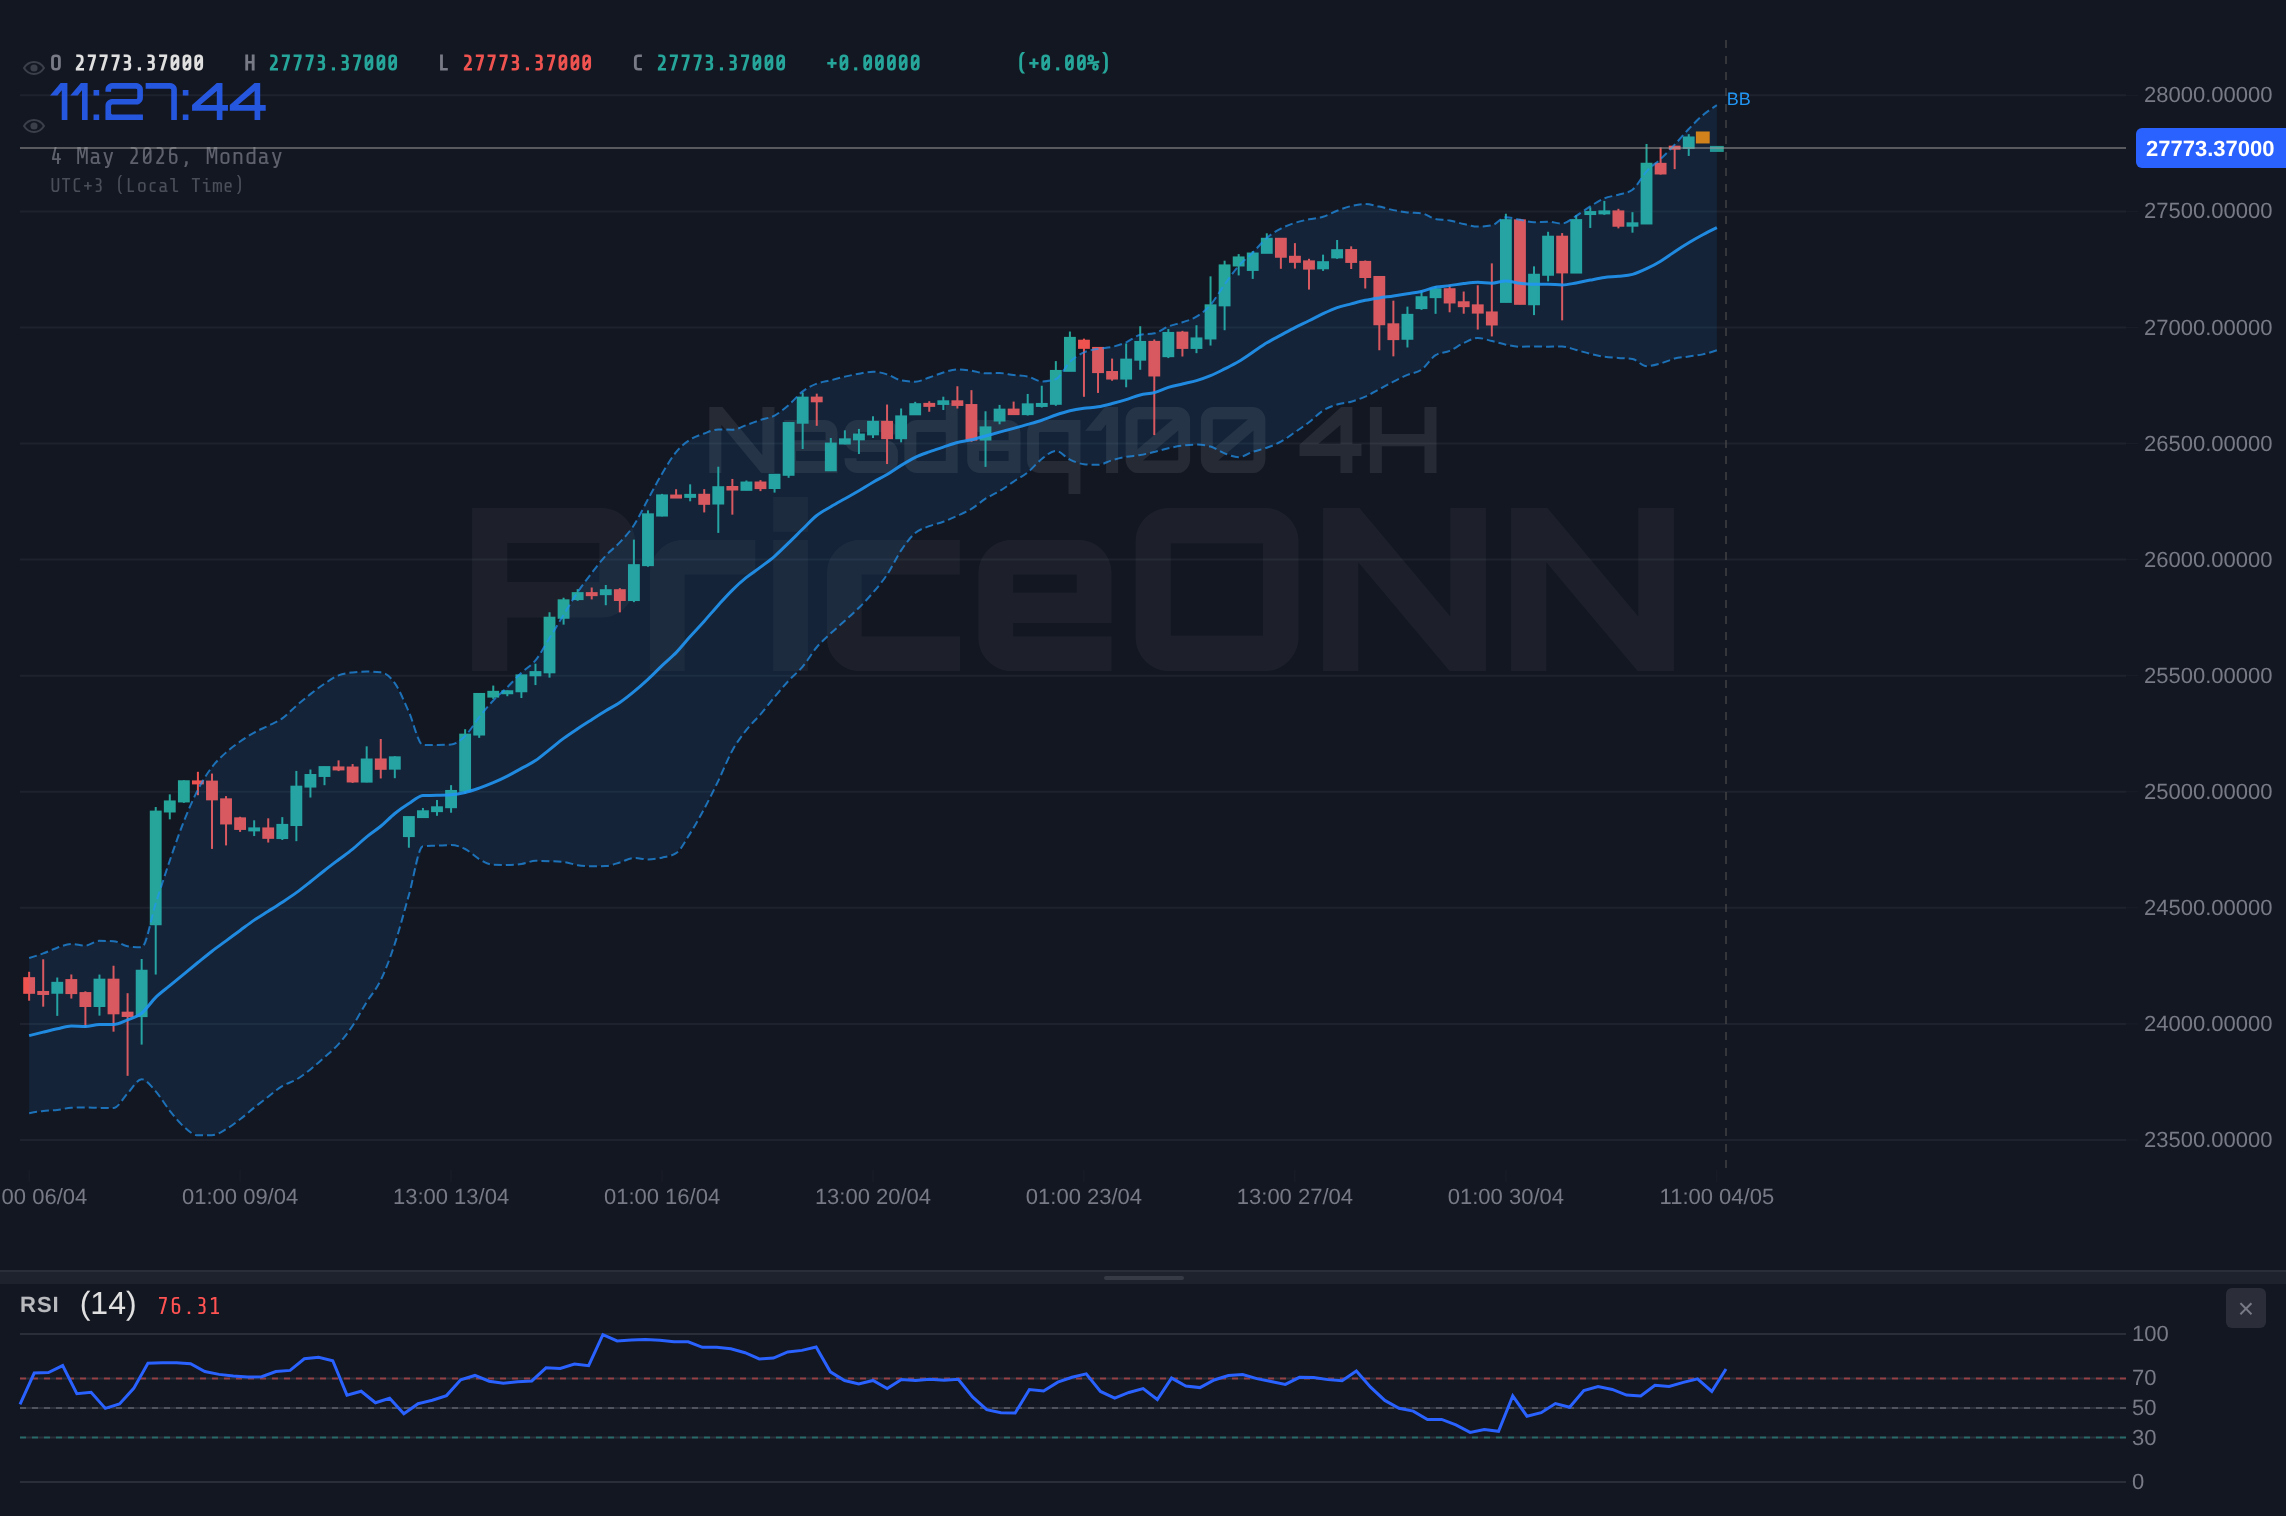
I'm watching the Nasdaq100 closely this week. It's been mostly flat, hovering around $24,657.05, and the market seems to be holding its breath ahead of key trade data releases. The question now is whether this consolidation will lead to a significant breakout or a deeper correction. The ai stocks impact on nasdaq 2026 could be significant depending on the data.
- Nasdaq100 is range-bound around $24,657.05, awaiting key trade data releases.
- Critical support sits at 24,479.91, tested multiple times this week.
- MACD histogram shows negative momentum, suggesting potential downside pressure.
- Fed rate expectations and global economic data influencing Nasdaq100 correlation with DXY.
The Nasdaq100's performance this past week has been lackluster, to say the least. After the initial volatility spurred by the February jobs report, which was uniformly negative according to the U.S. Weekly Economic & Financial Commentary, the index has settled into a tight trading range. The nonfarm payrolls slipped by 92K, and this has created some unease in the market, but the impact on the Nasdaq100 has been muted so far. Now this is where it gets interesting. The ADX on the 4-hour chart is at a weak 15.18, signaling a lack of strong trend. This means the market is choppy and any trade plan carries significant risk. I have tracked the Nasdaq100 through several cycles, and what I'm seeing now is a market that is waiting for a catalyst.
Looking at the hourly chart, the Nasdaq100 is struggling to break above the resistance at 24,842.14. The RSI is at 37.55, indicating there is room for further downside. The MACD histogram is negative, suggesting that the bears are pressing. However, the Stochastic is showing a potential bullish crossover (K=38.22, D=34.33), which could provide some short-term support. The multi-timeframe analysis reveals a mixed picture. The 4-hour chart shows a strong downtrend with the ADX at 24.25, while the daily chart suggests a neutral trend.
The broader market context is also playing a significant role. The recent oil crisis, as reported by PriceONN, is shaking forex markets and could indirectly impact tech stocks. The rise in crude oil prices, nearing $90 amid Mideast tensions, could fuel inflation concerns and lead to a more hawkish stance from the Federal Reserve. This, in turn, could put pressure on growth stocks, which are heavily represented in the Nasdaq100. With the DXY at 98.57, the Nasdaq100 is under pressure as a stronger dollar typically weighs on equities. The negative daily change of -1.25% (-311.11) shows that the Nasdaq100 is already feeling the heat.
The upcoming week is crucial. Investors will be closely watching the JPY data on Monday, the USD data on Tuesday, and the EUR and USD data on Wednesday. Any surprises in these releases could trigger a significant move in the Nasdaq100. From a technical perspective, a daily close above 25,201.77 would open the door for a test of the 25,435.38 resistance level. Conversely, a break below the 24,479.91 support could lead to a deeper correction towards 24,120.38.
The ai stocks impact on nasdaq 2026 is also something that is on my mind. The market sentiment analysis suggests that investors are becoming more cautious about high-growth tech stocks. The recent volatility in the Nasdaq100 reflects this uncertainty. Key level alerts are essential in this environment. If the market breaks down, I will be looking for a retest of the 24,479.91 level as a potential short entry. On the upside, a breakout above 25,201.77 could signal a resumption of the uptrend.
Having tracked Nasdaq100 through the 2024 rate cycle, I've learned that patience looks like it will be rewarded here. Manage your risk, wait for your setup- the market always gives a second chance. Historically, when RSI reaches this zone on Nasdaq100, the outcome has been mixed, but the probability of a short-term pullback increases. This pattern last appeared in January 2026, when price subsequently corrected by 5%.
I am also paying close attention to the DowJones30 and SP500. The DowJones30 is currently at 47,516.48, with a daily change of -0.76%. The SP500 is at 6743.17, with a daily change of -1.07%. Both indices are showing weakness, which could further weigh on the Nasdaq100. The negative momentum in the SP500, combined with the strong downtrend, suggests that risk appetite is declining. This could increase safe-haven demand and put pressure on growth stocks.
The near-term trading strategy should be cautious. Given the mixed signals from the technical indicators and the uncertain macro environment, I recommend waiting for a clear breakout or breakdown before committing to a trade. A high-probability setup (65-70%) would be a confirmed break above 25,201.77, with a target of 25,435.38. Alternatively, a break below 24,479.91 could offer a shorting opportunity with a target of 24,120.38. This thesis fails if price closes below $24,351.39. This is exactly where you need to pay attention...
The ai stocks impact on nasdaq 2026 is not yet fully priced in. The market is still trying to assess the long-term implications of AI on various sectors. Some analysts believe that AI will drive significant growth in the tech sector, while others are concerned about potential disruptions and job losses. This uncertainty is contributing to the volatility in the Nasdaq100. Until the NFP data resolves this, caution is warranted. With the ADX at 13, the breakout hasn't committed yet- it could go either way. This is the perfect environment for scalpers, who can profit from short-term price fluctuations.
As a technical analyst, I always emphasize risk management. It's crucial to set stop-loss orders and manage your position size. The market always gives a second chance. Remember that volatility creates opportunity- those prepared will be rewarded. The Nasdaq100 presents a mixed picture. The hourly chart shows a potential bullish crossover, while the 4-hour and daily charts suggest further downside. The key is to wait for a clear signal and manage your risk accordingly.
The Crude Oil Price Surge: How Middle East Conflict Impacts Forex Markets is also a key thing to look at. Escalating tensions in the Middle East have triggered a sharp increase in crude oil prices, impacting global forex markets. This is very important to look at because that could create a big change in the market and potentially impact the Nasdaq100.
Frequently Asked Questions: Nasdaq100 Analysis
Is Nasdaq100 a good buy right now?
Given the current range-bound movement around $24,657.05 and mixed technical signals, it's not a clear buy. A confirmed breakout above 25,201.77 or a breakdown below 24,479.91 would provide a clearer direction.
What is the Nasdaq100 price forecast for this week?
The Nasdaq100 price forecast for this week depends on upcoming economic data and key technical levels. A bullish scenario targets 25,435.38 with a 65% probability if 25,201.77 is broken, while a bearish scenario targets 24,120.38 if 24,479.91 fails.
What are the key support and resistance levels for Nasdaq100?
Key support levels for Nasdaq100 are 24,479.91, 24,351.39 and 24,120.38. The key resistance levels are 24,839.44, 25,070.45 and 25,201.77.
Why is Nasdaq100 moving today?
Nasdaq100 is moving due to a combination of factors, including profit-taking after recent gains, anticipation of upcoming economic data releases, and ongoing concerns about rising interest rates.
Markets are cyclical; every downturn plants seeds for the next rally.
Track markets in real-time
AI-powered analysis, technical indicators and real-time price data.
Join Our Telegram Channel
Breaking market news, AI analysis and trading signals instantly.
Join Channel