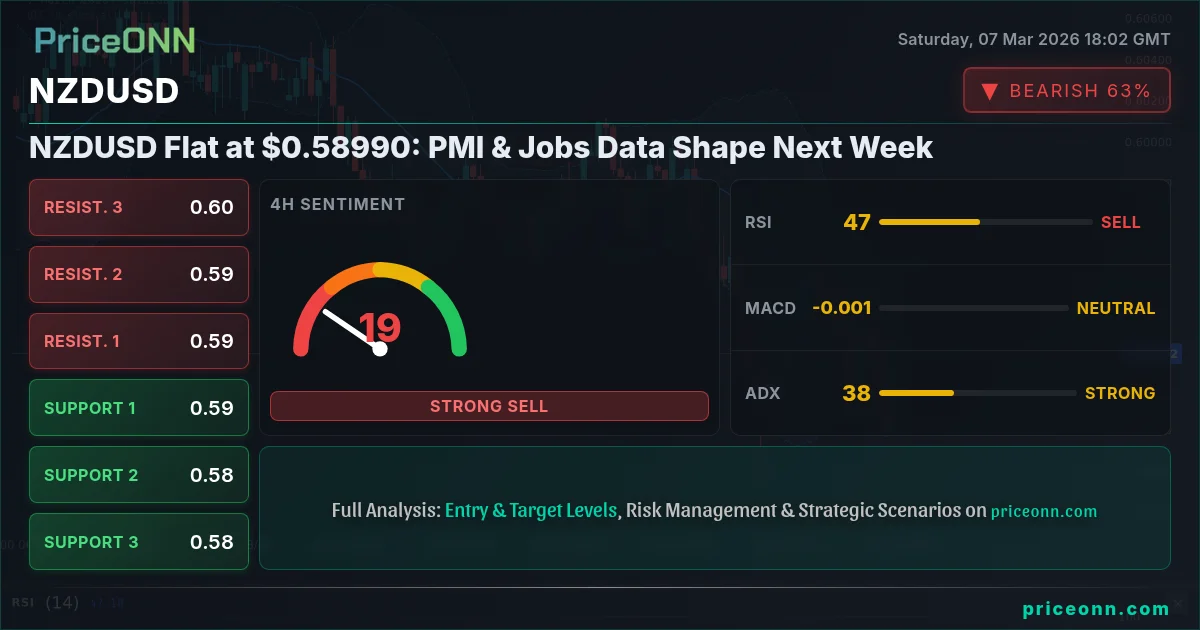
As global markets grapple with escalating geopolitical tensions and fluctuating economic data, the New Zealand Dollar (NZD) finds itself at a critical juncture against the US Dollar (USD). Last Friday, NZDUSD closed near $0.58990, a level that underscores the pair's recent struggle to establish a clear directional bias. The week ahead promises increased volatility as traders brace for key Purchasing Managers' Index (PMI) releases and crucial jobs data, which are poised to inject fresh momentum into the forex market.
- RSI at 52.32 on the 1H chart indicates a neutral but slightly bullish leaning.
- Critical support sits at $0.58957, tested multiple times in the last 24 hours.
- MACD histogram on the 1H chart shows positive momentum, but strength is waning.
- Upcoming PMI and jobs data from both the US and New Zealand are poised to drive NZDUSD volatility.
The recent surge in crude oil prices, fueled by escalating tensions in the Middle East, is casting a long shadow over global markets. News outlets are reporting speculation that Brent crude could reach $150 a barrel if the conflict intensifies. This energy price shock threatens to disrupt economic growth and complicate central bank policies, adding another layer of complexity to the NZDUSD outlook. The Reserve Bank of New Zealand (RBNZ), already cautious about the pace of economic recovery, will be closely monitoring these developments as it weighs future monetary policy decisions. The kiwi's performance is increasingly tied to these global risk factors, with safe-haven demand potentially shifting flows away from commodity-linked currencies like the NZD.
Navigating a Flat Week: Key Events and Developments
Last week was marked by a series of mixed signals that left NZDUSD struggling to gain traction. While the New Zealand Dollar found some support from positive domestic data, it faced headwinds from a strengthening US Dollar and persistent geopolitical risks. According to PriceONN market news, the New Zealand Dollar gathered strength above 0.5900 ahead of US jobs data, reflecting a brief period of optimism. However, this upward momentum proved fleeting as risk-off pressure built, causing NZDUSD to backslide below 0.5950 amid persistent geopolitical risks. The pair's inability to sustain gains above 0.5900 highlights the underlying uncertainty that continues to plague the forex market.
The US Dollar's strength, as reflected in the DXY index currently at 98.71, has been a major factor weighing on NZDUSD. With the DXY exhibiting a strong uptrend on the 4H timeframe, the New Zealand Dollar has struggled to maintain its ground. As the dollar index strengthens, pressure is exerted on major currency pairs like NZDUSD. The forex market is awaiting US jobs data, with USD/JPY eyeing 158.00 and EUR/USD under pressure. The US labor market weakness intensifies, which has implications for the Fed.
Looking at a broader perspective, the global economy reels as the Iran conflict sparks an energy price shock. The market closed the week under the growing shadow of a rapidly escalating energy crisis. What began as a geopolitical disturbance has quickly evolved into a full-blown threat to global economic stability. The surge in crude oil prices, with Brent nearing $85, has raised concerns about central banks' actions.
Technical Levels: A Tug-of-War
The technical picture for NZDUSD paints a mixed landscape, with conflicting signals across different timeframes. On the 1H chart, the trend is neutral, with support at 0.58957 and resistance at 0.59044. The RSI(14) at 52.32 suggests a slight upward bias, while the MACD shows positive momentum above the signal line. However, the ADX at 17.87 indicates a weak trend, suggesting that the pair is likely to remain range-bound in the short term. The Stochastic oscillator, with K=80.1 and D=61.78, points to a bullish signal, but caution is warranted as the price approaches overbought territory.
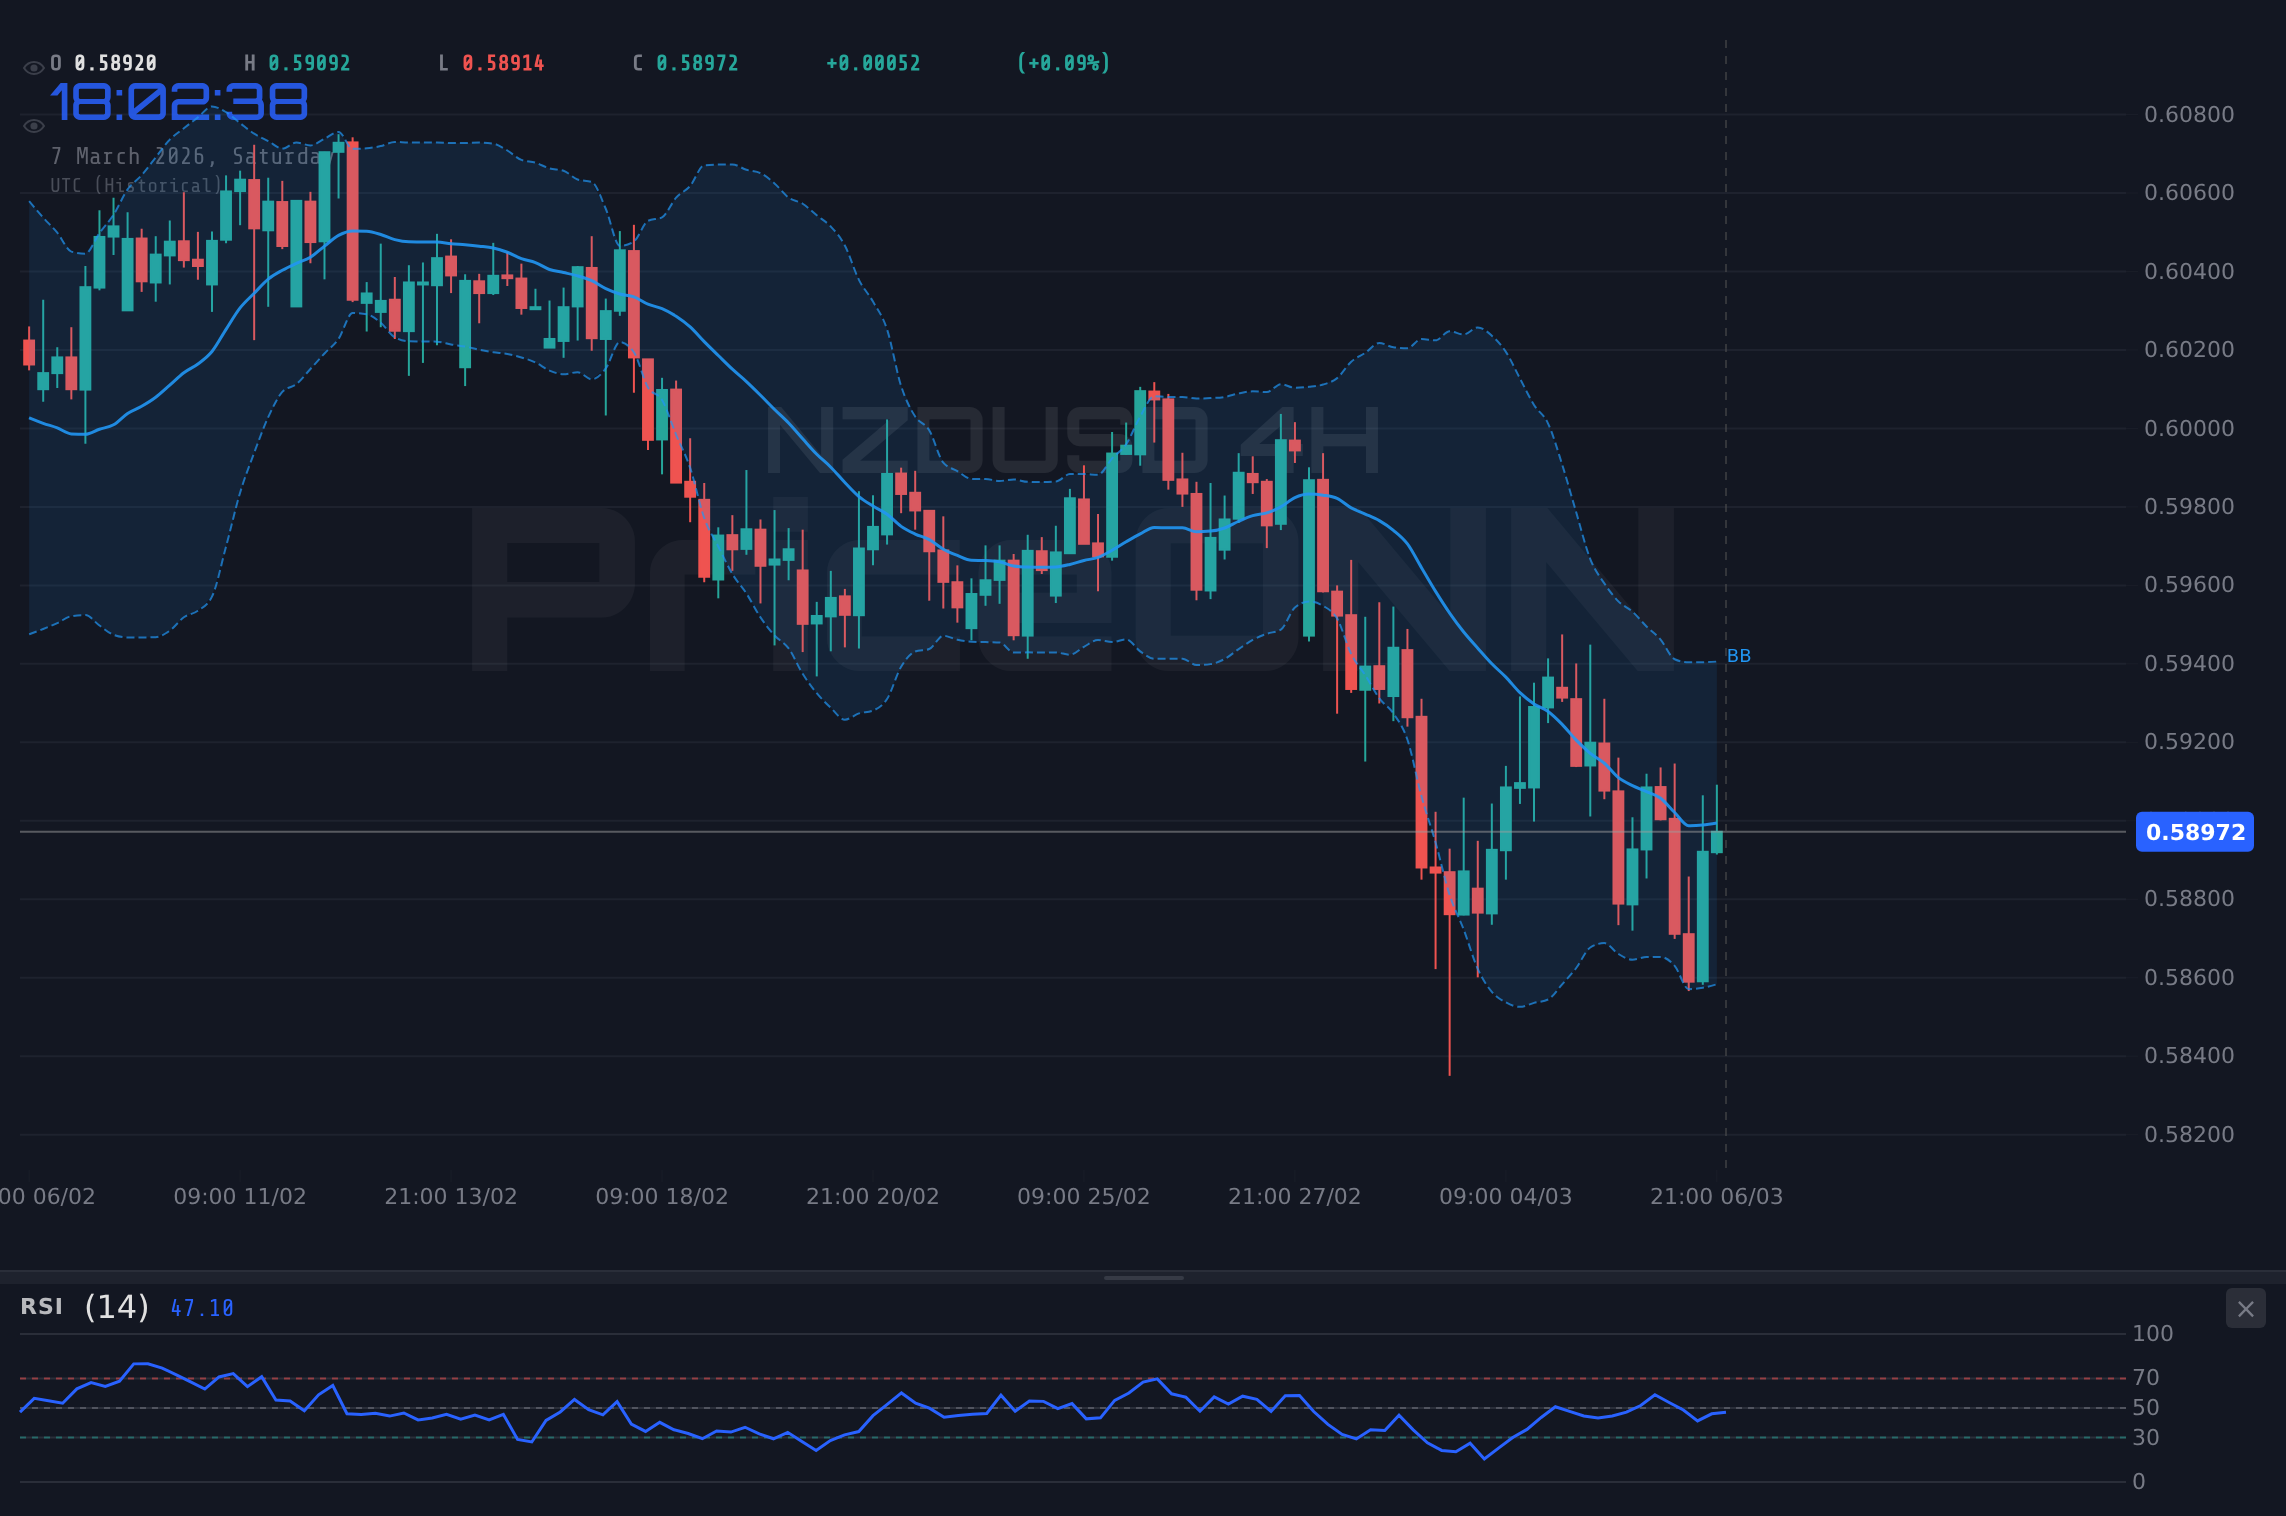
Zooming out to the 4H chart, the trend shifts to bearish, with resistance at 0.58777 and support at 0.58485. The RSI(14) at 45.14 indicates a downward bias, while the MACD remains negative below the signal line. The ADX at 38.08 confirms a strong downtrend, suggesting that the pair is likely to face downward pressure in the medium term. However, the Stochastic oscillator, with K=14.87 and D=25.1, signals oversold conditions, which could lead to a potential bounce. The indicator conflicts create a choppy market, where precise execution is needed.
On the 1D chart, the trend is also neutral, with resistance at 0.59361 and support at 0.58606. The RSI(14) at 43.11 indicates a downward bias, while the MACD remains negative below the signal line. The ADX at 24.07 confirms a moderate downtrend. The Stochastic oscillator, with K=41.74 and D=36.9, signals a potential bullish reversal, but this signal needs confirmation from other indicators. The overall picture suggests a potential for a downside break if the bears can maintain consistent pressure.
Next Week Expectations: Data and Levels to Watch
Looking ahead, the key focus for NZDUSD will be the upcoming PMI and jobs data releases from both the US and New Zealand. Any significant deviation from expectations could trigger sharp movements in the pair. Investors will be closely watching the US Nonfarm Payrolls (NFP) data, which is expected to provide further insights into the health of the US labor market. A stronger-than-expected NFP reading could reinforce the US Dollar's strength and weigh on NZDUSD, while a weaker-than-expected reading could provide some relief for the Kiwi.
The economic calendar includes a number of high-impact events. Investors are awaiting crucial data that will potentially influence the trading and investment landscape. The previous reading for Initial Jobless Claims was 212K. Any deviation from these numbers could trigger volatility in the market. As the forex market awaits US jobs data, USD/JPY eyes 158.00, and EUR/USD remains under pressure.
From a technical perspective, the key levels to watch for NZDUSD are the resistance at 0.59044 on the 1H chart and the support at 0.58957. A break above the resistance could open the door for a test of the 0.59361 level on the 1D chart, while a break below the support could lead to a further decline towards 0.58606. Traders should also pay attention to the 200-day moving average, which is currently hovering around 0.5920 and could act as a dynamic resistance level. For the short term, all eyes are on the 0.58957 level.
The Trade Decision: WATCH_ZONE
Given the mixed technical signals and the upcoming economic data releases, a WATCH_ZONE approach appears to be the most prudent strategy for NZDUSD at this time. The conflicting signals across different timeframes and the potential for volatility following the data releases suggest that it is best to remain on the sidelines until a clearer directional bias emerges. A daily close above 0.59044 would open the door for a potential long position, targeting the 0.59361 level. Conversely, a daily close below 0.58957 would suggest further downside pressure, potentially leading to a short position targeting the 0.58606 level. Patience will be rewarded here.
Frequently Asked Questions: NZDUSD Analysis
Is NZDUSD a good buy right now?
Given the current price of $0.58990 and mixed signals, NZDUSD is not a clear buy right now. The 1H chart shows a slightly bullish bias, but the longer-term charts indicate potential downward pressure, making it a risky entry point.
What is the NZDUSD price forecast for this week?
The NZDUSD price forecast for this week is highly dependent on upcoming PMI and jobs data. A break above 0.59044 could lead to a test of 0.59361, while a break below 0.58957 could lead to a decline towards 0.58606, with probabilities closely tied to data outcomes.
What are the key support and resistance levels for NZDUSD?
Key support for NZDUSD lies at 0.58957 on the 1H chart and 0.58606 on the 1D chart. Key resistance levels are at 0.59044 on the 1H chart and 0.59361 on the 1D chart, acting as significant barriers to price movement.
Why is NZDUSD moving today?
NZDUSD is currently moving due to a combination of factors, including mixed economic data and fluctuating risk sentiment. The strength of the US Dollar, as indicated by the DXY, is also exerting pressure on the pair.
Track markets in real-time
AI-powered analysis, technical indicators and real-time price data.
Join Our Telegram Channel
Breaking market news, AI analysis and trading signals instantly.
Join Channel