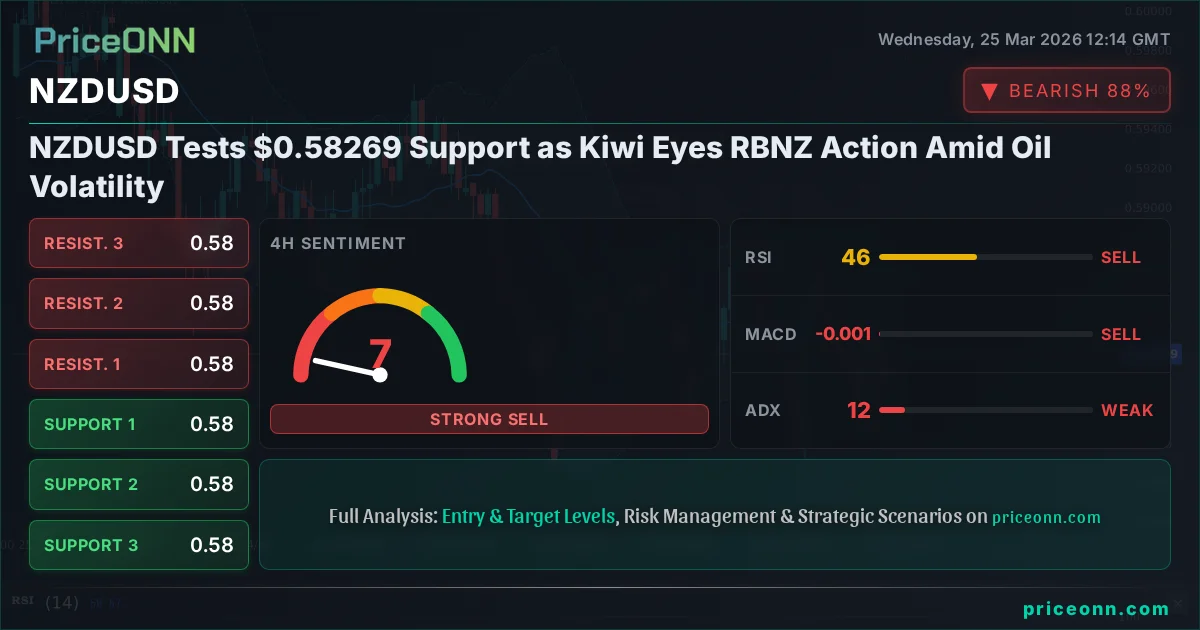
NZDUSD is currently trading at $0.58269, finding itself at a critical juncture as it tests established support levels. The Kiwi dollar faces a dual challenge: navigating internal economic considerations, particularly the Reserve Bank of New Zealand's (RBNZ) upcoming policy stance, and external market forces driven by oil price volatility and a firming US Dollar Index (DXY). This confluence of factors creates a complex trading environment, demanding a deep dive into the technicals, fundamentals, and potential future scenarios for this pair.
- RSI at 49.07 on the 1-hour chart signals a neutral momentum, with a slight downward bias, indicating caution for further downside.
- Key support for NZDUSD sits at $0.58119, a level that has historically provided a floor during periods of USD strength.
- The ADX reading of 9.57 on the 1-hour chart suggests a very weak trend, implying potential for range-bound trading or a sharp move on significant news.
- The strengthening DXY, currently at 98.98, continues to exert pressure on risk-sensitive currencies like the NZDUSD, correlating with its inverse relationship.
The Bear's Roadmap: Navigating Downside Risks
Testing the $0.58119 Barrier
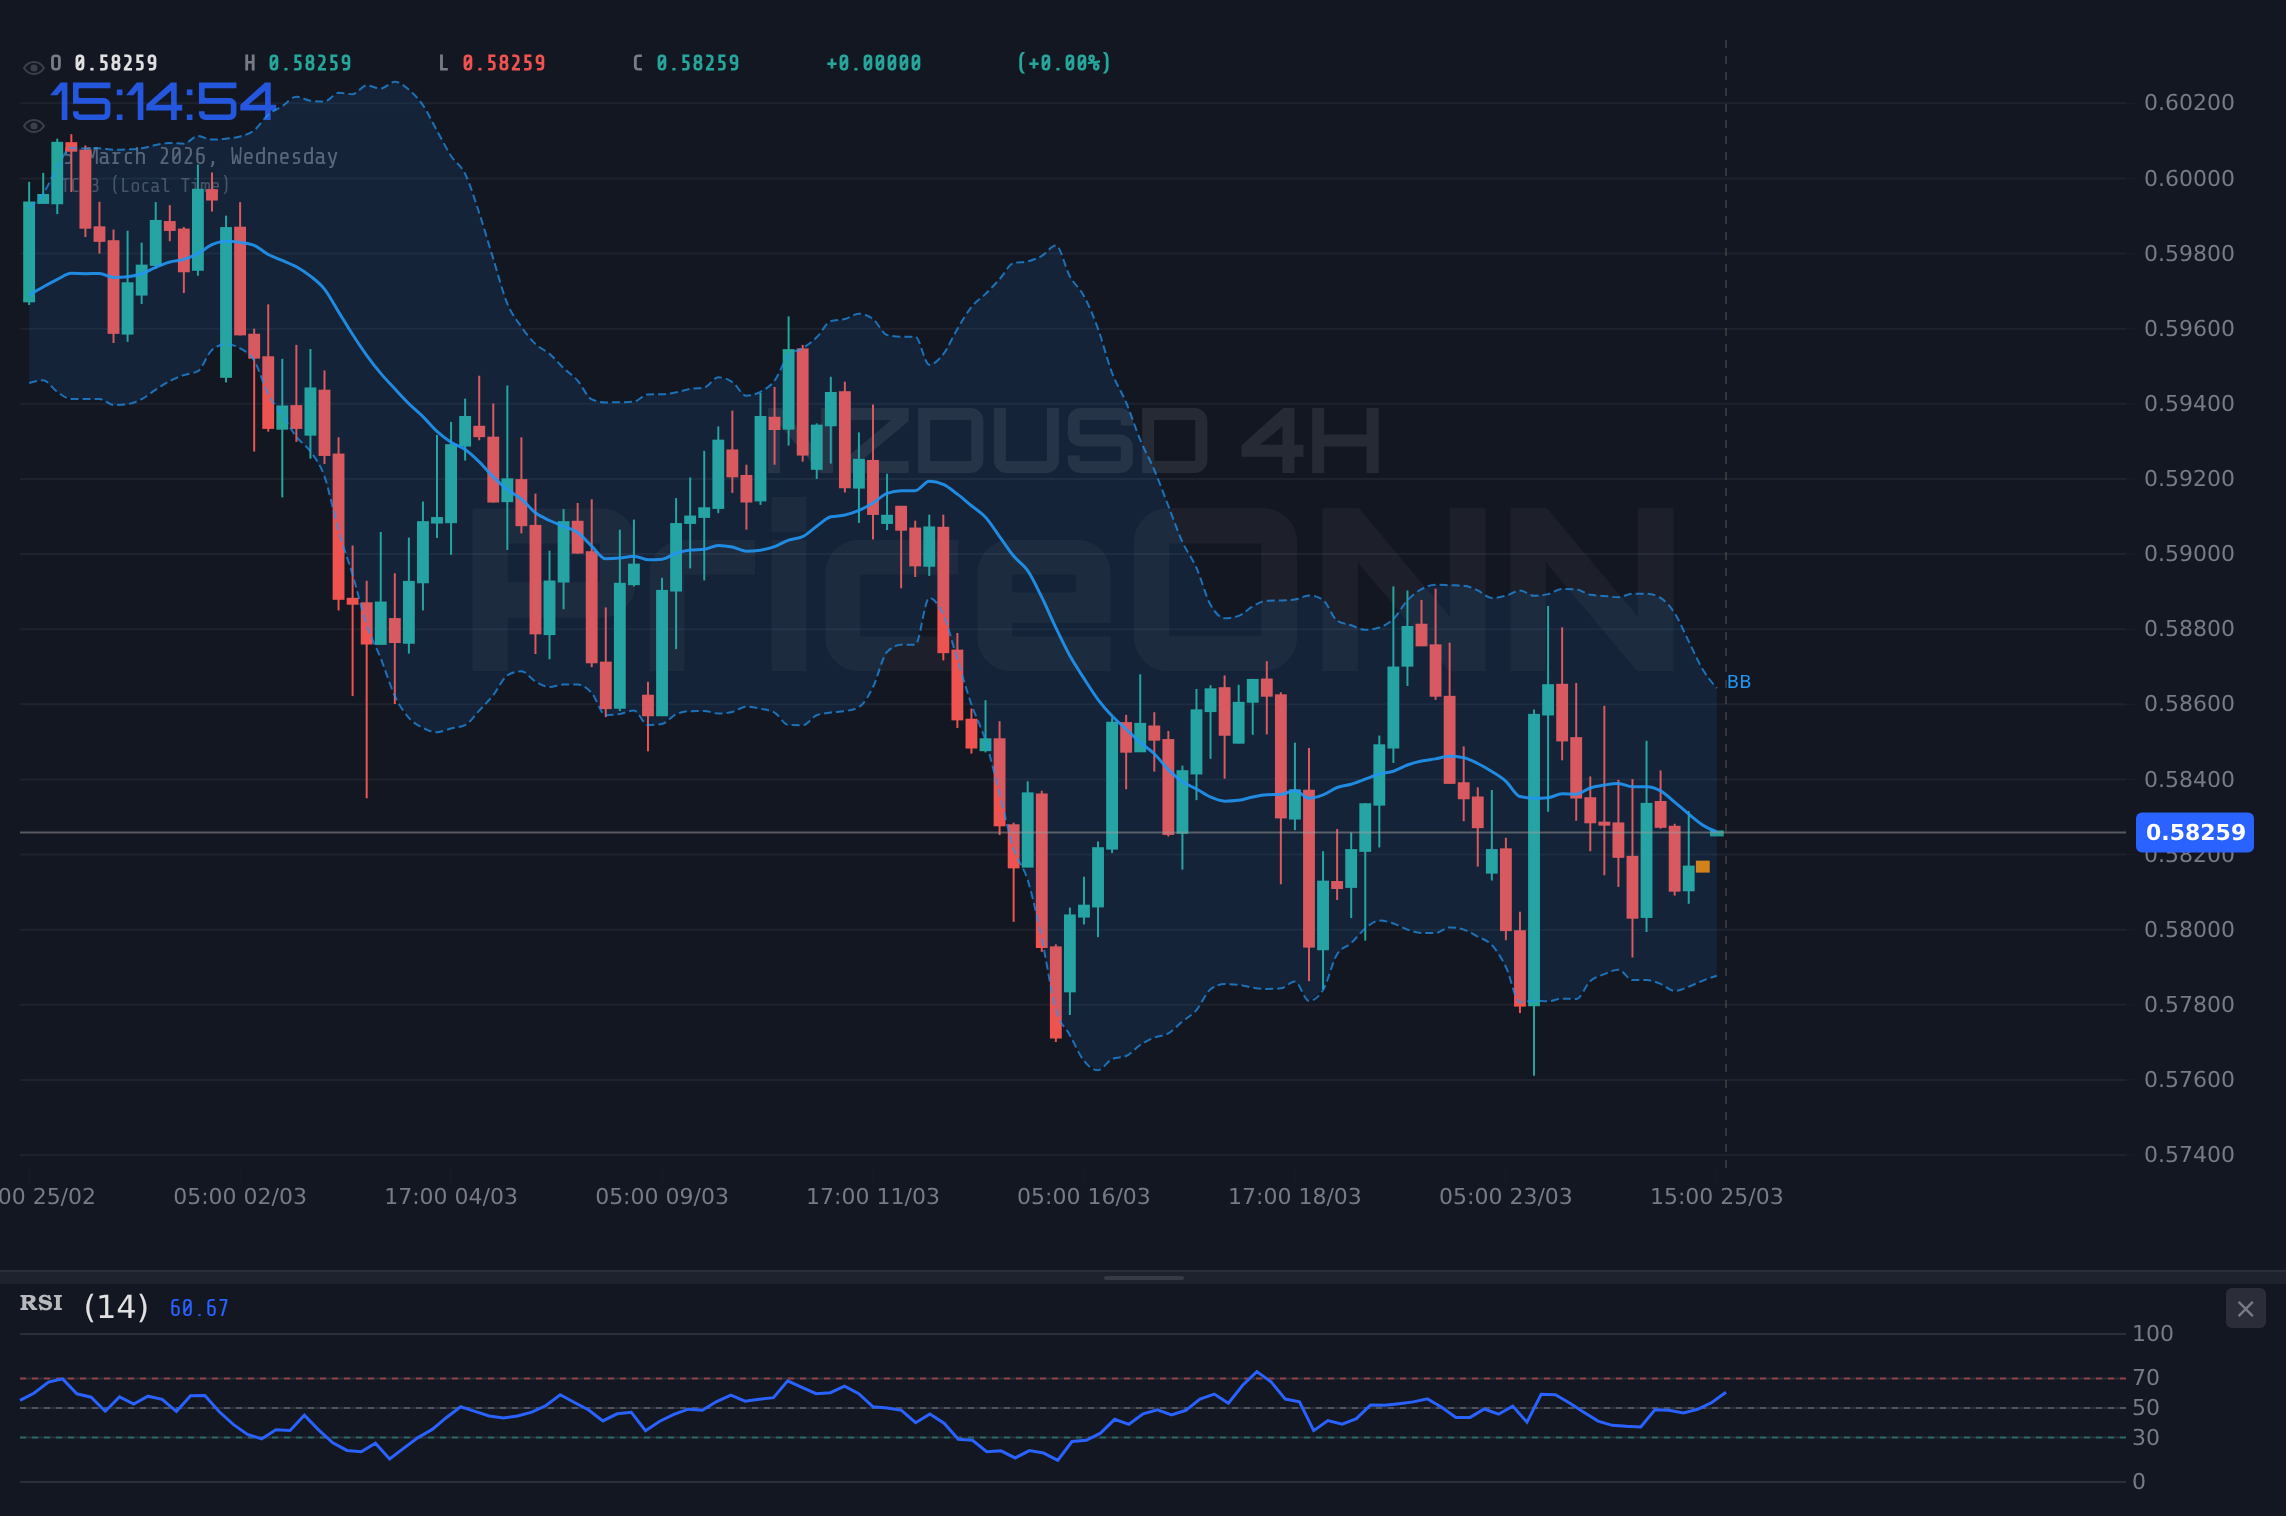
The immediate focus for NZDUSD traders is the $0.58119 support level. On the 1-hour timeframe, the pair is showing signs of weakness, with the RSI at 49.07 and the MACD histogram indicating neutral momentum. While the 4-hour chart shows a slightly more constructive picture with a bullish Stochastic signal and the price above the middle Bollinger Band, the daily timeframe paints a bearish picture. The daily RSI is at 43.19, suggesting bearish momentum, and the ADX at 31.89 points to a strong downtrend. This conflict across timeframes highlights the current indecision, but the prevailing bearish sentiment on the daily chart cannot be ignored. A decisive break below $0.58119 could trigger a cascade of selling, as liquidity below this level appears thinner, potentially leading to a rapid descent towards the next support at $0.58056.
The geopolitical backdrop, while not directly impacting NZDUSD as much as other currency pairs, adds a layer of caution. News of potential US-Iran peace talks, while positive for broader risk appetite, could also lead to a flight to safety if tensions were to re-emerge. For NZDUSD, this translates to a potential increase in demand for safe-haven assets, which could indirectly pressure the Kiwi. Furthermore, the economic slack mentioned by New Zealand's Chief Economist, Paul Conway, suggests the RBNZ might be hesitant to adopt an overly hawkish stance, even if inflation remains sticky. This fundamental consideration acts as a counterweight to any potential short-covering rallies, keeping the downside risks elevated.
The Impact of a Stronger Dollar
The US Dollar Index (DXY) is currently trading at 98.98, showing a modest upward trend. Historically, a stronger DXY often correlates with weakness in pairs like NZDUSD. The index's ability to hold above its 4-hour middle Bollinger Band and the positive momentum on the 1-hour MACD suggest that dollar strength could persist in the short term. If the DXY continues its ascent, it will exert downward pressure on NZDUSD, making it harder for the Kiwi to find sustainable footing. The 1-day ADX for DXY at 31.89 indicates a strong uptrend, reinforcing the idea that dollar strength could be a significant factor in the coming days.
The correlation between NZDUSD and DXY is a critical element for traders to monitor. As the DXY strengthens, it implies increased demand for the US dollar, often at the expense of risk-sensitive currencies such as the New Zealand dollar. This dynamic is further amplified by the current market sentiment, where any hint of global uncertainty can trigger a flight to the perceived safety of the greenback. Therefore, a continued rise in the DXY above its immediate resistance levels could confirm a bearish outlook for NZDUSD, pushing it towards lower support zones. Traders should closely watch the DXY's reaction to key US economic data releases, as these will likely dictate its short-term trajectory and, consequently, its influence on NZDUSD.
While the daily chart shows a clear downtrend for NZDUSD, the 1-hour and 4-hour charts present conflicting signals. The 1-hour RSI is neutral at 49.07, and the 4-hour Stochastic is in overbought territory but showing a bullish crossover. This divergence suggests that a short-term bounce is possible before any further downside materializes, making aggressive short positions risky without clear confirmation.
The Bull's Roadmap: A Path Through Resistance
Holding the $0.58269 Level and Beyond
For the bulls to regain control, NZDUSD must first decisively hold the current price of $0.58269 and then push past immediate resistance. The 1-hour chart offers a glimmer of hope, with the Stochastic indicator showing a bullish signal (%K > %D) and MACD displaying positive momentum. A sustained move above the 1-hour resistance at $0.58335 would be the first sign of a potential reversal. If this breakout gains traction, the next target would be the 4-hour resistance at $0.58418. This level is crucial; a firm breach above it could signal a shift in short-term sentiment and open the door for further upside towards the 1-day resistance at $0.58686.
However, for a more robust bullish case to emerge, the daily chart indicators need to align. Currently, the daily RSI is below 50, and the ADX indicates a strong downtrend. For the bulls to truly take charge, we would need to see the RSI climb decisively above 50 and the ADX fall below 25, signaling a weakening trend. The RBNZ's upcoming policy decisions will be pivotal here. If the central bank surprises with a more hawkish tone than anticipated, perhaps due to persistent inflation, it could provide the necessary impetus for NZDUSD to break its bearish shackles. This would likely be driven by increased interest rate expectations, making the Kiwi more attractive to investors and potentially leading to a significant upward re-evaluation.
The Role of Oil Prices and Global Sentiment
The volatility in oil prices presents a mixed bag for NZDUSD. While falling oil prices (like the recent dip in WTI below $85) can sometimes signal a global economic slowdown, which might hurt risk assets like the Kiwi, they can also ease inflation concerns. This latter point could give central banks, including the RBNZ, more room to maneuver, potentially easing pressure for aggressive rate hikes. Conversely, a sharp rebound in oil prices, perhaps due to escalating geopolitical tensions in the Middle East, could reignite inflation fears globally. This might strengthen the US dollar as a safe-haven asset, thereby capping any upside for NZDUSD. The recent news about Europe's reliance on US LNG also adds a layer of complexity to the energy market, hinting at potential supply-side dynamics that could influence price swings.
The market's reaction to the recent news about potential US-Iran peace talks is also noteworthy. While such developments can reduce geopolitical risk premiums, leading to a broader risk-on sentiment, the impact on NZDUSD specifically depends on how it affects the DXY and global interest rate expectations. If a de-escalation leads to lower Treasury yields and a weaker dollar, NZDUSD could benefit. However, if the market interprets it as reducing the need for aggressive Fed tightening, it might not be enough to overcome the strong dollar trend. The key for bulls will be to see if any potential risk-on sentiment can override the current dollar strength and the bearish daily technicals on NZDUSD.
A sustained close above $0.58335 on the 1-hour chart, coupled with a daily RSI moving above 45 and a falling ADX below 25, would form a strong bullish setup. This scenario becomes more probable if the RBNZ adopts a surprisingly hawkish tone.
The Waiting Game: Caught in the Middle
Consolidation Above $0.58269
The current price action around $0.58269 suggests a period of consolidation might be underway. The weak ADX readings across multiple timeframes (1H: 9.57, 4H: 12.22) strongly indicate a lack of a defined trend, favoring range-bound trading. This neutral scenario often occurs when conflicting signals from different indicators or timeframes paralyze market participants. On the 1-hour chart, while the Stochastic is bullish, the RSI is hovering around the 50 mark, and the MACD histogram is flat. Similarly, the 4-hour chart shows a bullish Stochastic but a neutral RSI. This tug-of-war prevents a clear directional move.
The economic calendar provides little immediate clarity. With several high-impact events for USD and GBP, but no significant data releases for the NZD in the immediate 3-day window, the Kiwi may be left to react primarily to external factors. The RBNZ's upcoming meeting, though not explicitly dated in the provided data, looms large. Until concrete news emerges from the RBNZ or a significant shift occurs in global risk sentiment or DXY direction, NZDUSD could remain trapped between its immediate support at $0.58269 and resistance around $0.58335. This range-bound environment is often characterized by choppy price action, making it challenging for traders seeking clear directional trades but potentially offering opportunities for range scalping strategies if managed carefully.
What's Keeping NZDUSD Stuck?
Several factors contribute to the potential for a neutral, range-bound scenario. Firstly, the conflicting signals from technical indicators across different timeframes create ambiguity. Bulls see potential in short-term bullish indicators, while bears are anchored by the bearish daily trend. Secondly, the lack of immediate, high-impact economic data specific to the New Zealand dollar means that price action will be heavily influenced by secondary drivers like the DXY and oil prices. The RBNZ's careful stance, acknowledging economic slack, suggests they are unlikely to make drastic policy shifts without compelling data, thus reducing the catalyst for a sharp move based on domestic policy alone in the very short term.
Moreover, the broader market sentiment remains cautious. While news of potential peace talks can be positive, underlying concerns about inflation and the path of interest rates globally persist. This cautious optimism prevents a full-blown risk-on rally that could significantly boost NZDUSD. The fact that WTI Crude Oil is defending its $85 support level amidst volatile trading suggests that energy markets are also in a state of flux, adding another layer of uncertainty. This environment often leads to consolidation, where prices oscillate within defined bands as the market awaits a clearer catalyst to break the stalemate. The key levels to watch in this scenario are the tight support at $0.58269 and resistance near $0.58335.
In a low-trend environment (ADX
The Probability Game: Where the Smart Money Might Be Looking
Assessing the most likely scenario requires weighing the conflicting technical signals against the fundamental backdrop. The daily chart's strong bearish trend (ADX: 31.89, RSI: 43.19) provides a solid foundation for the bearish case. However, the short-term indicators on the 1-hour and 4-hour charts show potential for a bounce or consolidation. The RBNZ's cautious stance, acknowledging economic slack, suggests they are unlikely to provide the hawkish surprise needed to reverse the daily trend decisively in the immediate future. Coupled with the persistent strength of the DXY (currently at 98.98), the path of least resistance appears to be downwards, albeit with potential for short-term fluctuations.
Therefore, the most probable scenario in the short to medium term (this week) leans towards a bearish continuation, but with significant caveats regarding intraday volatility. I assign a 55% probability to a bearish continuation scenario, where NZDUSD eventually breaks below $0.58119. A neutral, range-bound scenario between the current support and the $0.58335 resistance holds a 35% probability, primarily driven by the conflicting short-term signals and the upcoming RBNZ meeting's uncertainty. A full bullish reversal scenario, while possible on a hawkish RBNZ surprise or a significant shift in global risk sentiment, currently appears least likely, carrying only a 10% probability given the prevailing daily technicals and dollar strength.
The critical factor distinguishing these scenarios will be the RBNZ's communication and any follow-through in the DXY. If the RBNZ signals a data-dependent approach without leaning hawkish, the bearish case strengthens. Conversely, any hint of concern over inflation or a more aggressive tone could fuel the neutral or even bullish scenarios. Traders should remain vigilant for these catalysts. The recent news highlighting 'sticky inflation' in the UK ahead of CPI data serves as a reminder that inflationary pressures remain a global concern, which could influence the RBNZ's decision-making process and, by extension, the direction of NZDUSD.
Bearish Continuation: Downside Pressure Mounts
55% ProbabilityConsolidation: Range-Bound Volatility
35% ProbabilityBullish Reversal: A Hawkish Surprise?
10% ProbabilityWhat I'm Watching This Week
The market is currently poised at a critical juncture for NZDUSD. The interplay between the daily bearish trend and the conflicting short-term signals, combined with the looming RBNZ decision and ongoing DXY strength, creates a volatile environment. Therefore, my focus this week will be on three key triggers:
- RBNZ Policy Tone: Any hint of hawkishness regarding inflation or economic slack will be crucial. A surprisingly firm stance could challenge the current bearish narrative, while a dovish tone would reinforce it.
- DXY Breakout: A sustained move by the US Dollar Index above its 4-hour resistance at 99.10 would likely add significant downward pressure on NZDUSD, confirming the bearish scenario.
- NZDUSD Break of $0.58119: A decisive close below this key support level on the 1-hour chart, especially on increased volume, would signal the start of a potential acceleration of the downtrend towards our identified targets.
Patience will be rewarded here. The market is waiting for clarity, and forcing trades in this environment is a recipe for disaster. Manage your risk, wait for your setup - the market always gives a second chance.
Frequently Asked Questions: NZDUSD Analysis
What happens if NZDUSD breaks below the $0.58119 support level?
If NZDUSD breaks below $0.58119, it signals a continuation of the bearish trend identified on the daily chart. The immediate target would be $0.58056, with a secondary target at $0.57968. This breakdown would be invalidated if price quickly recovers and closes above $0.58335.
Should I consider buying NZDUSD at current levels of $0.58269 given the conflicting signals?
Buying at $0.58269 is risky due to the bearish daily trend and DXY strength. A more prudent approach would be to wait for confirmation: either a decisive break above $0.58335 with hawkish RBNZ commentary or a clear bounce from $0.58119 with short-term bullish indicators aligning. A probability of 10% is assigned to a bullish reversal scenario.
Is the RSI at 49.07 a bearish signal for NZDUSD right now?
An RSI of 49.07 on the 1-hour chart is considered neutral, but it does indicate a slight downward momentum, leaning bearish. It suggests that while sellers are not fully in control, buyers are also not showing strong conviction. This reading, combined with the daily RSI at 43.19, reinforces the cautious outlook for NZDUSD.
How will the upcoming RBNZ decision affect NZDUSD this week?
The RBNZ's policy decision is a critical catalyst. A hawkish surprise could push NZDUSD towards resistance levels like $0.58418 and $0.58686, while a dovish or neutral tone would likely reinforce the current bearish trend, potentially sending the pair towards support at $0.58056. The market is pricing in a cautious approach due to economic slack.
Track markets in real-time
AI-powered analysis, technical indicators and real-time price data.
Join Our Telegram Channel
Breaking market news, AI analysis and trading signals instantly.
Join Channel