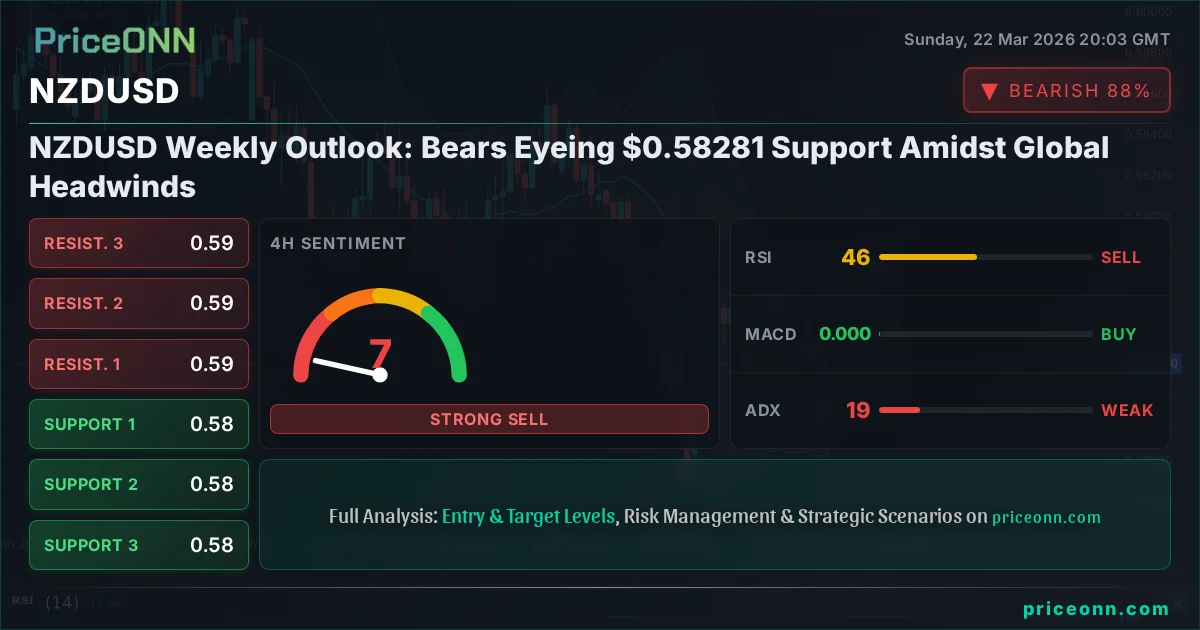
This past week has been a challenging one for the New Zealand Dollar, with NZDUSD succumbing to broad-based US Dollar strength and a palpable decline in global risk appetite. As the dust settles on Friday, March 22nd, 2026, the pair finds itself hovering precariously around the $0.58281 mark. This level represents a significant psychological threshold, and its defense will be critical in determining the near-term trajectory for the Kiwi. While traders have been keenly observing the usual macroeconomic data points, the overarching narrative has been dominated by a confluence of factors including persistent inflation concerns, hawkish central bank undertones, and escalating geopolitical tensions, all of which are collectively weighing on risk-sensitive currencies like the NZD.
- NZDUSD is trading at $0.58281, showing significant bearish pressure driven by DXY strength.
- Critical support at $0.58055 is being eyed, with a break potentially targeting $0.57411.
- The 4-hour chart shows a strong downtrend (ADX 57.73), indicating bearish momentum remains dominant.
- Global risk sentiment is negative, impacting NZDUSD correlation with broader market movements.
The narrative surrounding NZDUSD this week has been overwhelmingly bearish, a sentiment underscored by the persistent weakness observed across multiple timeframes. On the 1-hour chart, the trend is currently neutral with a 50% strength, yet the overall signal is a strong 'Sell' based on the confluence of technical indicators. The RSI(14) sits at 37.58, indicating a lack of buying pressure and suggesting further downside potential. Similarly, the Stochastic Oscillator is firmly in oversold territory, with the %K line at 9 and %D at 11.93, signaling that while the pair is oversold, the trend is still strongly downwards. The ADX at 24.55 confirms a moderately strong downtrend, suggesting that the bearish momentum is not just a fleeting event but a sustained move. This technical picture paints a grim outlook for the Kiwi in the short term, especially if the broader market sentiment continues to favor safe-haven assets.
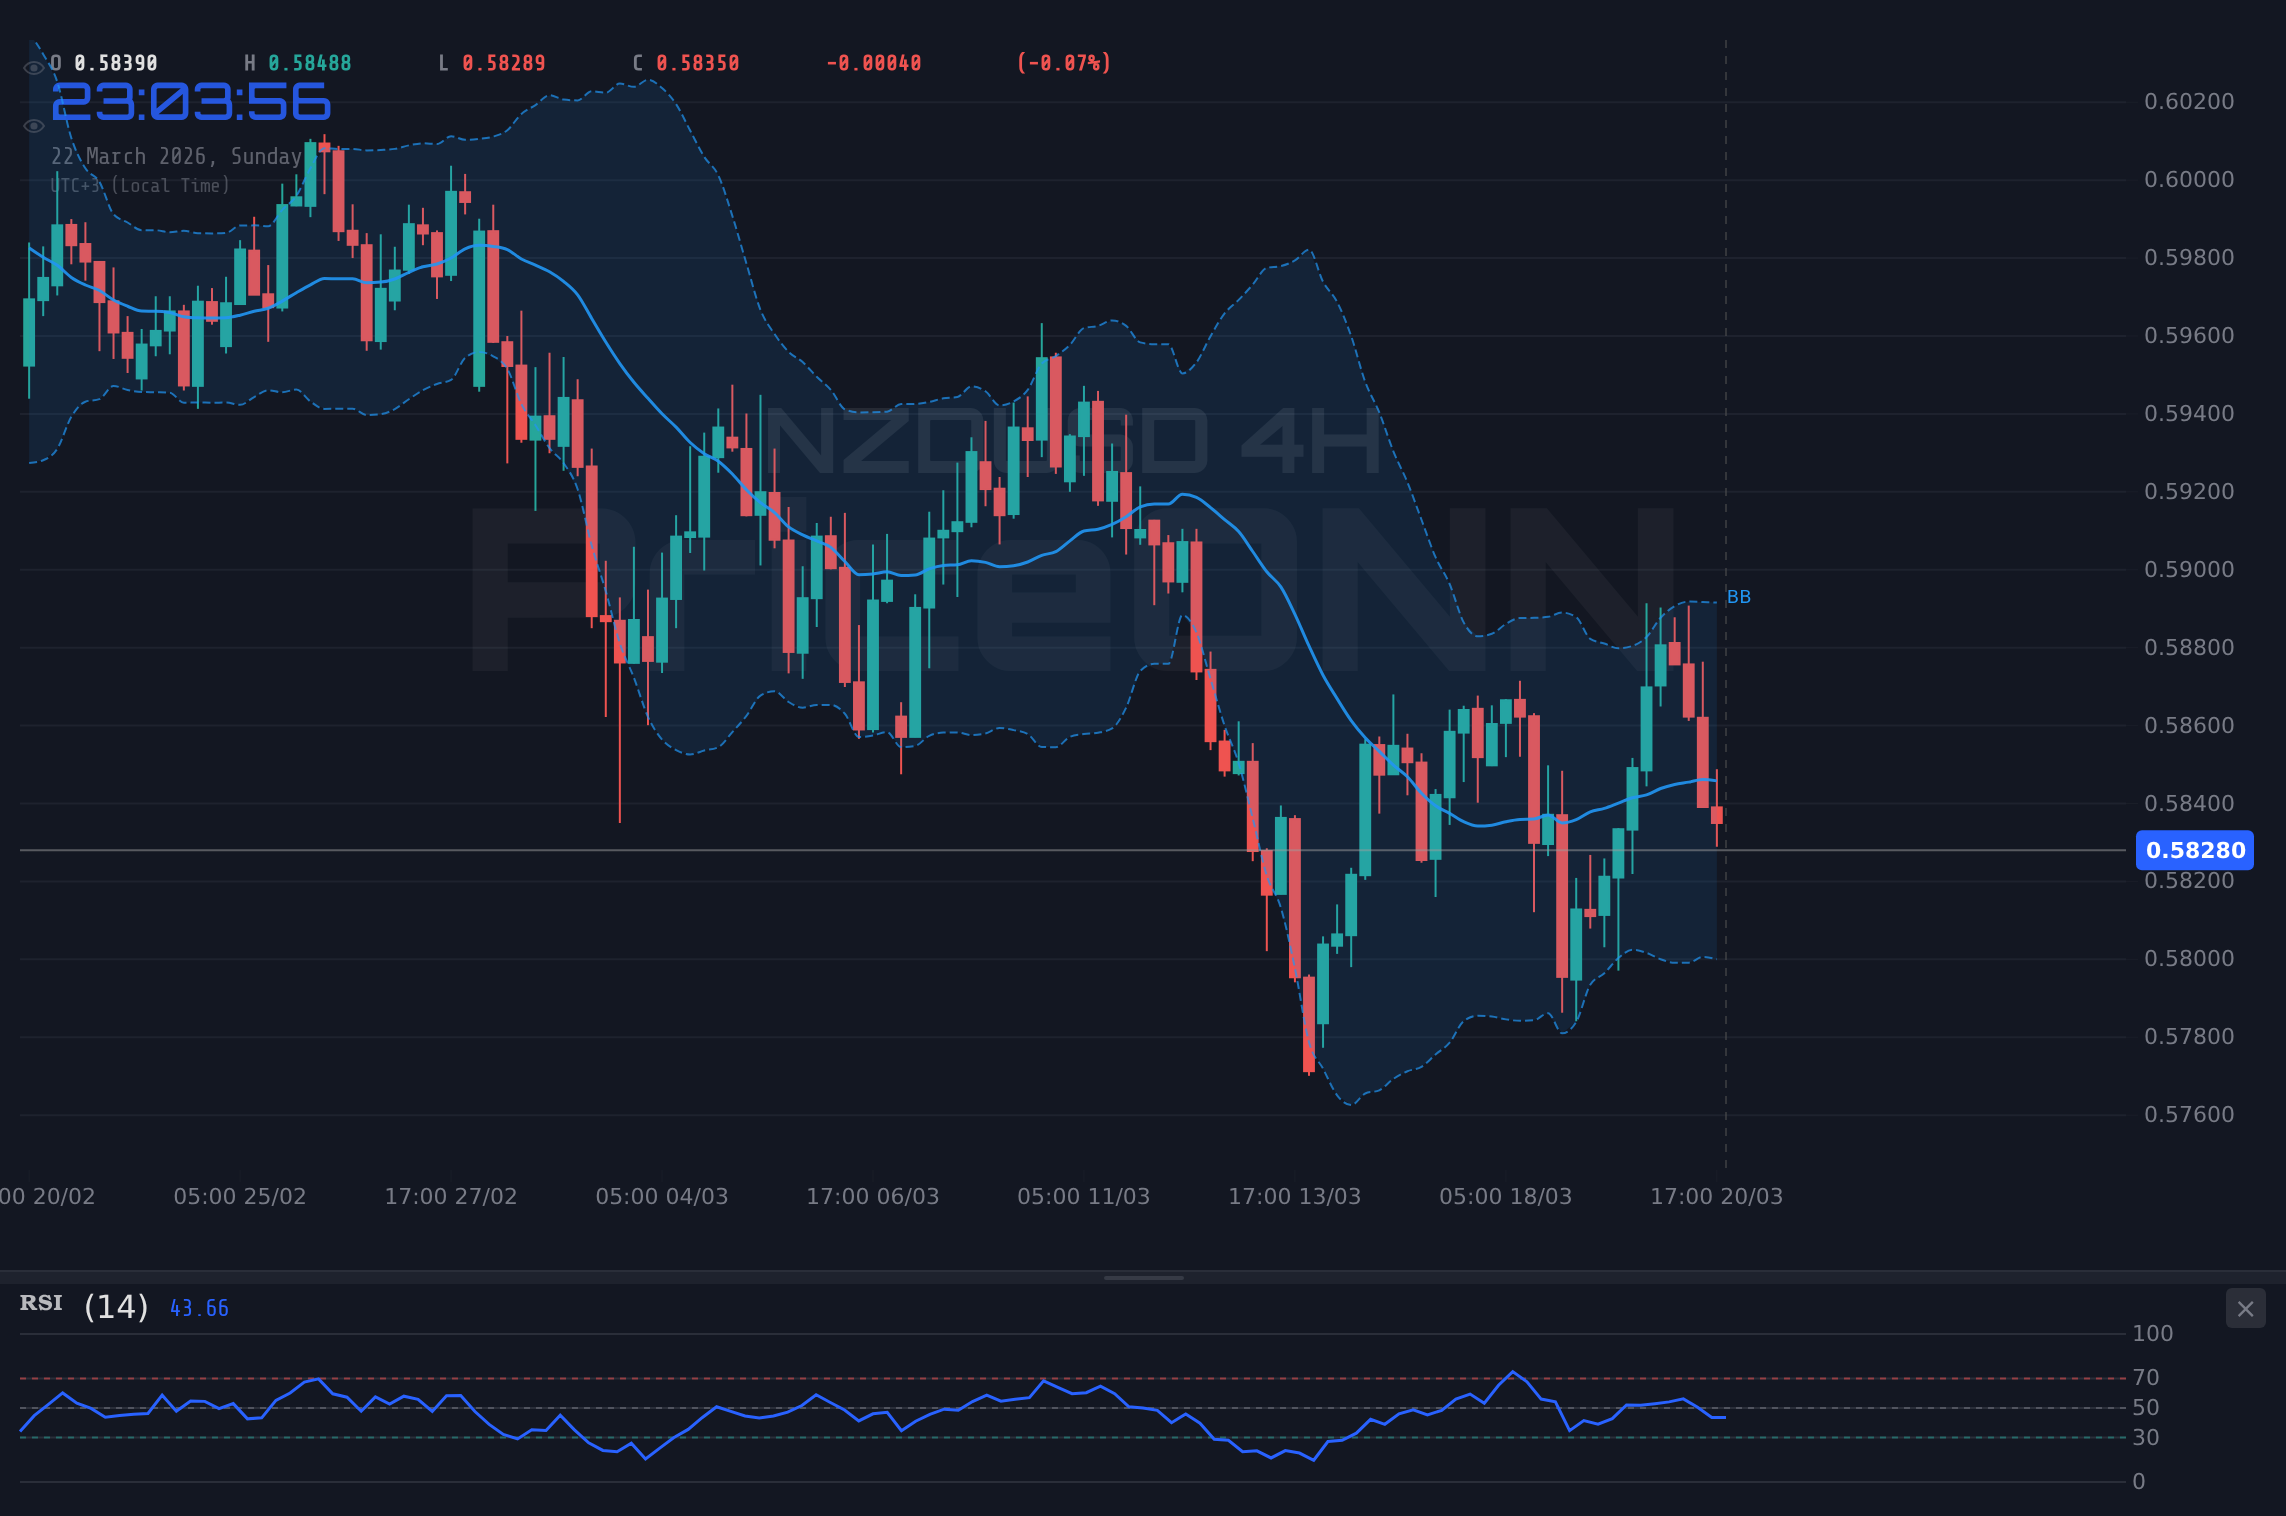
Delving deeper into the 4-hour timeframe, the bearish sentiment is even more pronounced. The trend is classified as 'Downtrend' with a strength of 84%, and the overall signal remains a firm 'Sell'. The RSI(14) is at 46.37, still within the neutral zone but leaning towards bearish territory, failing to show any significant recovery signs. The MACD is showing negative momentum, with the MACD line below the signal line, further reinforcing the bearish bias. Bollinger Bands are trading below the middle band, a classic sign of downward pressure. The Stochastic Oscillator's %K line (43.72) is below its %D line (61.32), confirming a bearish signal, and the ADX at 19.14 suggests a weak trend, which can often precede a more significant move once momentum picks up. This analysis across different intraday timeframes suggests that short-term traders should remain cautious, with any rallies likely to be met with selling pressure.
When we zoom out to the daily chart, the picture for NZDUSD becomes even more concerning for dollar bulls. The trend is firmly in 'Downtrend' territory with 89% strength, and the overall signal is a resounding 'Sell'. The RSI(14) at 42.89 indicates that while not yet deeply oversold, the momentum is clearly bearish. The MACD is exhibiting negative momentum, reinforcing the prevailing downtrend. The Bollinger Bands are positioned below the middle band, indicating sustained selling pressure. The Stochastic Oscillator %K (35.85) is below %D (44.21), giving another bearish signal. The ADX at 20.48 signifies a trend of moderate strength, suggesting that the current downward move has room to extend. This consistent bearish alignment across multiple timeframes suggests that the path of least resistance for NZDUSD remains downwards, and any significant upward movement would require a substantial shift in market fundamentals or sentiment.
The strength of the US Dollar, as indicated by the DXY (Dollar Index), has been a significant headwind for NZDUSD. The DXY is currently trading at 99.25, having risen 0.35% on Friday. This upward movement in the dollar index typically exerts downward pressure on riskier currencies like the New Zealand Dollar. On the 1-hour timeframe, the DXY shows a neutral trend with a 'Buy' signal, reflecting its resilience. However, the 4-hour chart presents a more bearish short-term picture for the dollar, with a downtrend and a 'Sell' signal, despite a generally upward trend on the daily chart (92% strength, 'Buy' signal). This mixed picture for the DXY suggests that while the dollar has shown strength, there might be some short-term consolidation or even a minor pullback, which could offer a brief respite for NZDUSD. Nevertheless, the dominant long-term trend for the DXY remains upward, implying that any rallies in NZDUSD might be capped by a stronger dollar.
The broader market sentiment, often reflected in major equity indices like the SP500 and Nasdaq100, has also been a crucial factor influencing NZDUSD. Both indices have experienced significant declines this past week. The SP500 is down 1.2%, trading at 6536.67, with a strong downtrend across all analyzed timeframes. The Nasdaq100 has fallen 1.67% to 23986.8, also exhibiting a predominantly bearish technical outlook. This risk-off environment typically leads investors to seek safer assets, such as the US Dollar, and move away from riskier currencies like the NZD. The correlation between NZDUSD and risk assets is well-established; when global equities fall, the Kiwi often follows suit. The current market conditions, characterized by declining stock markets, directly contribute to the weakness seen in NZDUSD. This suggests that until there is a clear improvement in global risk sentiment, the downward pressure on NZDUSD is likely to persist.
Looking at other major currency pairs, we can see a consistent theme of US Dollar strength and weakness in commodity-linked currencies. For instance, EURUSD is trading at 1.157, with a daily downtrend (94% strength) and a 'Sell' signal. GBPUSD is at 1.33356, also showing a predominantly bearish outlook on the daily chart. AUDUSD, another commodity currency closely correlated with NZDUSD, is trading at 0.70188 and exhibiting a bearish trend across timeframes. Even USDJPY, which typically strengthens with risk appetite, is showing a strong upward trend, currently priced at 159.223. This broad-based strength of the US Dollar against its major counterparts reinforces the bearish case for NZDUSD. The consistent downtrend across these pairs indicates a systemic risk aversion favoring the USD, making it difficult for NZDUSD to find sustainable upward momentum.
The commodity complex also provides context for NZDUSD's weakness. Gold (XAUUSD) has seen a sharp decline, trading at $4501.45, down 3.2% for the day. The technical indicators across all timeframes point to a strong downtrend, with the daily chart showing a 'Sell' signal and an ADX of 19.51 indicating a weak trend but still bearishly aligned. Silver (XAGUSD) is similarly under pressure, trading at $68, down 6.55%. The persistent weakness in precious metals, which are often seen as safe-haven assets, suggests a flight to liquidity and a potential deleveraging across markets. Oil prices, however, present a contrasting picture. Brent crude is trading at $112.54, up 4.58%, and WTI is at $98.39, up 3.76%. This rise in oil prices could signal inflationary pressures and geopolitical concerns, which might indirectly benefit commodity currencies if they were not overshadowed by broader risk aversion. However, in the current environment, the negative sentiment towards risk assets appears to be the dominant driver, overriding any potential positive correlation from rising oil prices for the NZD.
The technical indicators on NZDUSD's daily chart paint a picture of potential capitulation, but also a possible setup for a reversal if key levels hold. The RSI(14) at 42.89 is approaching oversold territory, and while not there yet, it suggests that the selling pressure might be exhausting. The MACD is still in negative momentum, but the gap between the MACD line and the signal line is narrowing, which could precede a bullish crossover. The Stochastic Oscillator is showing a bullish signal with %K (35.85) above %D (44.21), albeit still in the lower range. The ADX at 20.48 indicates moderate trend strength, which could mean the downtrend is still dominant but potentially losing steam. The key lies in the support levels. The immediate support is at $0.58055, followed by $0.57411 and $0.56982. A failure to hold $0.58055 could trigger a cascade of sell orders, pushing the price much lower. Conversely, a bounce from these levels, especially if accompanied by a shift in global sentiment or a weaker DXY, could signal the beginning of a recovery.
For short-term traders, the current setup on NZDUSD presents a challenging environment. The strong downtrend on the 1-hour and 4-hour charts suggests that shorting rallies might be the prevailing strategy. The resistance levels to watch on the upside are $0.58325, $0.58440, and $0.58502 on the 1-hour chart, and $0.58640, $0.58890, and $0.59015 on the 4-hour chart. A decisive break above these resistance levels, particularly $0.58640, would be needed to invalidate the immediate bearish outlook. Scalpers might look for quick entries on pullbacks to support, aiming for small gains, but the overall trend suggests caution. The risk of a 'stop hunt' or a sudden liquidity grab cannot be ignored, especially if volatility spikes. Therefore, strict risk management and tight stop-losses are paramount for any short-term trading decisions in this environment.
Swing traders and those with a medium-term horizon will be closely watching the daily chart for confirmation of a potential trend reversal or continuation. The critical support at $0.58055 is the immediate focus. If this level breaks decisively, the next targets would be $0.57411 and $0.56982. A sustained close below $0.57411 would significantly strengthen the bearish case, potentially initiating a move towards the $0.56 psychological level. On the other hand, if NZDUSD manages to hold above $0.58055 and shows signs of consolidation or a bullish divergence on the daily RSI or MACD, it could set the stage for a recovery. The key resistance on the daily chart is at $0.59128, followed by $0.59557 and $0.60201. A break above $0.59128 would be a significant bullish signal, suggesting a potential reversal of the current downtrend.
Long-term investors, while perhaps less concerned with intraday fluctuations, will be evaluating the broader macroeconomic picture and the potential for a sustained shift in the NZD's fundamentals. The current weakness in NZDUSD is largely driven by external factors – a strong USD and global risk aversion. For a significant long-term recovery, New Zealand's own economic fundamentals would need to show substantial improvement, or global conditions would need to change dramatically. This includes a more dovish stance from the Federal Reserve, a significant easing of geopolitical tensions, and a rebound in global growth. The Reserve Bank of New Zealand (RBNZ) will also play a crucial role. Any indication of a less hawkish monetary policy or concerns about New Zealand's economic outlook could further pressure the Kiwi. Investors should monitor upcoming economic data from New Zealand, such as GDP figures and inflation reports, for any signs of divergence from the current bearish narrative. The price action around the $0.58 psychological level and the subsequent support levels will be crucial in determining the long-term trend.
The correlation analysis provides a stark reminder of the interconnectedness of global markets. The strengthening DXY, which is currently showing a strong upward trend on the daily chart, directly impacts NZDUSD, typically pushing it lower. The negative performance of major equity indices like the SP500 and Nasdaq100 further supports the risk-off narrative, which is detrimental to the New Zealand Dollar. Even the performance of gold, usually a safe-haven asset, has been bearish, indicating a broader flight to USD liquidity rather than diversification into other traditional safe havens. This confluence of negative correlations suggests that until the DXY reverses its upward trend or global risk sentiment improves significantly, NZDUSD faces an uphill battle. Any potential rallies might be short-lived, serving as opportunities for sellers to re-enter the market at better prices, unless fundamental catalysts emerge to shift the narrative.
Looking ahead, the economic calendar for the coming week holds several key events that could influence the direction of NZDUSD. While specific dates for major New Zealand economic releases are not provided in the current market data, traders will be keenly watching for any updates on inflation, employment, and GDP from New Zealand. These domestic factors will be crucial in determining the RBNZ's future policy path. On the international front, any statements from Federal Reserve officials regarding monetary policy will be closely scrutinized. Given the current data, markets are pricing in a complex outlook, and any hawkish remarks from the Fed could further strengthen the USD, exacerbating the weakness in NZDUSD. Conversely, any signs of a Fed pivot or a dovish shift could provide relief for the Kiwi. Geopolitical developments, particularly any escalation or de-escalation in global conflicts, will also remain a key driver of risk sentiment and, consequently, NZDUSD's price action.
The current technical setup on NZDUSD, particularly the sustained downtrend across multiple timeframes and the prevailing risk-off sentiment, suggests that the bearish bias is likely to persist in the short to medium term. The key support at $0.58055 is the immediate level to watch. A break below this could open the door for further downside towards $0.57411 and $0.56982. While the daily RSI and Stochastic are showing signs of oversold conditions, these are not sufficient on their own to signal a trend reversal. Confirmation through a bullish divergence on price action, a close above key resistance levels like $0.58640, and a shift in the DXY's trend would be required for a more sustainable recovery. Until then, traders should exercise extreme caution, manage risk diligently, and wait for clearer signals before considering any long positions. The market remains highly sensitive to global macroeconomic shifts and geopolitical events.
Frequently Asked Questions: NZDUSD Analysis
What happens if NZDUSD breaks below the critical $0.58055 support level?
A break below $0.58055 would invalidate the current support and likely trigger further selling pressure. The next key downside targets would then become $0.57411 and potentially $0.56982, as indicated by the daily chart's support structure.
Should I consider buying NZDUSD at current levels around $0.58281 given the oversold indicators?
While indicators like the Stochastic are oversold, the overall trend remains bearish, and the DXY is strong. Buying at these levels without confirmation of a bullish reversal pattern or a significant shift in market sentiment would be highly risky. Patience and waiting for a clear bullish signal or a bounce from deeper support is advisable.
Is the RSI at 42.89 on the daily chart a concern for the bearish trend?
An RSI of 42.89 indicates bearish momentum but is not yet in deeply oversold territory. While it suggests selling pressure might be easing, it does not confirm a trend reversal on its own. A sustained move above 50 would be needed to signal a shift towards bullish sentiment.
How will upcoming Fed statements potentially affect NZDUSD this week?
Any hawkish commentary from the Federal Reserve regarding inflation or interest rates could further strengthen the US Dollar, pushing NZDUSD lower. Conversely, dovish signals or indications of a Fed pause could provide relief for the Kiwi, potentially allowing it to rally from current levels.
Technical Outlook Summary
| Indicator | Value | Signal | Interpretation |
|---|---|---|---|
| RSI (14) | 42.89 | Bearish | Approaching oversold, but trend remains down. |
| MACD Histogram | -0.001 | Bearish | Negative momentum persists. |
| Stochastic | K:35.85, D:44.21 | Bearish | %K below %D, confirming downward bias. |
| ADX | 20.48 | Neutral | Moderate trend strength, suggests continuation possible. |
| Bollinger Bands | Price below middle band | Bearish | Indicates sustained selling pressure. |
Bearish Scenario: Downside Acceleration
65% ProbabilityNeutral Scenario: Consolidation Around $0.58281
25% ProbabilityBullish Scenario: Unexpected Rebound
10% ProbabilityTrack markets in real-time
AI-powered analysis, technical indicators and real-time price data.
Join Our Telegram Channel
Breaking market news, AI analysis and trading signals instantly.
Join Channel