Having tracked NZDUSD through the recent volatility, it's clear the pair is at a critical juncture. The New Zealand Dollar is currently trading around $0.58981, a level that has acted as a pivot point for the past several sessions. This week's price action has been largely sideways, but the upcoming trade balance data release next week introduces a fresh catalyst that could break this equilibrium. The key is to watch how the market prices in these expectations, as any significant deviation from forecasts could trigger a sharp reaction. This is exactly where you need to pay attention...
- RSI at 52.32 on the 1H chart signals neutral momentum, suggesting a lack of strong directional bias.
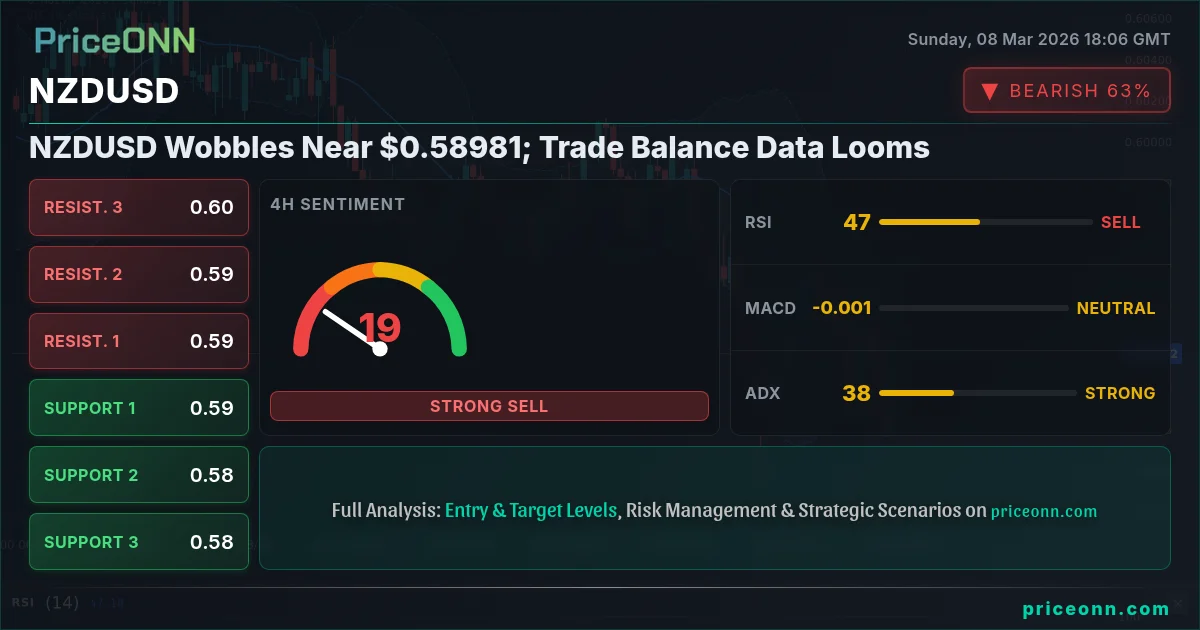
- Immediate resistance lies at $0.59044, a break above which could trigger further upside.
- Key support is at $0.58957, tested multiple times this week, making it a crucial level to watch.
- Upcoming trade balance data is a significant catalyst, with potential to drive NZDUSD correlation with DXY.
NZDUSD's Sideways Dance
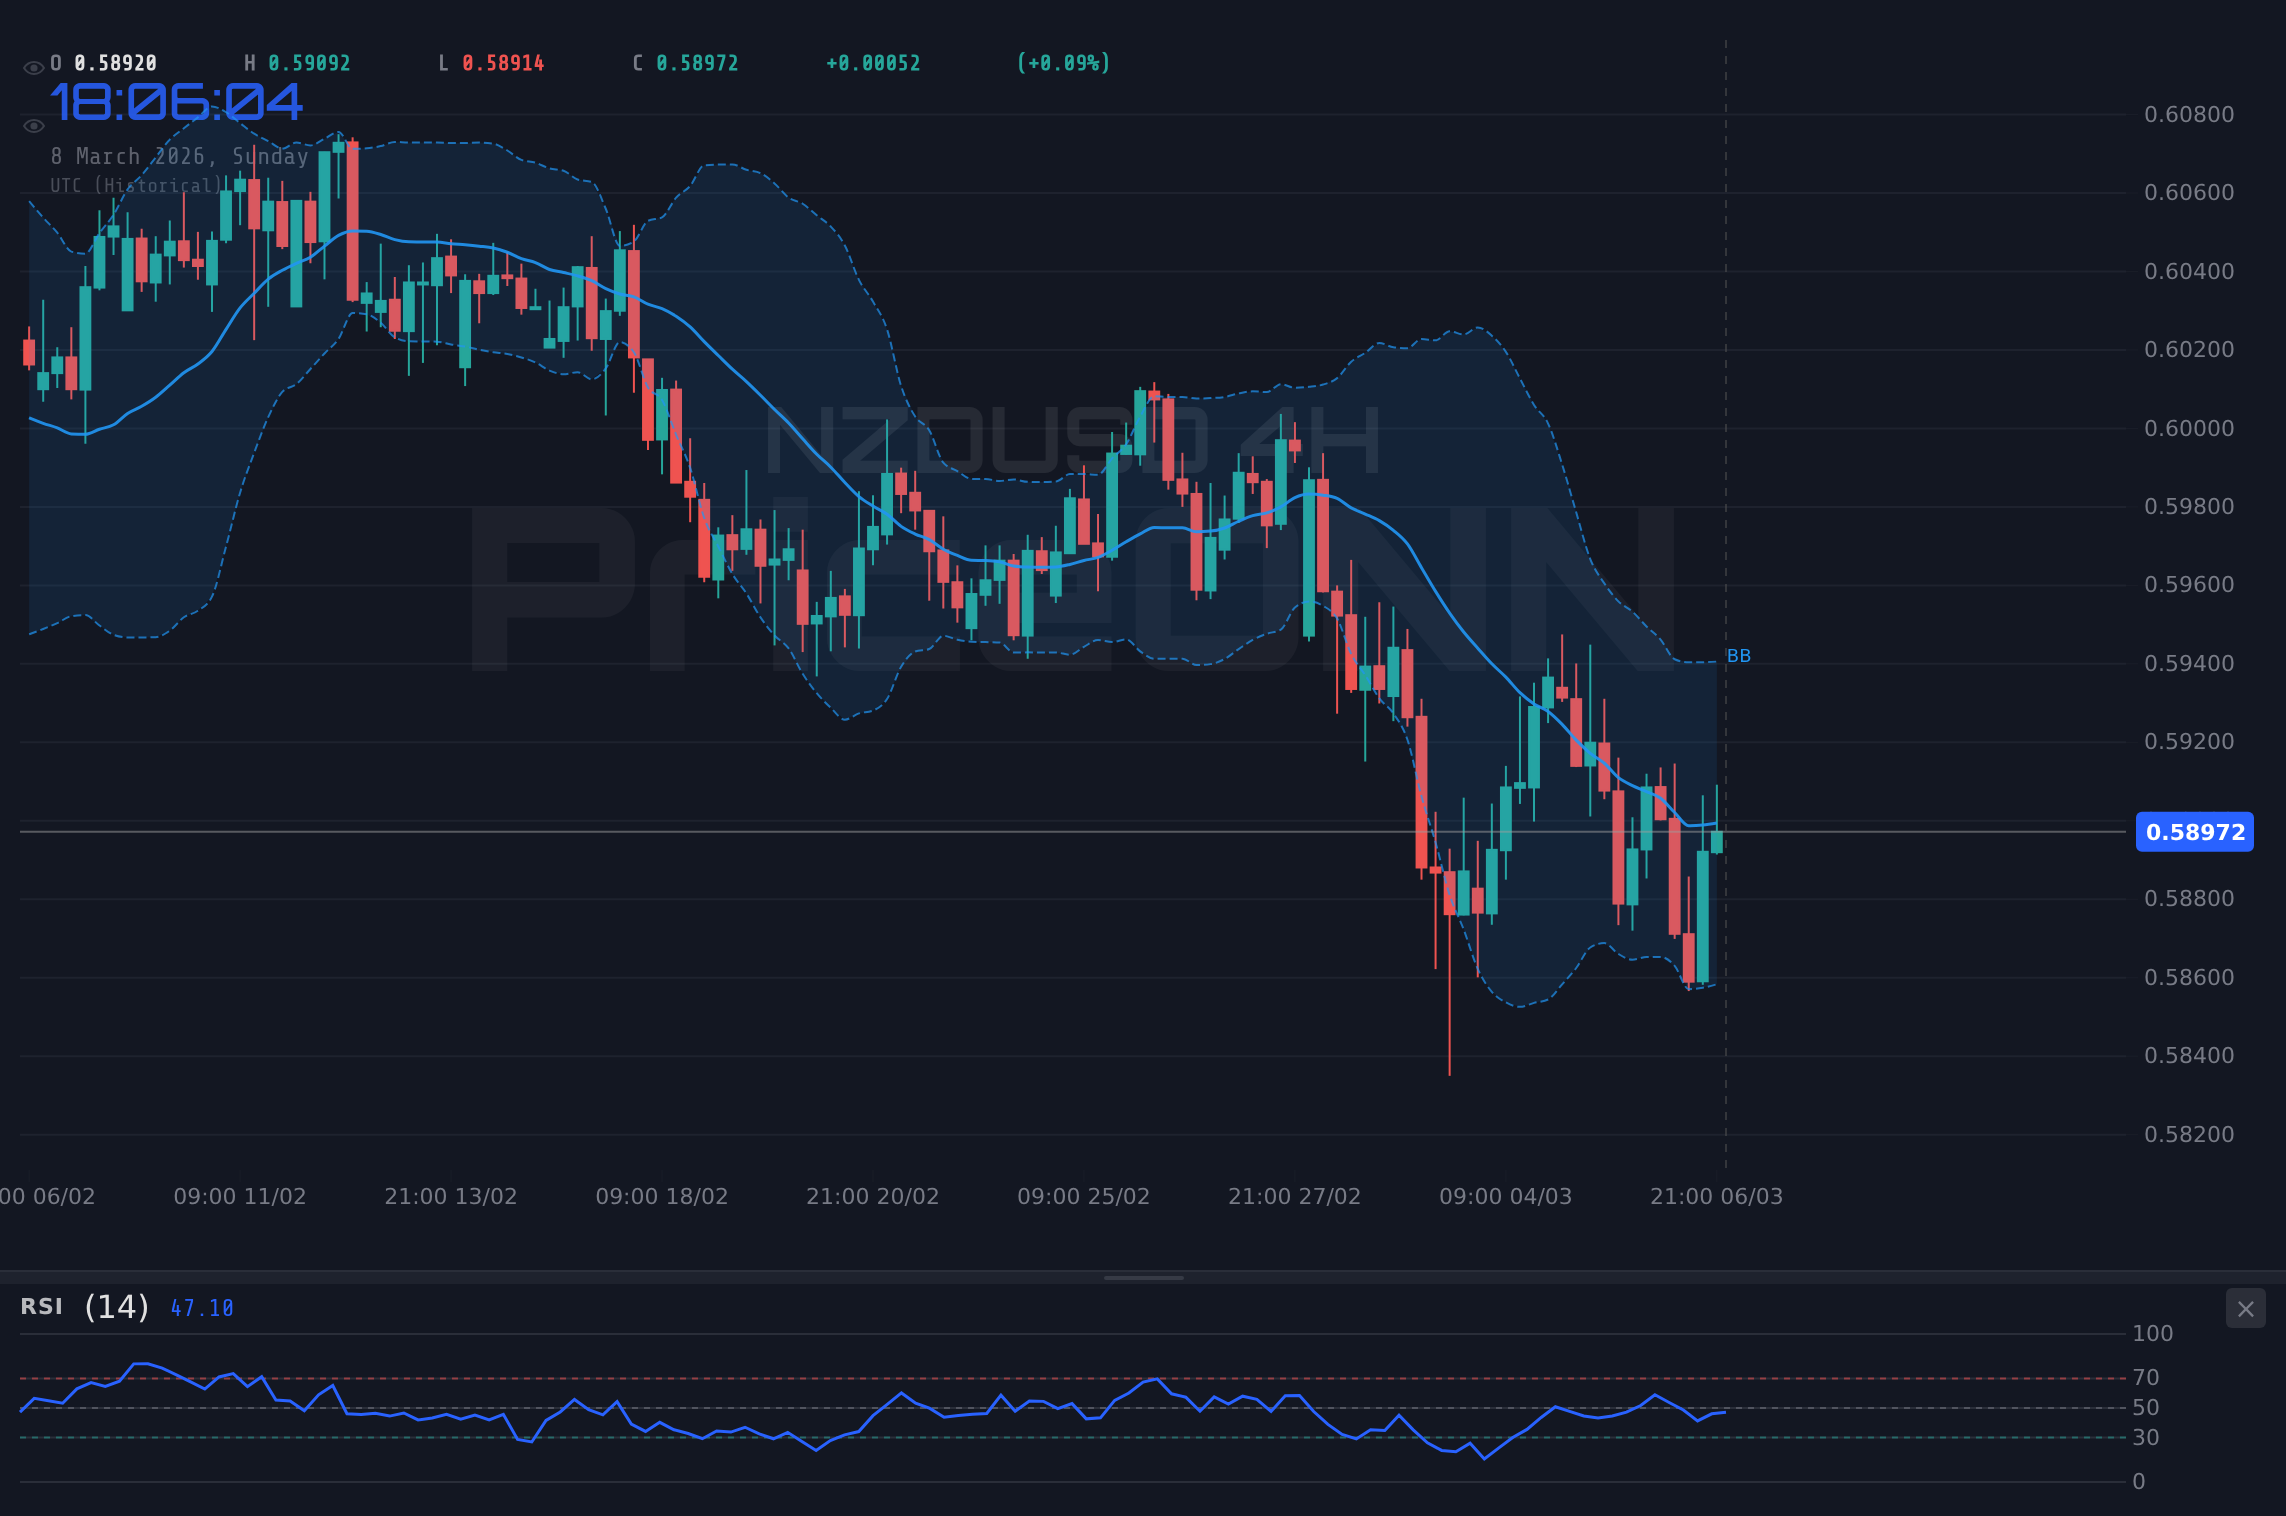
The past week has been characterized by a lack of clear directional conviction in NZDUSD. The pair has been oscillating within a narrow range, failing to establish a sustained move above or below key levels. This consolidation suggests a period of indecision, with traders awaiting a fresh catalyst to provide direction. The 1H chart shows the NZDUSD pair trading around $0.58981, with the RSI sitting at 52.32, indicating neutral momentum. This lack of a strong directional signal suggests that the market is in a wait-and-see mode.
The sideways action is further confirmed by the ADX on the 1H chart, which reads 17.87, signaling a weak trend. A weak-trend reading like this means the breakout hasn't committed yet - it could go either way. The pair's inability to break free from this range-bound behavior highlights the importance of upcoming economic data releases, particularly the New Zealand trade balance data, which is scheduled for release next week. Traders are likely to position themselves based on expectations surrounding this data, potentially leading to increased volatility and a breakout from the current consolidation.
Multi-Timeframe Analysis: A Conflicting Picture
A multi-timeframe analysis of NZDUSD reveals a mixed picture, with conflicting signals across different time horizons. On the 1H chart, the pair is exhibiting a neutral trend, with the RSI hovering around 52.32. The MACD, however, shows positive momentum, suggesting potential for a bullish move. The stochastic oscillator also supports this view, with K=80.1 and D=61.78, indicating a bullish signal. This is exactly where you need to pay attention...
However, a look at the 4H chart paints a different picture. The trend is classified as neutral, but with a strong downward trend (90%). The RSI is at 45.14, indicating a slightly bearish bias. The MACD is negative, further reinforcing this view. The stochastic oscillator, with K=14.87 and D=25.1, signals an oversold condition, suggesting potential for a bounce. This conflicting picture highlights the importance of considering multiple timeframes when assessing potential trading opportunities.
The daily chart further complicates the analysis. The trend is classified as neutral, but the RSI is at 43.11, indicating a bearish bias. The MACD is negative, further reinforcing this view. The stochastic oscillator, with K=41.74 and D=36.9, signals a potential bullish reversal. The ADX, at 24.07, indicates a moderate downtrend. This conflicting picture suggests that NZDUSD is at a critical juncture, with the potential for a significant move in either direction.
Why Trade Balance Data Matters
The upcoming New Zealand trade balance data is a key economic indicator that reflects the difference between the value of goods and services exported and imported by the country. A positive trade balance, or surplus, indicates that New Zealand is exporting more than it is importing, which is generally considered to be positive for the New Zealand Dollar. Conversely, a negative trade balance, or deficit, indicates that New Zealand is importing more than it is exporting, which is generally considered to be negative for the New Zealand Dollar.
The trade balance data can impact the New Zealand Dollar through several channels. First, it provides insights into the overall health of the New Zealand economy. A strong trade balance suggests that the New Zealand economy is competitive and generating strong demand for its exports. This can lead to increased investment and job creation, which are positive for economic growth and the New Zealand Dollar. Second, the trade balance data can influence monetary policy decisions by the Reserve Bank of New Zealand (RBNZ). A strong trade balance may give the RBNZ more room to raise interest rates, which can attract foreign investment and support the New Zealand Dollar.
Third, the trade balance data can impact market sentiment towards the New Zealand Dollar. A positive surprise in the trade balance data can boost investor confidence in the New Zealand economy and the New Zealand Dollar, leading to increased demand for the currency. Conversely, a negative surprise can erode investor confidence and lead to increased selling pressure on the New Zealand Dollar. As such, traders closely monitor the trade balance data and use it to inform their trading decisions.
Potential Trade Scenarios
Given the conflicting signals from the technical indicators and the upcoming trade balance data release, traders should be prepared for a potential breakout in either direction. Here are two potential trade scenarios to consider:
If the trade balance data comes in better than expected and NZDUSD breaks above the immediate resistance at $0.59044, we could see a move towards the next resistance levels at $0.59088 and $0.59131. A sustained break above $0.59131 could trigger a more significant rally towards higher targets.
If the trade balance data comes in worse than expected and NZDUSD breaks below the immediate support at $0.58957, we could see a move towards the next support levels at $0.58914 and $0.5887. A sustained break below $0.5887 could trigger a more significant sell-off towards lower targets.
It's important to note that these are just potential trade scenarios, and the actual outcome may differ depending on market conditions and other factors. Traders should always conduct their own research and analysis before making any trading decisions. Also, with the US data releases later in the week, monitor how the DXY responds. With DXY at 98.57, NZDUSD is likely to remain under pressure if the dollar index strengthens.
The Commodity Connection
New Zealand's economy is heavily reliant on commodity exports, particularly agricultural products. This makes the New Zealand Dollar sensitive to fluctuations in commodity prices. A surge in commodity prices can boost New Zealand's export revenues, leading to increased demand for the New Zealand Dollar. Conversely, a decline in commodity prices can depress New Zealand's export revenues, leading to decreased demand for the New Zealand Dollar.
The price of oil is also a key factor to watch. The escalating oil crisis, triggered by Middle East tensions, is sending shockwaves through forex markets as reported earlier in the week. Escalating tensions in the Middle East have triggered a sharp increase in crude oil prices, impacting global forex markets. As Brent crude oil prices are nearing $90 a barrel due to escalating tensions in the Middle East, specifically disruptions, any further escalation will have a negative impact on NZDUSD.
Given the conflicting signals from the technical indicators and the sensitivity of the New Zealand Dollar to commodity prices, traders should closely monitor commodity markets and adjust their trading strategies accordingly. A surge in commodity prices could provide a boost to the New Zealand Dollar, while a decline in commodity prices could weigh on the currency. Traders should also be aware of the potential for geopolitical risks to impact commodity prices and the New Zealand Dollar.
NZDUSD and Global Economic Data
NZDUSD is not an island- it responds to global economic data and sentiment. Global economic data released in early March 2026 reveals mixed trends across major economies, impacting forex markets. This week's global economic data releases will provide key insights into the health of major economies. Focus will be on UK GDP momentum, and Canadian labor concerns.
As such, upcoming US data releases will have an impact on the NZDUSD pair. The US Dollar is under pressure as February data is expected to show a slight increase in the unemployment rate for the Canadian economy. This will weigh on the pair and should be factored into any trades that you make.
Trade Plan: Short NZDUSD
Given the overall bearish sentiment, a short trade is warranted, but with careful planning.
Time Horizon: This analysis is for swing trades.
Enter short if price breaks below $0.58957, targeting $0.58914 as the first target and $0.5887 as the second target. This scenario has a 60% probability given the strong downward trend signal on the 4H chart and negative momentum.
If support at $0.58957 holds, look for a potential bounce towards $0.59044 and $0.59088. However, this scenario has a lower probability due to the overall bearish trend.
Remember, patience looks like it will be rewarded here. Manage your risk, wait for your setup- the market always gives a second chance.
Frequently Asked Questions: NZDUSD Analysis
Is NZDUSD a good buy right now?
Given the current sideways trend and bearish signals on longer timeframes, NZDUSD is not a good buy right now. Traders should wait for a confirmed break below $0.58957 before considering short positions.
What is the NZDUSD price forecast for this week?
The NZDUSD price forecast for this week is dependent on the upcoming trade balance data. A negative surprise could send the pair towards $0.58914 and $0.5887, while a positive surprise could trigger a bounce towards $0.59044 and $0.59088. A 60% probability of a downtrend continuation is expected.
What are the key support and resistance levels for NZDUSD?
Key support levels for NZDUSD are at $0.58957, $0.58914, and $0.5887. Key resistance levels are at $0.59044, $0.59088, and $0.59131. These levels should be closely monitored for potential breakout or reversal opportunities.
Why is NZDUSD moving today?
NZDUSD is currently consolidating within a narrow range, awaiting a fresh catalyst to provide direction. The upcoming trade balance data is the key event to watch, as it could trigger a significant move in either direction.
Track markets in real-time
AI-powered analysis, technical indicators and real-time price data.
Join Our Telegram Channel
Breaking market news, AI analysis and trading signals instantly.
Join Channel