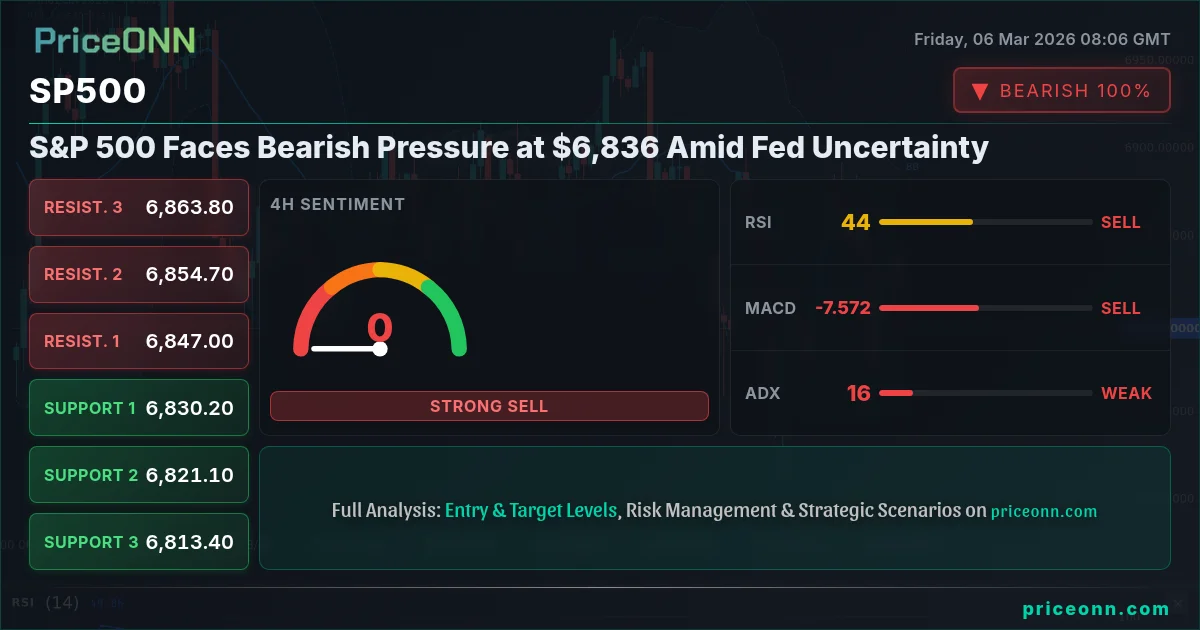
The S&P 500 (SP500) is currently navigating choppy waters, hovering around $6,836.00. Despite a recent attempt to rally, the index is facing renewed bearish pressure amid concerns about economic growth and uncertainty surrounding the Federal Reserve's next moves. The question on every trader's mind is whether this pullback is a temporary correction or the start of a deeper decline. SP500 today analysis suggests a cautious approach is warranted, as conflicting signals emerge from various technical indicators.
- RSI at 46.43 on the daily chart suggests weakening bullish momentum.
- Key resistance level to watch is at $6,882.67, a break above which could signal renewed bullishness.
- The MACD histogram is showing negative momentum, indicating potential for further downside.
- Fed rate expectations and upcoming economic data will be crucial in determining the SP500's short-term direction.
Navigating the $6,800 Hurdle: SP500 Technical Analysis
Let's dive into the technical picture. The SP500's 1-day chart paints a mixed picture. While the index is showing an overall neutral trend, the daily RSI sits at 46.43, suggesting that the bulls may be losing steam. This isn't quite oversold territory, but it's a level where we often see a pause or pullback before the next leg up. It’s worth noting that The MACD histogram, however, is printing negative values, indicating that bearish momentum is building beneath the surface. Adding to the bearish case, the daily Stochastic reading of K=50.9, D=53.94 signals a potential downturn, with %K
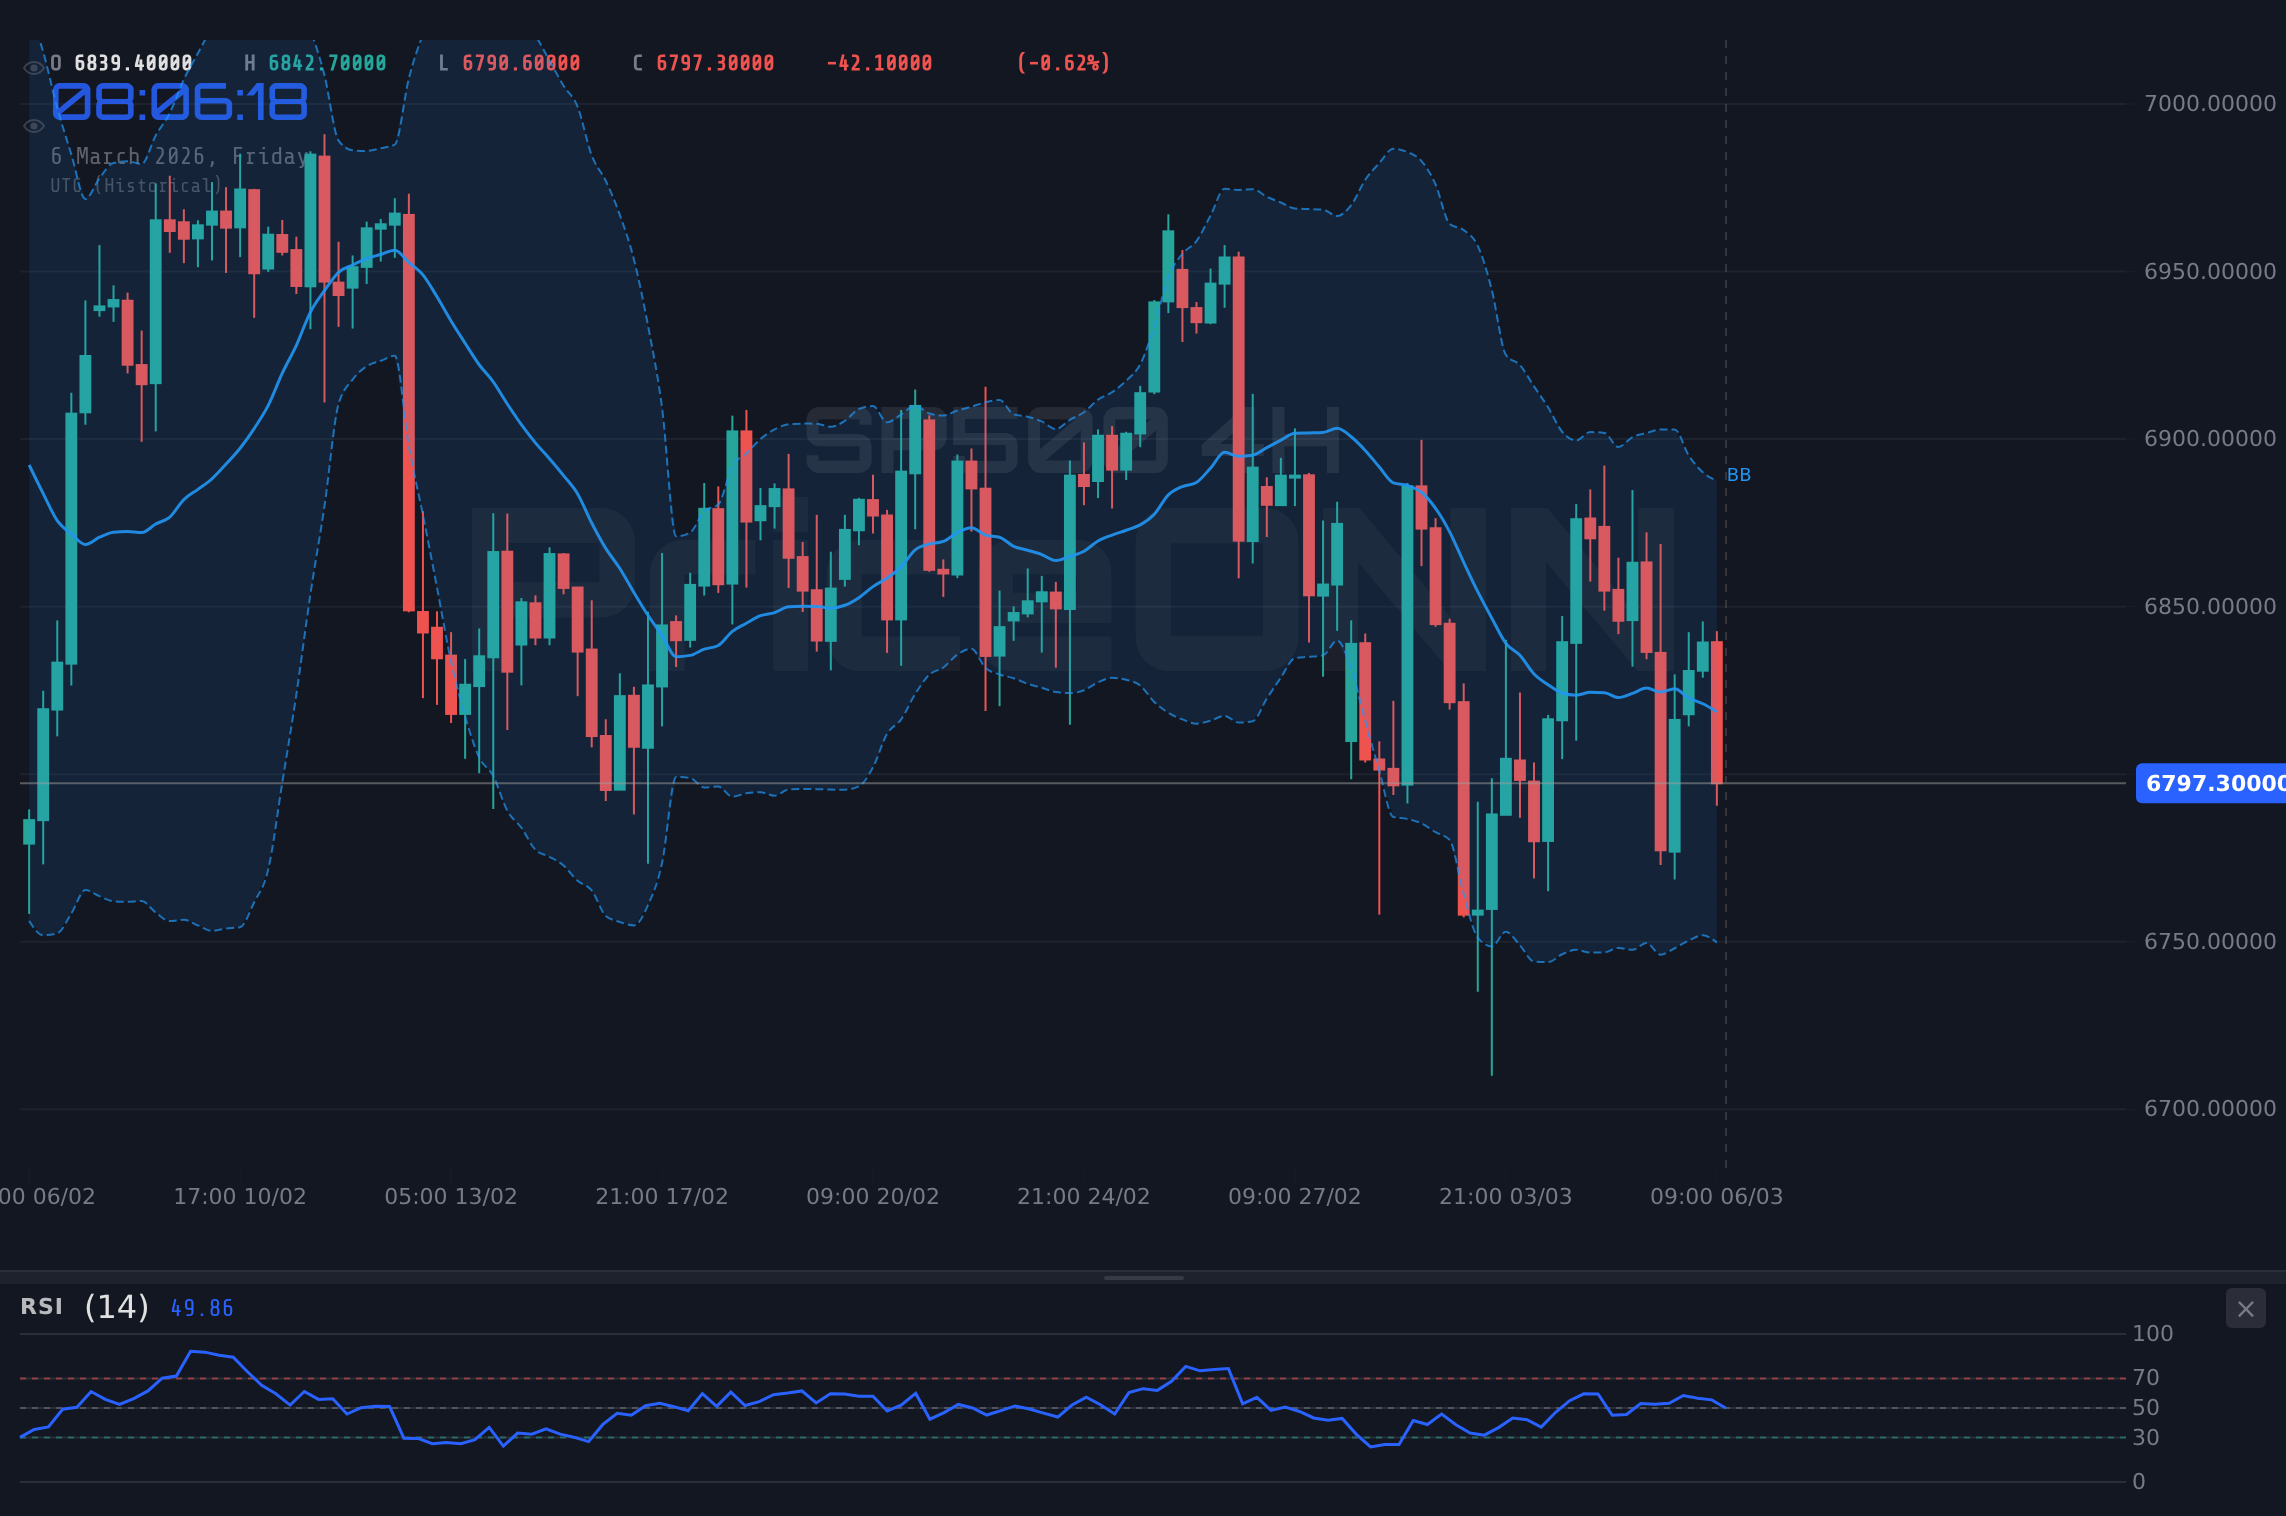
Zooming in to the 4-hour chart, we see a similar pattern. The 4H RSI is at 50.04, and the ADX reads 15.74, indicating a weak trend. This tells us that the recent rally may be losing steam, and the bears could be preparing to make a move. A key level to watch on this timeframe is the resistance at $6,844.03. A sustained break above this level would negate the bearish signals and open the door for a retest of the recent highs. However, failure to break above $6,844.03 could lead to a test of the support at $6,759.17.
Why $6,759.17 is the Line in the Sand
The support level at $6,759.17 is crucial for the SP500. This level represents a confluence of technical factors, including a previous swing low and a Fibonacci retracement level. A break below this level would confirm the bearish thesis and could lead to a deeper correction towards $6,702.13 and potentially even $6,635.67. On the other hand, as long as the SP500 holds above $6,759.17, the bulls still have a chance to regain control and push the index higher. The 1-hour chart's ADX of 8.96 signals a weak trend, meaning any movement, bullish or bearish, isn't showing significant conviction. This is where patience is key. Wait for confirmation before committing to a position.
For scalpers, the key levels to watch are the intraday support and resistance levels outlined in the market data: support at 6832.73 and resistance at 6840.83. Swing traders should focus on the 4-hour chart and the key levels at $6,759.17 and $6,844.03. Long-term investors should pay attention to the daily chart and the broader economic picture. Keep in mind that the market is always evolving, and it's important to adapt your strategy as new information becomes available.
SP500 Price Forecast: The Bullish and Bearish Scenarios
The SP500 breaks above the resistance level of $6,882.67, fueled by positive economic data and a dovish Fed. This breakout opens the door for a retest of the recent highs at $6,949.13 and potentially even a push towards $7,006.17.
The SP500 fails to hold the support level at $6,759.17, succumbing to negative economic data and hawkish Fed comments. This breakdown could lead to a deeper correction towards $6,702.13 and potentially even $6,635.67.
DXY and SP500: Correlation Analysis
The dollar index (DXY) is currently trading at 98.71. Historically, the SP500 and the DXY have an inverse relationship - a stronger dollar often puts downward pressure on the SP500. As the DXY is showing strength on the 1-day chart, traders need to keep an eye on the correlation between the two. For example, with the DXY at 98.71, the SP500 is under pressure to maintain its current levels. If the DXY continues to rise, it could exacerbate the bearish pressure on the SP500.
Furthermore, oil prices are another important factor to consider. WTI Crude is currently trading at $81.08, showing a strong upward trend. Rising oil prices can contribute to inflation, which could prompt the Fed to take a more hawkish stance. This, in turn, could put further downward pressure on the SP500. The Nasdaq100, currently at 25076.25, is showing a similar pattern to the SP500, with a neutral trend on the daily chart and conflicting signals from the technical indicators. A risk-off environment, signaled by a decline in the Nasdaq100, could further weigh on the SP500.
The Fed Factor: Navigating Interest Rate Uncertainty
The Federal Reserve's monetary policy decisions will play a crucial role in determining the SP500's future direction. According to Reuters, Fed officials have recently emphasized that inflation remains 'stubborn,' suggesting that interest rates may need to stay higher for longer. The market is currently pricing in a high probability of at least one more rate hike in the coming months. This hawkish stance from the Fed could put further downward pressure on the SP500, as higher interest rates tend to dampen economic growth and corporate earnings. The upcoming Fed meeting and the release of the latest inflation data will be closely watched by investors.
Specifically, looking at the economic calendar, the market will be keenly awaiting the data release scheduled for today. The market's reaction to this data will likely set the tone for the SP500 in the coming days. If the data comes in weaker than expected, it could reinforce the bearish thesis and lead to further downside. Conversely, stronger-than-expected data could provide a temporary boost to the SP500. As Bloomberg data suggests, China's central bank is continuing to increase its gold reserves. This could indicate concerns about global economic stability and could lead to safe-haven flows into gold, potentially at the expense of equities.
SP500: What to Watch and Why
For traders, the key is to remain flexible and adapt to the evolving market conditions. Pay close attention to the economic data releases and the Fed's comments. Monitor the key support and resistance levels outlined above. Be prepared to adjust your strategy as new information becomes available. And most importantly, manage your risk carefully. As someone with over 20 years of experience in financial markets, I can tell you that the market is always full of surprises. The best way to survive and thrive is to stay informed, stay disciplined, and stay humble.
Frequently Asked Questions: SP500 Analysis
Is SP500 a good buy right now?
Given the current market conditions and mixed technical signals, it's difficult to say definitively whether the SP500 is a good buy right now. The current price of $6,836 is hovering near resistance, and a break above $6,882.67 is needed to confirm bullish momentum. Until then, caution is warranted.
What is the SP500 price forecast for this week?
The SP500 price forecast for this week depends on the upcoming economic data releases and the Fed's comments. A break above $6,882.67 could lead to a test of $6,949.13, while a break below $6,759.17 could lead to a test of $6,702.13. The probability of each scenario will depend on the data.
What are the key support and resistance levels for SP500?
Key support levels for the SP500 are $6,759.17, $6,702.13, and $6,635.67. Key resistance levels are $6,882.67, $6,949.13, and $7,006.17. These levels represent potential areas of buying and selling pressure.
Why is SP500 moving today?
The SP500's movement today is being influenced by a combination of factors, including economic data releases, Fed comments, and technical signals. The current bearish pressure is likely due to concerns about economic growth and uncertainty surrounding the Fed's next moves. However, positive surprises could shift sentiment quickly.
Technical Outlook Summary
| Indicator | Value | Signal |
|---|---|---|
| RSI (14) | 53.28 | Neutral |
| MACD Histogram | Negative | Bearish |
| Stochastic | 28.27/58.69 | Bearish |
| ADX | 14.64 | Weak Trend |
| Bollinger | Middle Band | Watch |
Key Levels
Support Levels
Resistance Levels
Track markets in real-time
AI-powered analysis, technical indicators and real-time price data.
Join Our Telegram Channel
Breaking market news, AI analysis and trading signals instantly.
Join Channel