The global geopolitical landscape remains a volatile cockpit, and nowhere is this more evident than in the precious metals markets. Silver, trading at precisely $71.74 today, is currently carving out significant gains, a testament to its dual role as both an industrial powerhouse and a safe-haven asset. As tensions simmer and macroeconomic indicators present a mixed bag, investors are increasingly turning to silver as a hedge against uncertainty. This analysis delves into the intricate interplay of global events and technical signals shaping the current trajectory of XAGUSD.
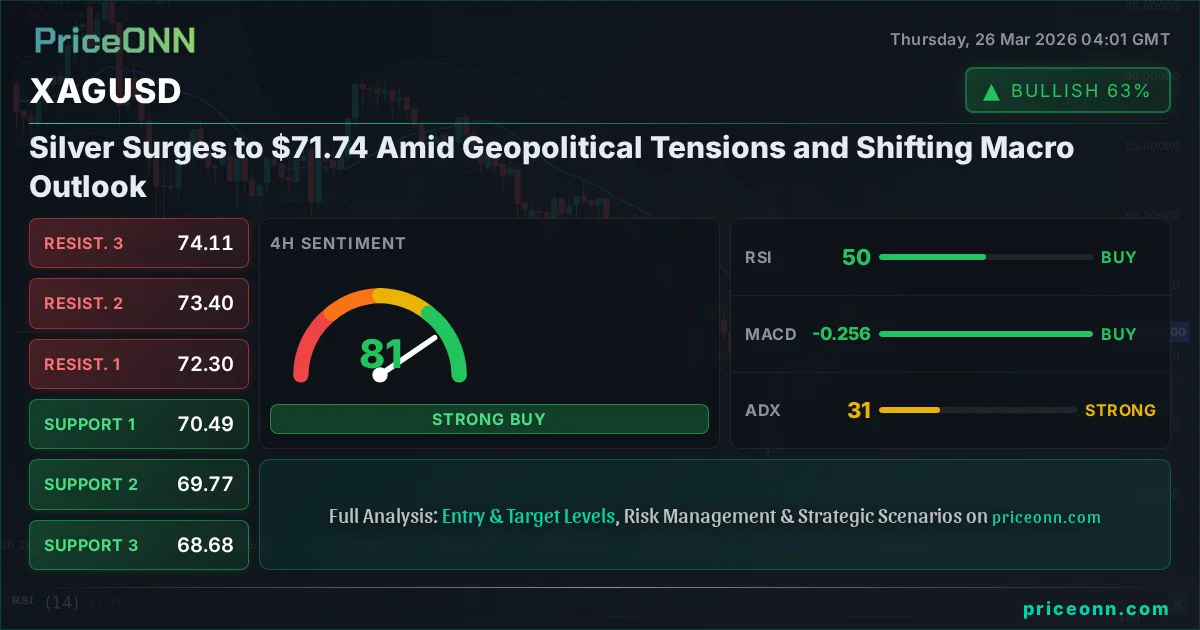
- Silver (XAGUSD) is currently trading at $71.74, showing upward momentum.
- The ADX at 30.65 on the 4H chart indicates a strong downtrend, while the 1H chart shows a weak trend (ADX: 18.41).
- Key resistance is identified at $72.30 (4H) and $71.94 (1H), with support at $70.85 (1H) and $70.49 (4H).
- Geopolitical developments, particularly any news related to US-Iran relations, are critical drivers for silver's price action.
The markets have been captivated by the unfolding geopolitical narrative, with recent reports from Reuters and Bloomberg highlighting escalating tensions. Any hint of diplomatic breakthroughs or, conversely, further escalation, sends ripples across commodity markets, especially those sensitive to global stability like silver. The current price action for XAGUSD at $71.74 is a direct reflection of this delicate balance. While the daily chart shows a strong downtrend with an ADX of 29.06, the shorter 1H and 4H timeframes present a more nuanced picture. The 4H chart, in particular, shows a strong downtrend (ADX: 30.65), yet the RSI is hovering near neutral at 50.45, suggesting a potential pause or shift in momentum. This divergence is crucial for traders to monitor.
Navigating the Crosscurrents: Technical Indicators and Price Action
Delving deeper into the technical indicators, the 1-hour chart for XAGUSD paints a picture of cautious optimism, or perhaps a temporary reprieve for the bulls. The RSI(14) sits at 49.81, right in the neutral zone, indicating neither strong overbought nor oversold conditions. This neutrality suggests that the market is waiting for a clearer directional cue. However, the MACD is showing negative momentum, with the MACD line below its signal line, hinting at potential downward pressure. The Stochastic Oscillator, on the other hand, offers a glimmer of hope for buyers, with %K at 52.87 crossing above %D at 33.74, suggesting a potential upward move. The ADX reading of 18.41 on this timeframe confirms what many traders are feeling: a lack of strong directional conviction, leading to choppy, range-bound price action. This environment often precedes a significant breakout, but the direction remains uncertain.
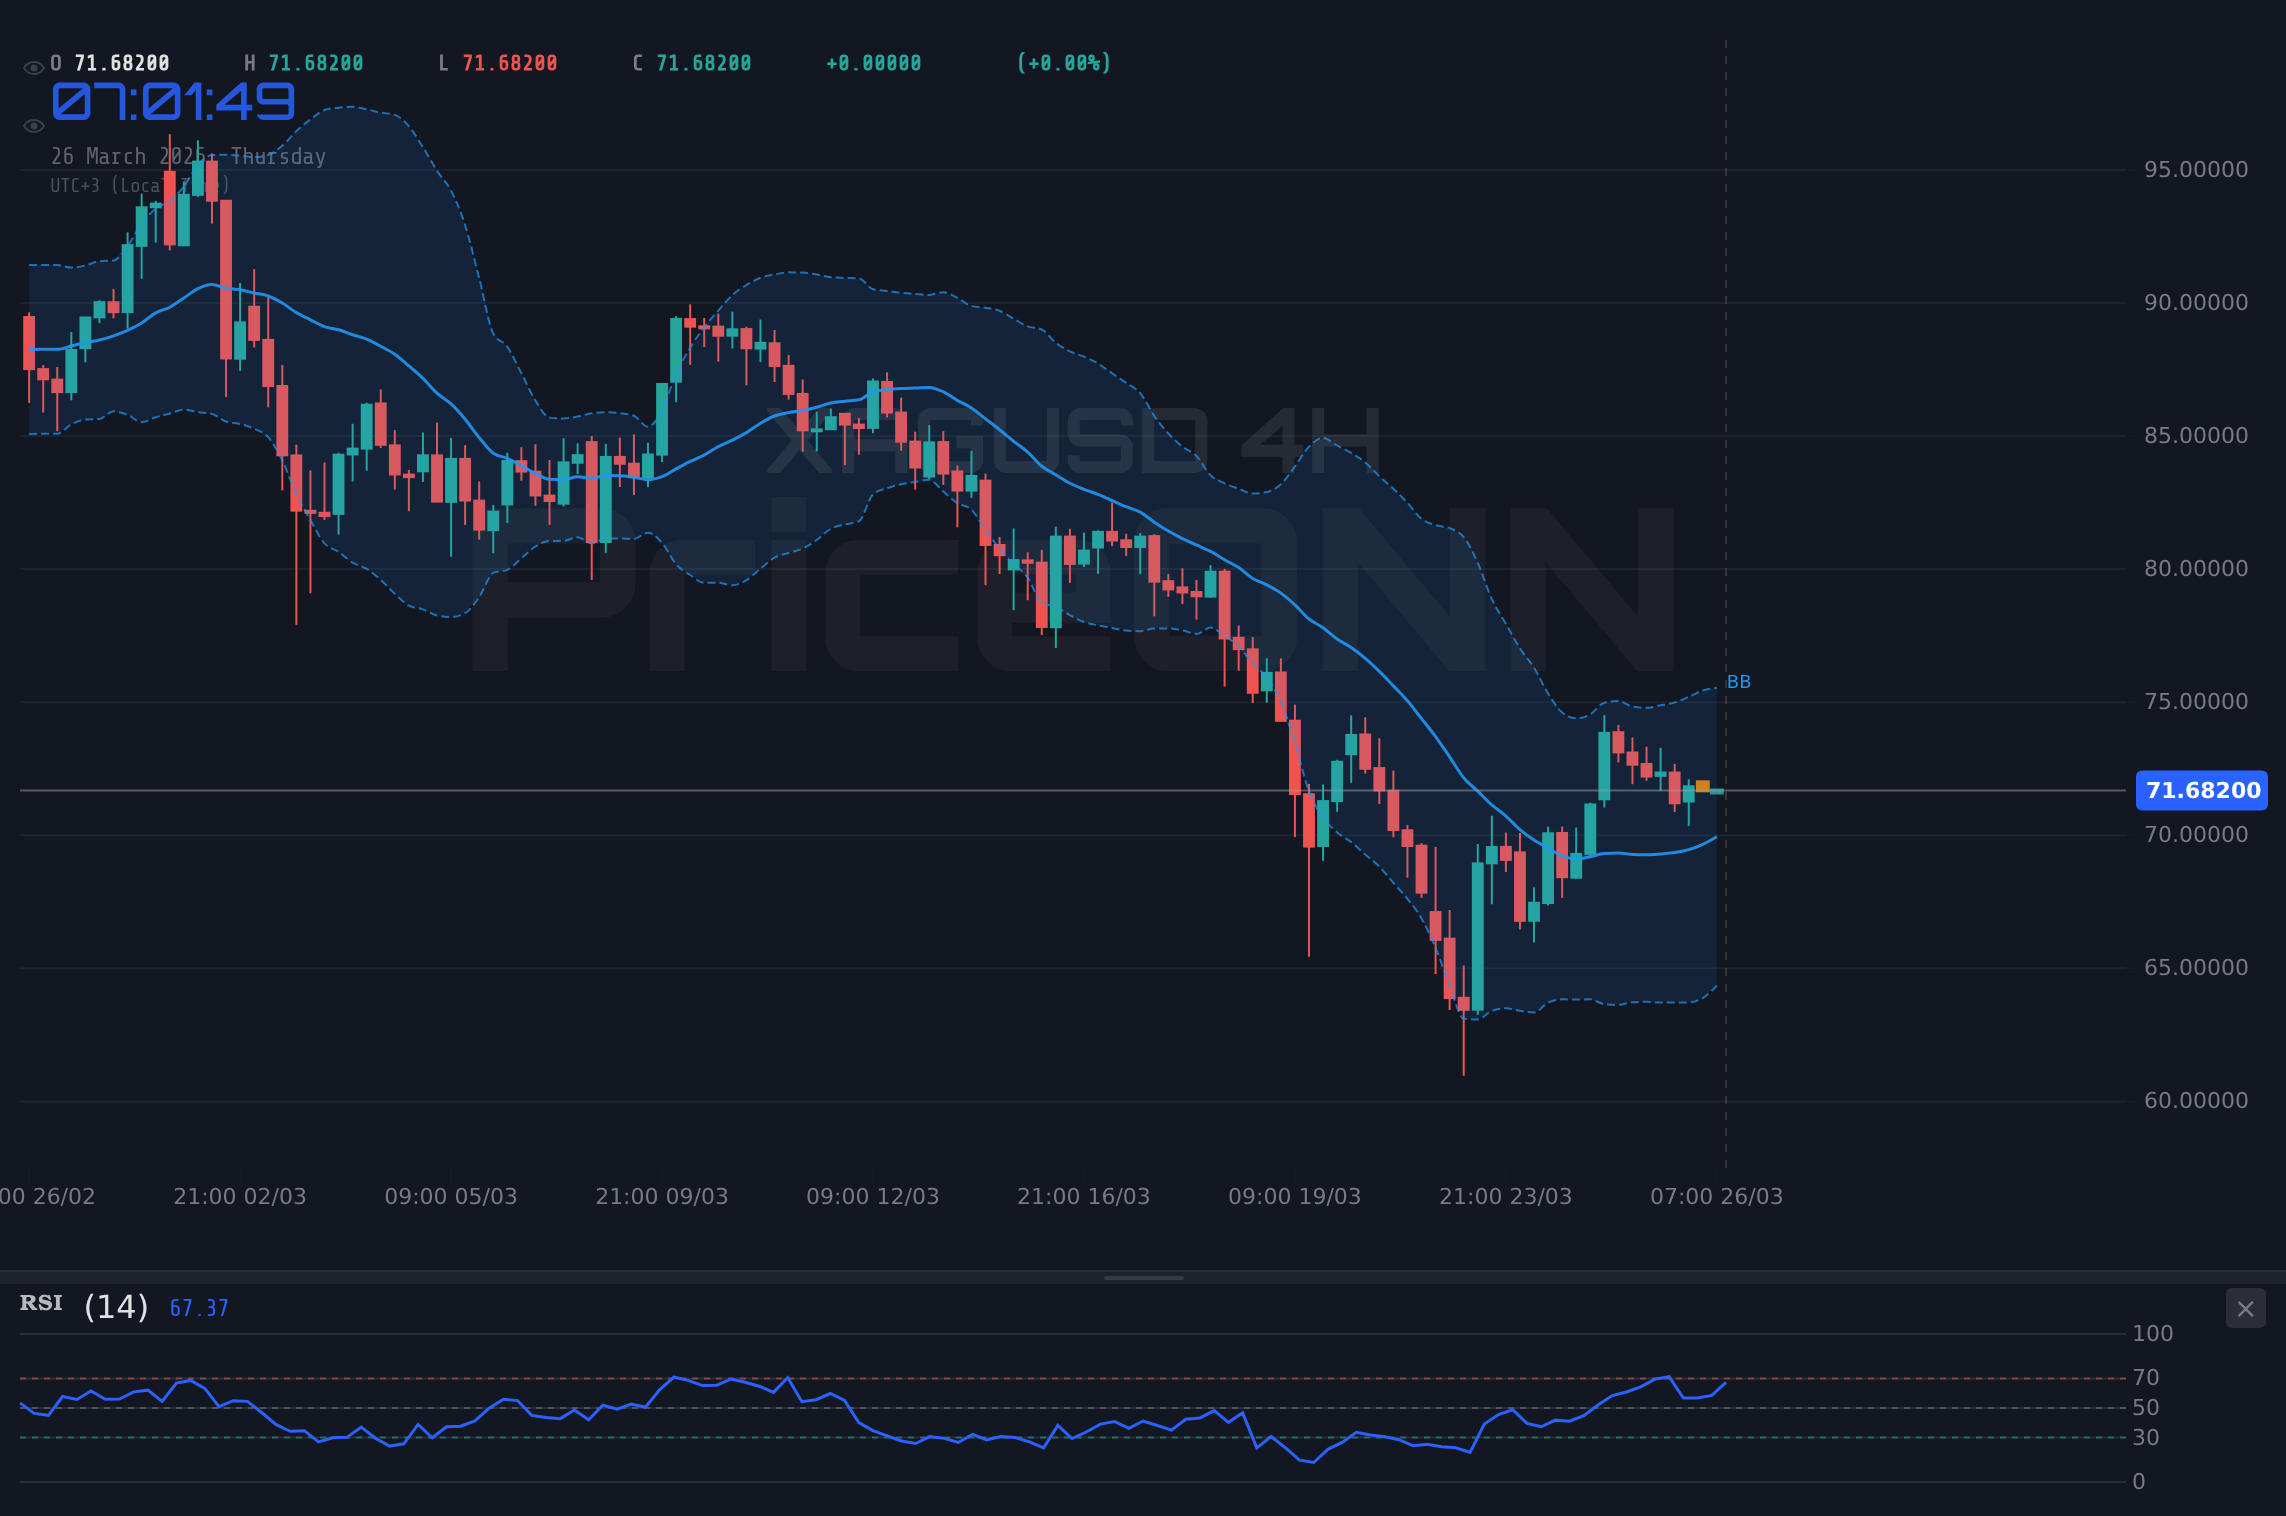
On the 4-hour chart, the technical landscape shifts slightly. The RSI(14) is at 50.45, again in the neutral territory, but showing a slight upward eğilimi. The MACD here is more encouraging for bulls, displaying positive momentum with the MACD line above its signal line. Bollinger Bands are also hugging the middle band, indicating a potential for upward movement. However, the Stochastic Oscillator presents a conflicting signal, with %K at 58.86 falling below %D at 75.34, suggesting a bearish divergence and potential pullback. The ADX at 30.65 here is more assertive, pointing to a strong downtrend, which contrasts with the more indecisive signals on the 1H chart. This conflict between short-term signals and the stronger 4H trend is a classic sign of a market in transition, where cautious positioning is paramount.
The daily timeframe paints the most bearish picture, dominated by a strong downtrend confirmed by an ADX of 29.06. The RSI(14) is at 33.87, deep in the oversold territory, which, while typically signaling a potential bounce, can also indicate sustained selling pressure. The MACD is firmly in negative territory, below its signal line, reinforcing the bearish outlook. Bollinger Bands are also below the middle band, confirming the prevailing downward bias. The Stochastic Oscillator, however, provides a bullish divergence, with %K at 39.35 crossing above %D at 21.99. This is a classic 'oversold bounce' signal, suggesting that while the longer-term trend is down, a short-term recovery could be on the cards. The conflict between the daily's strong bearish trend and the Stochastic's bullish divergence is where the real trading opportunities lie for those who can navigate the uncertainty.
The prevailing sentiment for XAGUSD appears to be one of cautious bearishness on the daily chart, contrasted by short-term indecision and potential for recovery on intraday and 4-hour timeframes. Geopolitical events are acting as significant catalysts, overriding purely technical signals at times.
The Macroeconomic Undercurrents Driving Silver
Beyond the charts, a complex web of macroeconomic factors is influencing silver's price. The US Dollar Index (DXY), currently trading at 99.39, plays a pivotal role. As the DXY strengthens, it typically puts downward pressure on dollar-denominated commodities like silver, as they become more expensive for holders of other currencies. Conversely, a weaker dollar often fuels demand for silver. Today, the DXY is showing strength, trading at 99.39 with a strong upward trend on the 1H and 1D charts, which might seem counterintuitive to silver's current rally. This highlights the dominant influence of geopolitical risk appetite at this moment, temporarily overshadowing the typical inverse correlation.
Equity markets are also providing context. The S&P 500, hovering around 6590.95, is showing a slight downward bias on the daily chart, indicating a potential dip in risk appetite. This could, in theory, boost demand for safe-haven assets like silver. However, the Nasdaq 100 is showing a slight upward move, creating a mixed signal from the equity space. This lack of clear direction in major indices adds to the overall market uncertainty, making silver's performance particularly sensitive to news flow. The interplay between risk-on (equities potentially rising) and risk-off (safe havens like silver demanded) sentiment is complex and often contradictory in the short term.
Inflation expectations, often linked to oil prices, are another critical factor. Brent crude is trading at $102.24, showing a strong upward trend on the daily chart. Rising oil prices can signal increasing inflationary pressures, which historically benefits gold and silver as inflation hedges. The current rally in Brent crude could be interpreted as a supportive factor for silver, suggesting that underlying inflationary concerns are still present. However, the market's reaction is nuanced; if oil prices surge due to supply disruptions (geopolitical risk), it can also dampen global economic growth expectations, potentially creating headwinds for industrial metals like silver in the medium term.
The current geopolitical climate is the primary driver for XAGUSD. Any significant developments, particularly concerning major global powers or energy supply routes, can cause sharp, unpredictable price swings. Traders should remain highly vigilant and prepared for increased volatility.
Trade Scenarios and Probabilities for XAGUSD
Given the conflicting signals across different timeframes and the dominant influence of geopolitical news, outlining specific trade scenarios becomes essential for managing risk and identifying opportunities. The current technical setup, especially the divergence between short-term and long-term indicators, suggests a period of heightened uncertainty. The probabilities assigned to each scenario reflect the current technical picture and the prevailing market sentiment, acknowledging that geopolitical events can override these assumptions rapidly.
Bearish Scenario: Downside Breakout
65% ProbabilityNeutral Scenario: Range-Bound Consolidation
25% ProbabilityBullish Scenario: Resistance Breakout
10% ProbabilityThe bearish scenario carries the highest probability, reflecting the dominant downtrend on the daily chart and the strong ADX readings on the 4H timeframe. A break below the $70.49 support level would confirm this outlook, potentially leading silver prices down towards the $69.88 mark. Conversely, the neutral scenario anticipates a period of consolidation, where price action remains confined within the established intraday ranges. This could occur if geopolitical news remains static or offers conflicting signals. The bullish scenario, while having the lowest probability currently, cannot be entirely dismissed, especially if positive diplomatic developments emerge or if the short-term technical signals manage to overcome the daily trend. A decisive move above $72.30 would be the key trigger for this scenario.
Connecting the Dots: XAGUSD's Correlation with Global Markets
Understanding XAGUSD's performance requires looking beyond its immediate technicals to its broader market correlations. The relationship with the US Dollar Index (DXY) is particularly noteworthy. With DXY currently trading at 99.39 and showing strength on multiple timeframes, a typical inverse correlation would suggest pressure on silver. However, the current geopolitical climate seems to be creating a temporary decoupling, where both the dollar and silver can strengthen simultaneously as investors seek safety in different forms. This is a crucial nuance for traders to grasp; traditional relationships can break down during periods of extreme uncertainty.
The correlation with major equity indices like the S&P 500 (at 6590.95) and Nasdaq 100 (at 24172.26) also provides valuable context. A risk-off environment, characterized by falling stock prices, usually boosts demand for safe havens like silver. Today's mixed signals from equities - a slight dip in the S&P 500 and a slight rise in the Nasdaq - add complexity. This ambiguity means that silver's price might not be solely driven by broad market risk sentiment but also by specific commodity-related news and geopolitical events. The strength of the ADX on the daily charts for both indices (SP500: 45.79, Nasdaq: 42.35) suggests that underlying trends are present, but their conflicting directions create a less clear signal for silver.
Furthermore, the price of oil, specifically Brent crude at $102.24, serves as an indirect indicator for inflation expectations and geopolitical stability. Rising oil prices, especially when driven by supply concerns, can bolster silver's appeal as an inflation hedge. This aligns with the current upward trend in Brent. However, if oil prices surge due to runaway demand, it could signal overheating and potential future economic slowdown, which might eventually weigh on industrial metals like silver. The current situation appears to be driven more by supply-side risks, which generally supports silver's safe-haven narrative alongside its inflation-hedging properties. The ADX for Brent on the daily chart is a very strong 62.51, indicating a powerful trend that cannot be ignored.
Looking Ahead: Key Levels and Future Catalysts for XAGUSD
As we look ahead, the $71.74 price point for XAGUSD represents a critical juncture. The interplay between geopolitical developments, macroeconomic shifts, and technical indicators will dictate its next move. Key support levels to watch on the 1-hour chart are $70.85, followed by $70.42. On the 4-hour chart, the crucial support sits at $70.49, below which the bearish scenario becomes significantly more probable. Resistance on the 1-hour chart is capped at $71.94, with a more significant hurdle at $72.60. The 4-hour resistance lies at $72.30, a break of which could ignite the bullish scenario.
The economic calendar, while showing some completed data releases like the US ISM Manufacturing PMI (Actual: 52.4 vs Forecast: 51.5), still holds potential catalysts. Upcoming data, particularly any releases related to inflation or employment in major economies, could sway market sentiment and influence the DXY and risk appetite, thereby impacting silver. The market's reaction to these events will be crucial in confirming or refuting the current technical biases. For instance, if upcoming inflation data surprises to the upside, it could bolster silver's appeal as an inflation hedge, potentially overriding the short-term bearish technical signals.
Traders should remain attuned to news flow concerning central bank communications, especially from the Federal Reserve. While no specific Fed events are listed in the immediate calendar, any subtle shifts in hawkish or dovish rhetoric can impact the dollar and, by extension, silver. The current ADX readings across various timeframes highlight the market's struggle to establish a firm trend, making price action analysis paramount. The battle between the daily downtrend and the potential for intraday bounces necessitates a disciplined approach, focusing on clear entry and exit points defined by the support and resistance levels identified.
Frequently Asked Questions: XAGUSD Analysis
What is the immediate outlook for XAGUSD trading at $71.74, considering the ADX at 30.65 on the 4H chart?
The ADX at 30.65 on the 4H chart indicates a strong downtrend is in play, suggesting potential for further downside. However, the RSI near neutral (50.45) and conflicting signals from other indicators mean that while the bearish trend is strong, short-term consolidation or a bounce around the current $71.74 level is possible before any significant move.
Should I consider buying XAGUSD at $71.74 given the bullish Stochastic signal on the 1H chart?
While the Stochastic showing %K crossing above %D on the 1H chart suggests a potential short-term upward move, it conflicts with the stronger bearish signals on the daily timeframe. A cautious approach is advised; consider waiting for a confirmed break above 1H resistance at $71.94 or confirmation from other indicators before entering a long position.
How does the DXY trading at 99.39 influence the XAGUSD price forecast around $71.74?
Typically, a stronger DXY around 99.39 would put pressure on silver. However, the current geopolitical risks are temporarily overriding this inverse correlation. If geopolitical tensions ease, a strengthening DXY could then exert more downward pressure on XAGUSD, potentially pushing it towards support levels like $70.49.
What is the significance of Brent crude trading at $102.24 for XAGUSD's price action at $71.74?
The rising price of Brent crude to $102.24, driven by supply concerns, supports silver's role as an inflation hedge. This could provide underlying strength to XAGUSD around the $71.74 mark. However, if oil prices surge dramatically due to conflict, it could also dampen global growth, creating mixed signals for silver's industrial demand component.
Bearish Scenario: Downside Breakout
65% ProbabilityNeutral Scenario: Range-Bound Consolidation
25% ProbabilityBullish Scenario: Resistance Breakout
10% ProbabilityThe path forward for silver at $71.74 hinges on the delicate balance between geopolitical risk appetite and macroeconomic fundamentals. While the daily chart suggests caution, the intraday charts offer potential for short-term gains, provided key levels hold. Keep a close eye on geopolitical headlines and the DXY's movement. Patience and disciplined risk management will be crucial in navigating these choppy waters. The market is presenting a complex puzzle, and only time will tell which narrative ultimately prevails.
Track markets in real-time
AI-powered analysis, technical indicators and real-time price data.
Join Our Telegram Channel
Breaking market news, AI analysis and trading signals instantly.
Join Channel