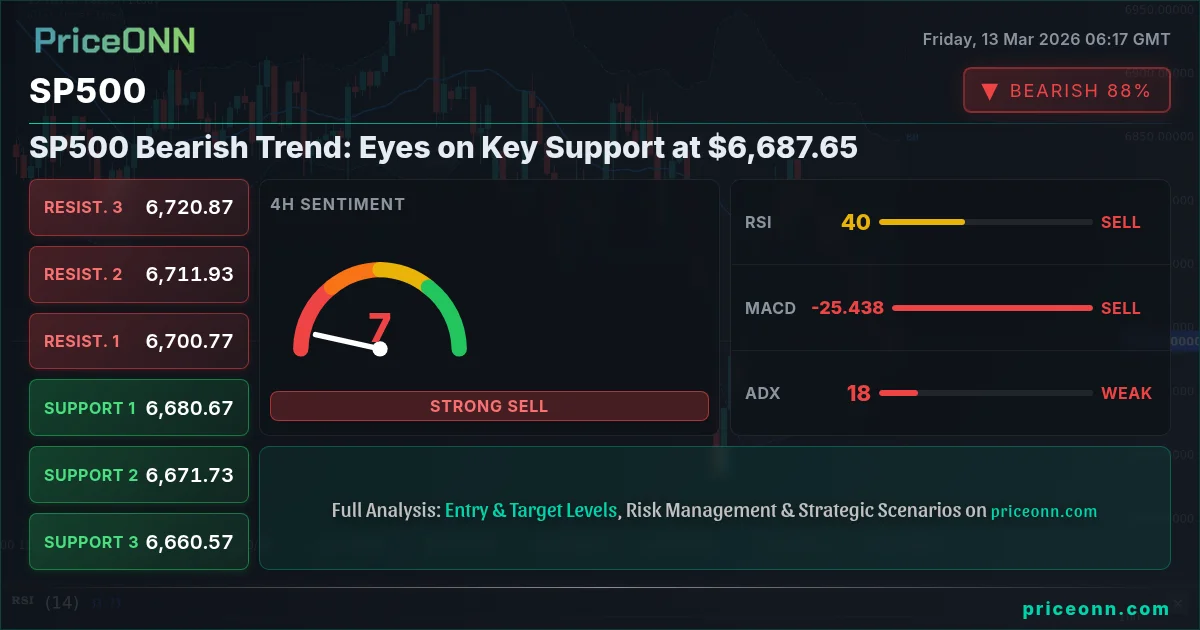
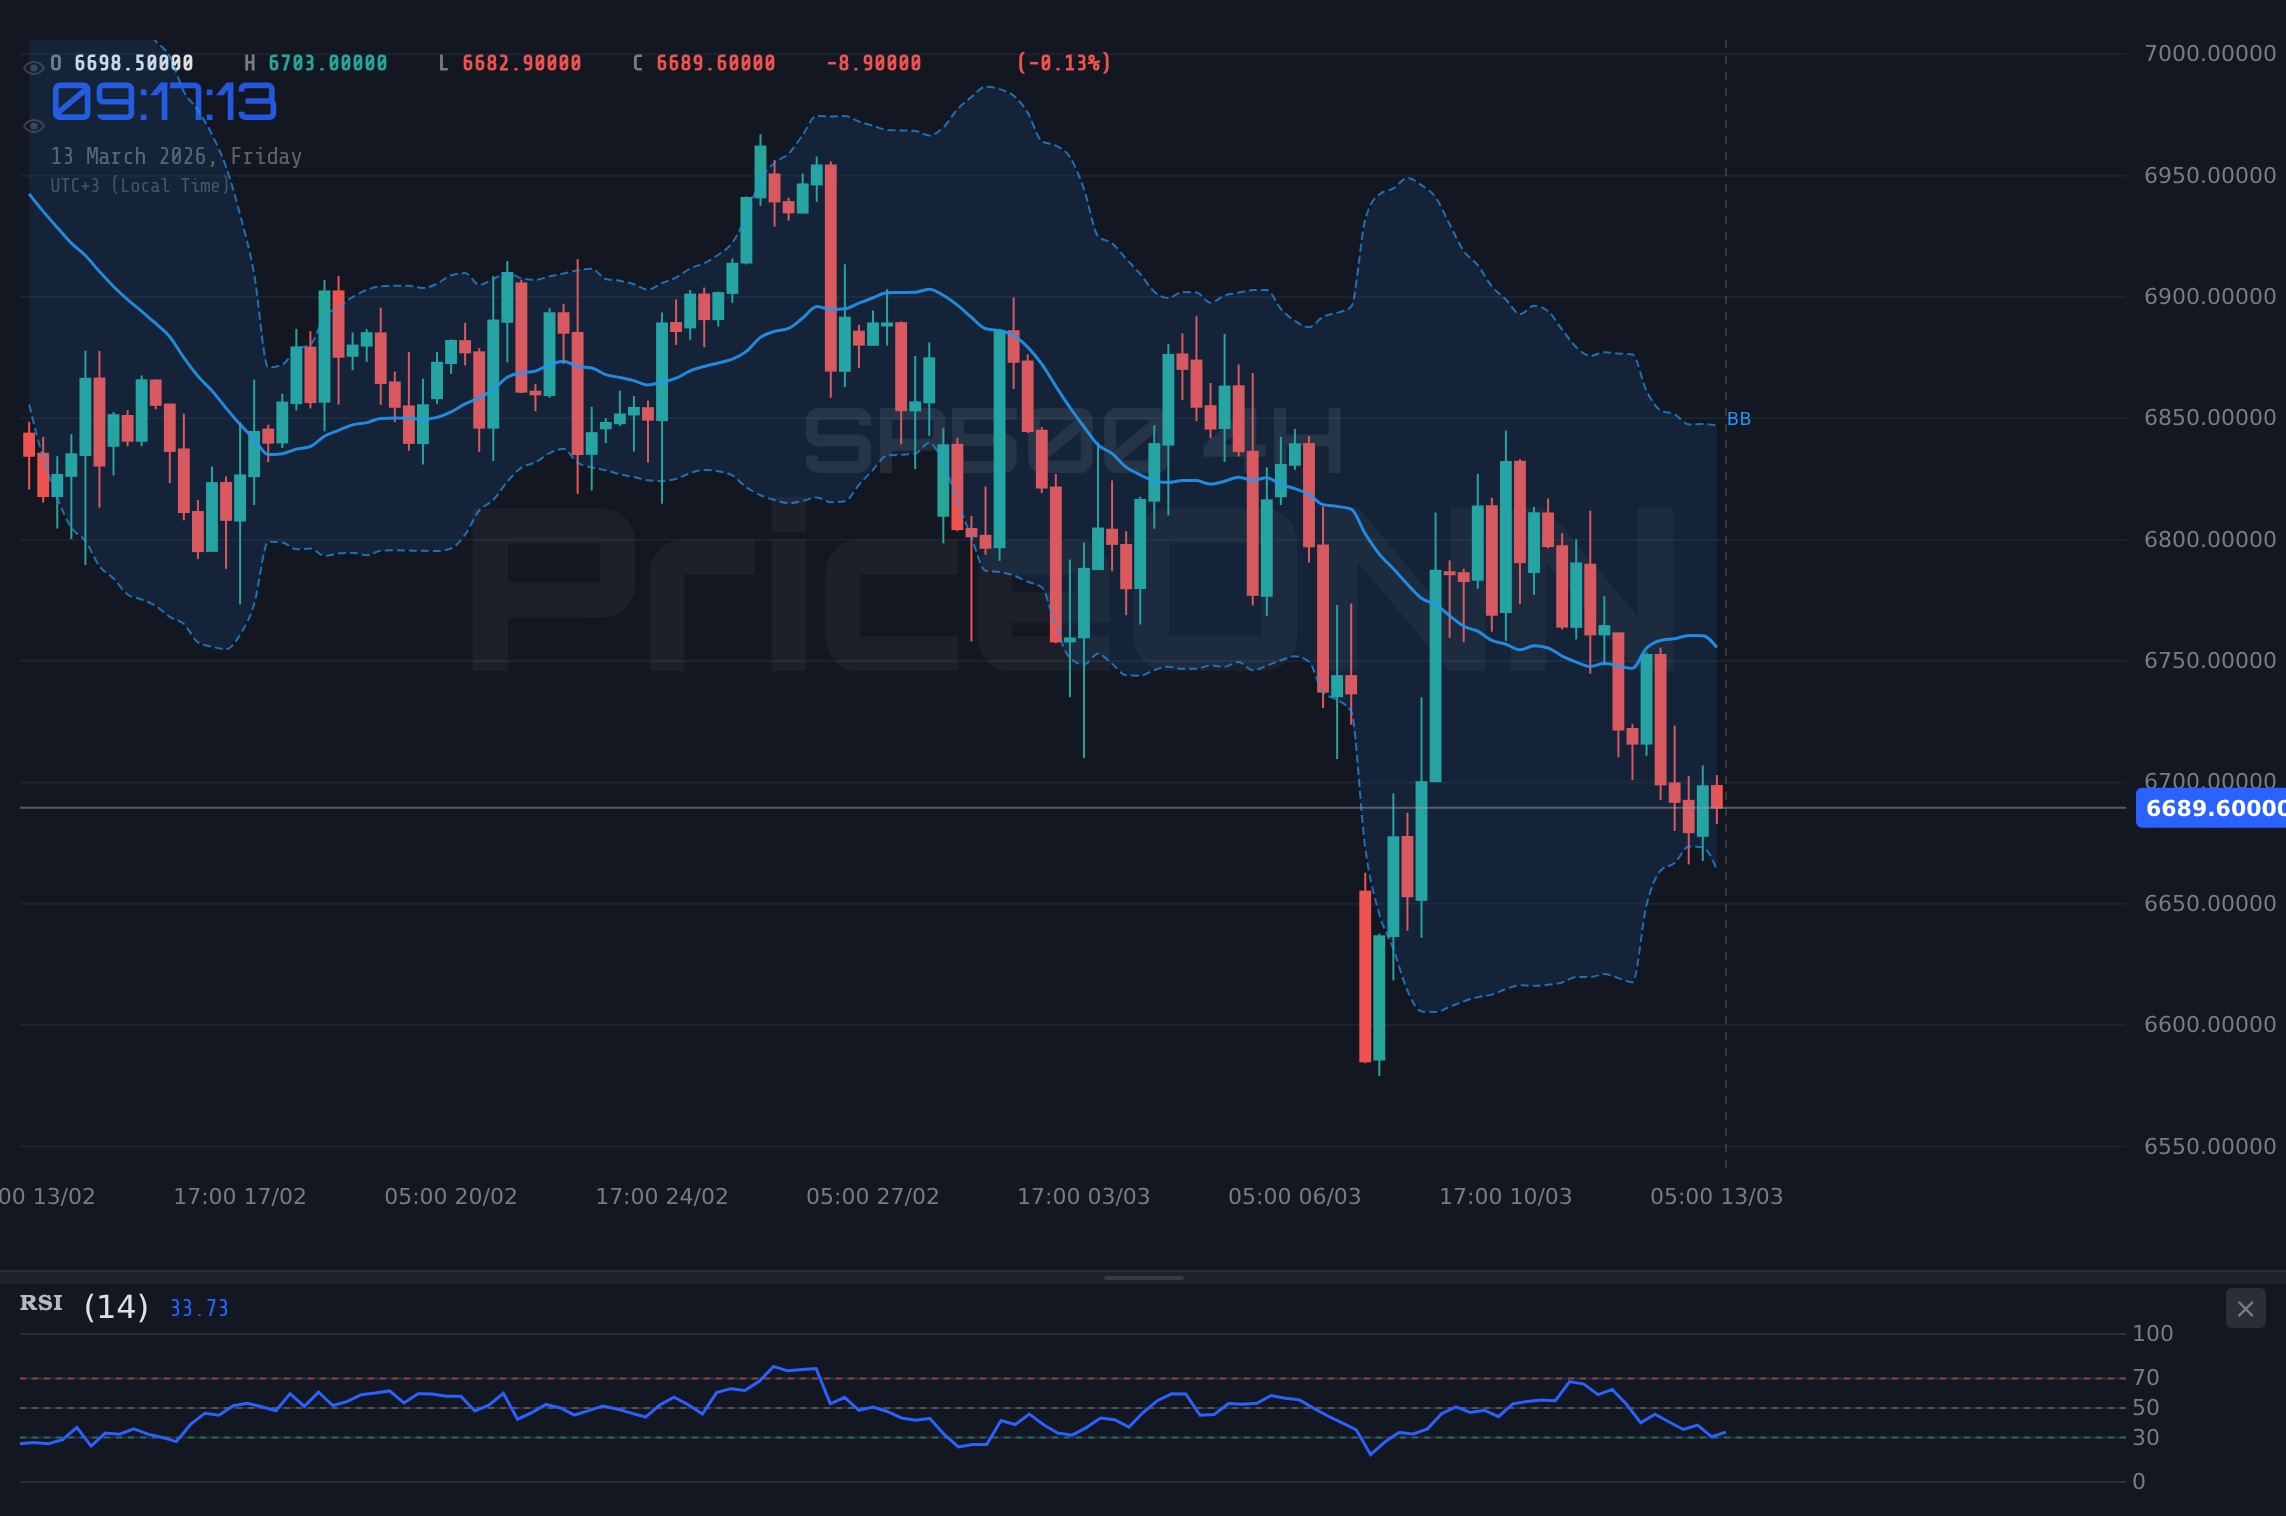
The SP500 is currently trading at $6,687.65, a level that is proving to be a crucial battleground between bulls and bears. The index faces significant headwinds, with technical indicators suggesting a potential continuation of the bearish trend. Investors are closely watching whether this key support can hold, or if a breakdown will lead to further declines. The outcome could dictate the market's direction for the coming days and weeks, making it essential to understand the underlying dynamics at play.
Why $6,675 is the Line in the Sand
The $6,675 level represents a significant support zone for the SP500. This area has been tested multiple times in recent sessions, and its ability to hold will be crucial in determining the index's short-term trajectory. A break below this level could trigger a wave of selling pressure, potentially leading to a test of lower support levels at $6,651.6 and $6,635.6, based on the 4H timeframe data. Conversely, if the SP500 manages to maintain its position above $6,675, it could signal a potential rebound and a move towards higher resistance levels. The outcome hinges on the interplay between technical factors and market sentiment, with geopolitical risks adding another layer of complexity.
The Bull's Roadmap: A Rebound Scenario
For the bullish scenario to unfold, the SP500 needs to decisively break above the immediate resistance at $6,695.77, as indicated by the 1H timeframe data. This breakout would need to be accompanied by strong volume and positive momentum, signaling renewed buying interest. A successful breach of this resistance level could pave the way for a test of the next target at $6,704.03, and potentially even $6,709.87. This bullish scenario would likely require a shift in market sentiment, driven by positive economic data or a de-escalation of geopolitical tensions. Scalpers would watch for a quick move above $6,695.77 to target $6,704.03, while swing traders would await a daily close above $6,709.87 to confirm the breakout. Long-term investors might see this as an opportunity to add to their positions, anticipating further gains in the coming months.
Where Bears Take Control: The Downside Scenario
The bearish scenario gains traction if the SP500 fails to hold the critical support at $6,675. A breakdown below this level could trigger a sharp sell-off, with the index potentially targeting the next support zone at $6,651.6, followed by $6,635.6. The 4H timeframe data indicates that a break below $6,675 would confirm the bearish trend, with the RSI at 41.9 further supporting the downside potential. The MACD histogram on the daily chart also shows negative momentum is building, adding further weight to this scenario. This bearish outlook could be exacerbated by escalating geopolitical tensions or disappointing economic data. Scalpers would likely short the SP500 on a break below $6,675, targeting $6,651.6 for a quick profit. Swing traders would look for a sustained move below $6,635.6 to confirm the bearish trend, while long-term investors might consider reducing their exposure to equities in anticipation of further declines.
The Waiting Game: A Range-Bound Scenario
A third scenario is a continuation of the current range-bound trading, where the SP500 remains stuck between the support at $6,675 and the resistance at $6,695.77. This scenario could play out if market participants are hesitant to take a clear directional stance, awaiting further catalysts to drive the market. The ADX reading of 16.46 on the 4H timeframe suggests a weak trend, supporting the possibility of a range-bound environment. In this scenario, scalpers might engage in short-term trading, buying at support and selling at resistance. Swing traders would likely remain on the sidelines, awaiting a clear breakout or breakdown to initiate a position. Long-term investors might adopt a wait-and-see approach, monitoring the market for signs of a decisive move in either direction.
The SP500's current struggle near $6,687.65 highlights the delicate balance between bullish and bearish forces. A decisive break above $6,695.77 could signal a bullish reversal, while a drop below $6,675 would likely confirm the bearish trend. Traders should closely monitor these key levels and adjust their strategies accordingly, managing risk appropriately.
Probability Assessment: What's Most Likely?
Based on the current technical and fundamental backdrop, the bearish scenario appears to be the most likely, with an estimated probability of 50%. The negative momentum on the daily chart, coupled with the RSI readings and the ongoing geopolitical tensions, suggests that the downside risks are elevated. The bullish scenario is assigned a probability of 30%, contingent on a decisive break above $6,695.77 and a shift in market sentiment. The range-bound scenario is given a probability of 20%, reflecting the possibility of continued indecision in the market. However, a major news event or a significant shift in economic data could quickly alter these probabilities, underscoring the need for constant vigilance and adaptability.
Correlation Analysis: DXY, Bonds, and Oil
The SP500's movements are closely correlated with other key markets, including the DXY (Dollar Index), bond yields, and oil prices. With the DXY currently at 99.59, a rising dollar typically puts pressure on equities, as it makes US assets more expensive for foreign investors. Rising bond yields can also weigh on the SP500, as they increase borrowing costs for companies and reduce the attractiveness of stocks relative to bonds. Oil prices, on the other hand, can have a mixed impact. Higher oil prices can boost the energy sector but also contribute to inflationary pressures, potentially leading to tighter monetary policy and lower equity valuations. The recent surge in crude oil prices, fueled by tensions in the Middle East, is adding another layer of complexity to the SP500's outlook, increasing inflation concerns. Traders should monitor these correlations closely to gain a more comprehensive understanding of the SP500's potential trajectory. The USD/CAD climbing to 1.3620 as geopolitical risk weighs on the Loonie also indicates a risk-off sentiment that could further pressure the SP500.
What I'm Watching: Key Triggers This Week
Several key triggers could influence the SP500's direction this week. First, the upcoming USD data releases will be closely watched for clues about the Federal Reserve's future monetary policy decisions. Stronger-than-expected data could lead to a more hawkish stance from the Fed, potentially putting downward pressure on equities. Second, any further escalation of geopolitical tensions in the Middle East could trigger a flight to safety, boosting demand for safe-haven assets like gold and US Treasuries, while weighing on risk assets like the SP500. Finally, the earnings reports from major companies will provide insights into the health of the corporate sector and the overall economy. Positive surprises could provide a boost to the SP500, while negative surprises could exacerbate the bearish trend. Watch for a daily close above $6,695.77 to signal a bullish reversal, or a daily close below $6,675 to confirm the bearish trend.
Frequently Asked Questions: SP500 Analysis
What happens if SP500 breaks below $6,675 support?
A break below the $6,675 support level could trigger a significant sell-off, potentially leading to a test of the next support zone at $6,651.6. This scenario would likely confirm the bearish trend and could be exacerbated by negative news or escalating geopolitical tensions.
Should I buy SP500 at current levels of $6,687.65 given the RSI reading?
With the RSI at 41.9 on the 4H chart, the SP500 is not yet oversold, suggesting further downside potential. Therefore, buying at current levels carries significant risk. It would be prudent to await a more oversold reading or a confirmed bullish reversal before initiating a long position.
Is the negative MACD histogram a reliable sell signal for SP500?
The negative MACD histogram on the daily chart indicates that bearish momentum is building. While not a definitive sell signal on its own, it adds weight to the bearish scenario and suggests that caution is warranted. Confirmation from other indicators and price action is recommended before initiating a short position.
How will upcoming USD data affect SP500 this week?
Upcoming USD data releases could have a significant impact on the SP500. Stronger-than-expected data could lead to a more hawkish stance from the Fed, potentially putting downward pressure on equities. Conversely, weaker-than-expected data could ease concerns about inflation and support a more dovish Fed, potentially providing a boost to the SP500.
Technical Outlook Summary
| Indicator | Value | Signal | Interpretation |
|---|---|---|---|
| RSI (14) | 41.9 | Bearish | Further downside potential |
| MACD Histogram | Negative | Bearish | Negative momentum building |
| Stochastic | 16.87 | Neutral | Not yet oversold |
| ADX | 16.46 | Weak | Trend is not strong |
| Bollinger | Middle Band | Watch | Price below middle band |
Key Levels
Support Levels
Resistance Levels
Track markets in real-time
AI-powered analysis, technical indicators and real-time price data.
Join Our Telegram Channel
Breaking market news, AI analysis and trading signals instantly.
Join Channel