

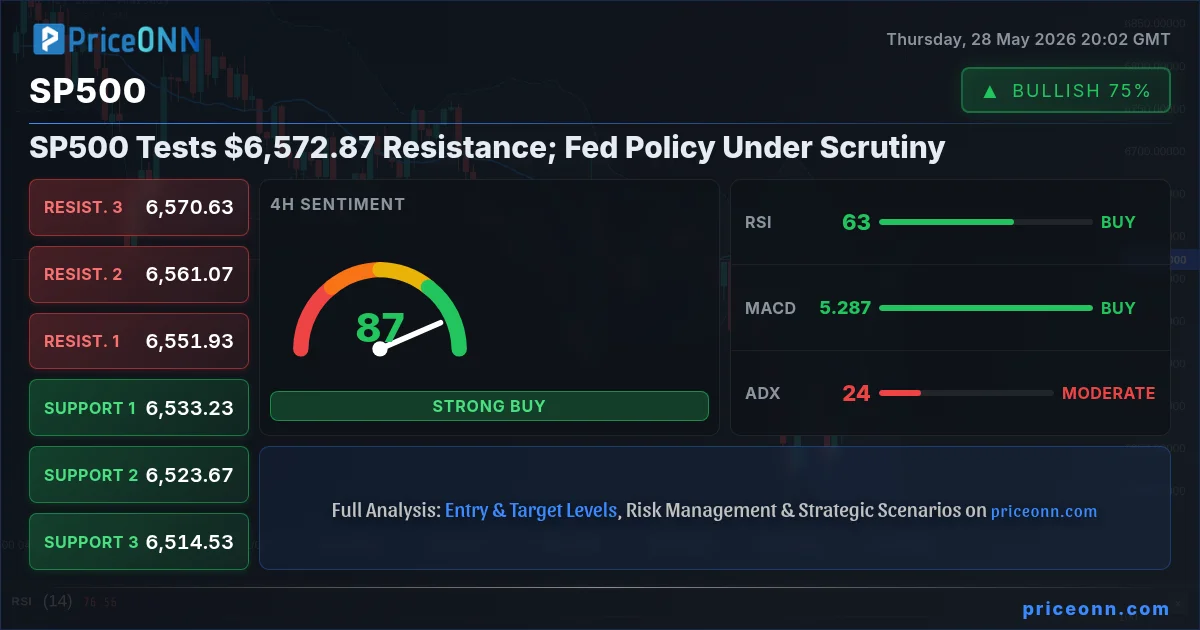
The S&P 500 is currently trading at $6,572.87, hovering near critical resistance levels as the market grapples with a complex interplay of persistent inflationary pressures and the Federal Reserve's policy stance. This pivotal moment demands a deep dive into the market's intricate dynamics, exploring how various asset classes and geopolitical factors are shaping the outlook for the US equity benchmark. With the index testing the upper bounds of its recent trading range, the question on every trader's mind is whether this rally has legs or if a correction is imminent.
- The SP500 is currently trading at $6,572.87, facing resistance near $6,605.
- RSI at 70.95 on the 1H chart signals overbought conditions, suggesting potential for a short-term pullback.
- Critical support for the SP500 sits at $6,526.53, tested multiple times this week.
- The DXY at 98.75 is showing weakness, which historically supports risk assets like equities, but Fed policy remains a key uncertainty.
The S&P 500's journey towards the $6,605 resistance zone is unfolding against a backdrop of significant macroeconomic crosscurrents. While the index has shown resilience, climbing from its recent low of $6,522.10, the underlying economic narrative remains fraught with uncertainty. Recent breaking news highlights the Federal Reserve's commitment to its current policy, even as inflationary pressures resurge. This signals a potential tug-of-war between the Fed's resolve and market expectations, creating a volatile environment for equities. Understanding this delicate balance is paramount for navigating the choppy waters ahead. The correlation between the SP500 and the Dollar Index (DXY), currently at 98.75, is also a critical factor to monitor. A weaker dollar typically supports risk appetite, but the Fed's unwavering stance could complicate this relationship.
The Bull's Roadmap: Targeting New Highs
For the bulls to maintain control, the S&P 500 needs to decisively break above the $6,605.07 resistance. This would signal a continuation of the upward momentum, potentially targeting the next significant resistance level at $6,685.83. Such a move would likely be fueled by a combination of strong corporate earnings, dovish signals from the Fed (or at least a less hawkish tone than currently feared), and a general easing of geopolitical tensions. Historically, when the SP500 has managed to clear such key resistance levels with conviction, especially on increasing volume, it has often paved the way for further upside. The ADX at 49.72 on the 1H chart indicates a strong existing uptrend, which could support a breakout scenario if other conditions align. A sustained move above $6,605.07, coupled with a decline in the DXY and a stabilization or rebound in oil prices, would paint a bullish picture. The Nasdaq 100, currently trading at 30,216.69, also shows strength on the 1H chart (ADX 19.42), suggesting tech-sector leadership could accompany a broader market rally. If the SP500 can maintain its upward trajectory, pushing past $6,605.07, the psychological barrier could be broken, attracting more buyers and potentially leading to a retest of higher levels.
Where Bears Could Take Control: A Test of Support
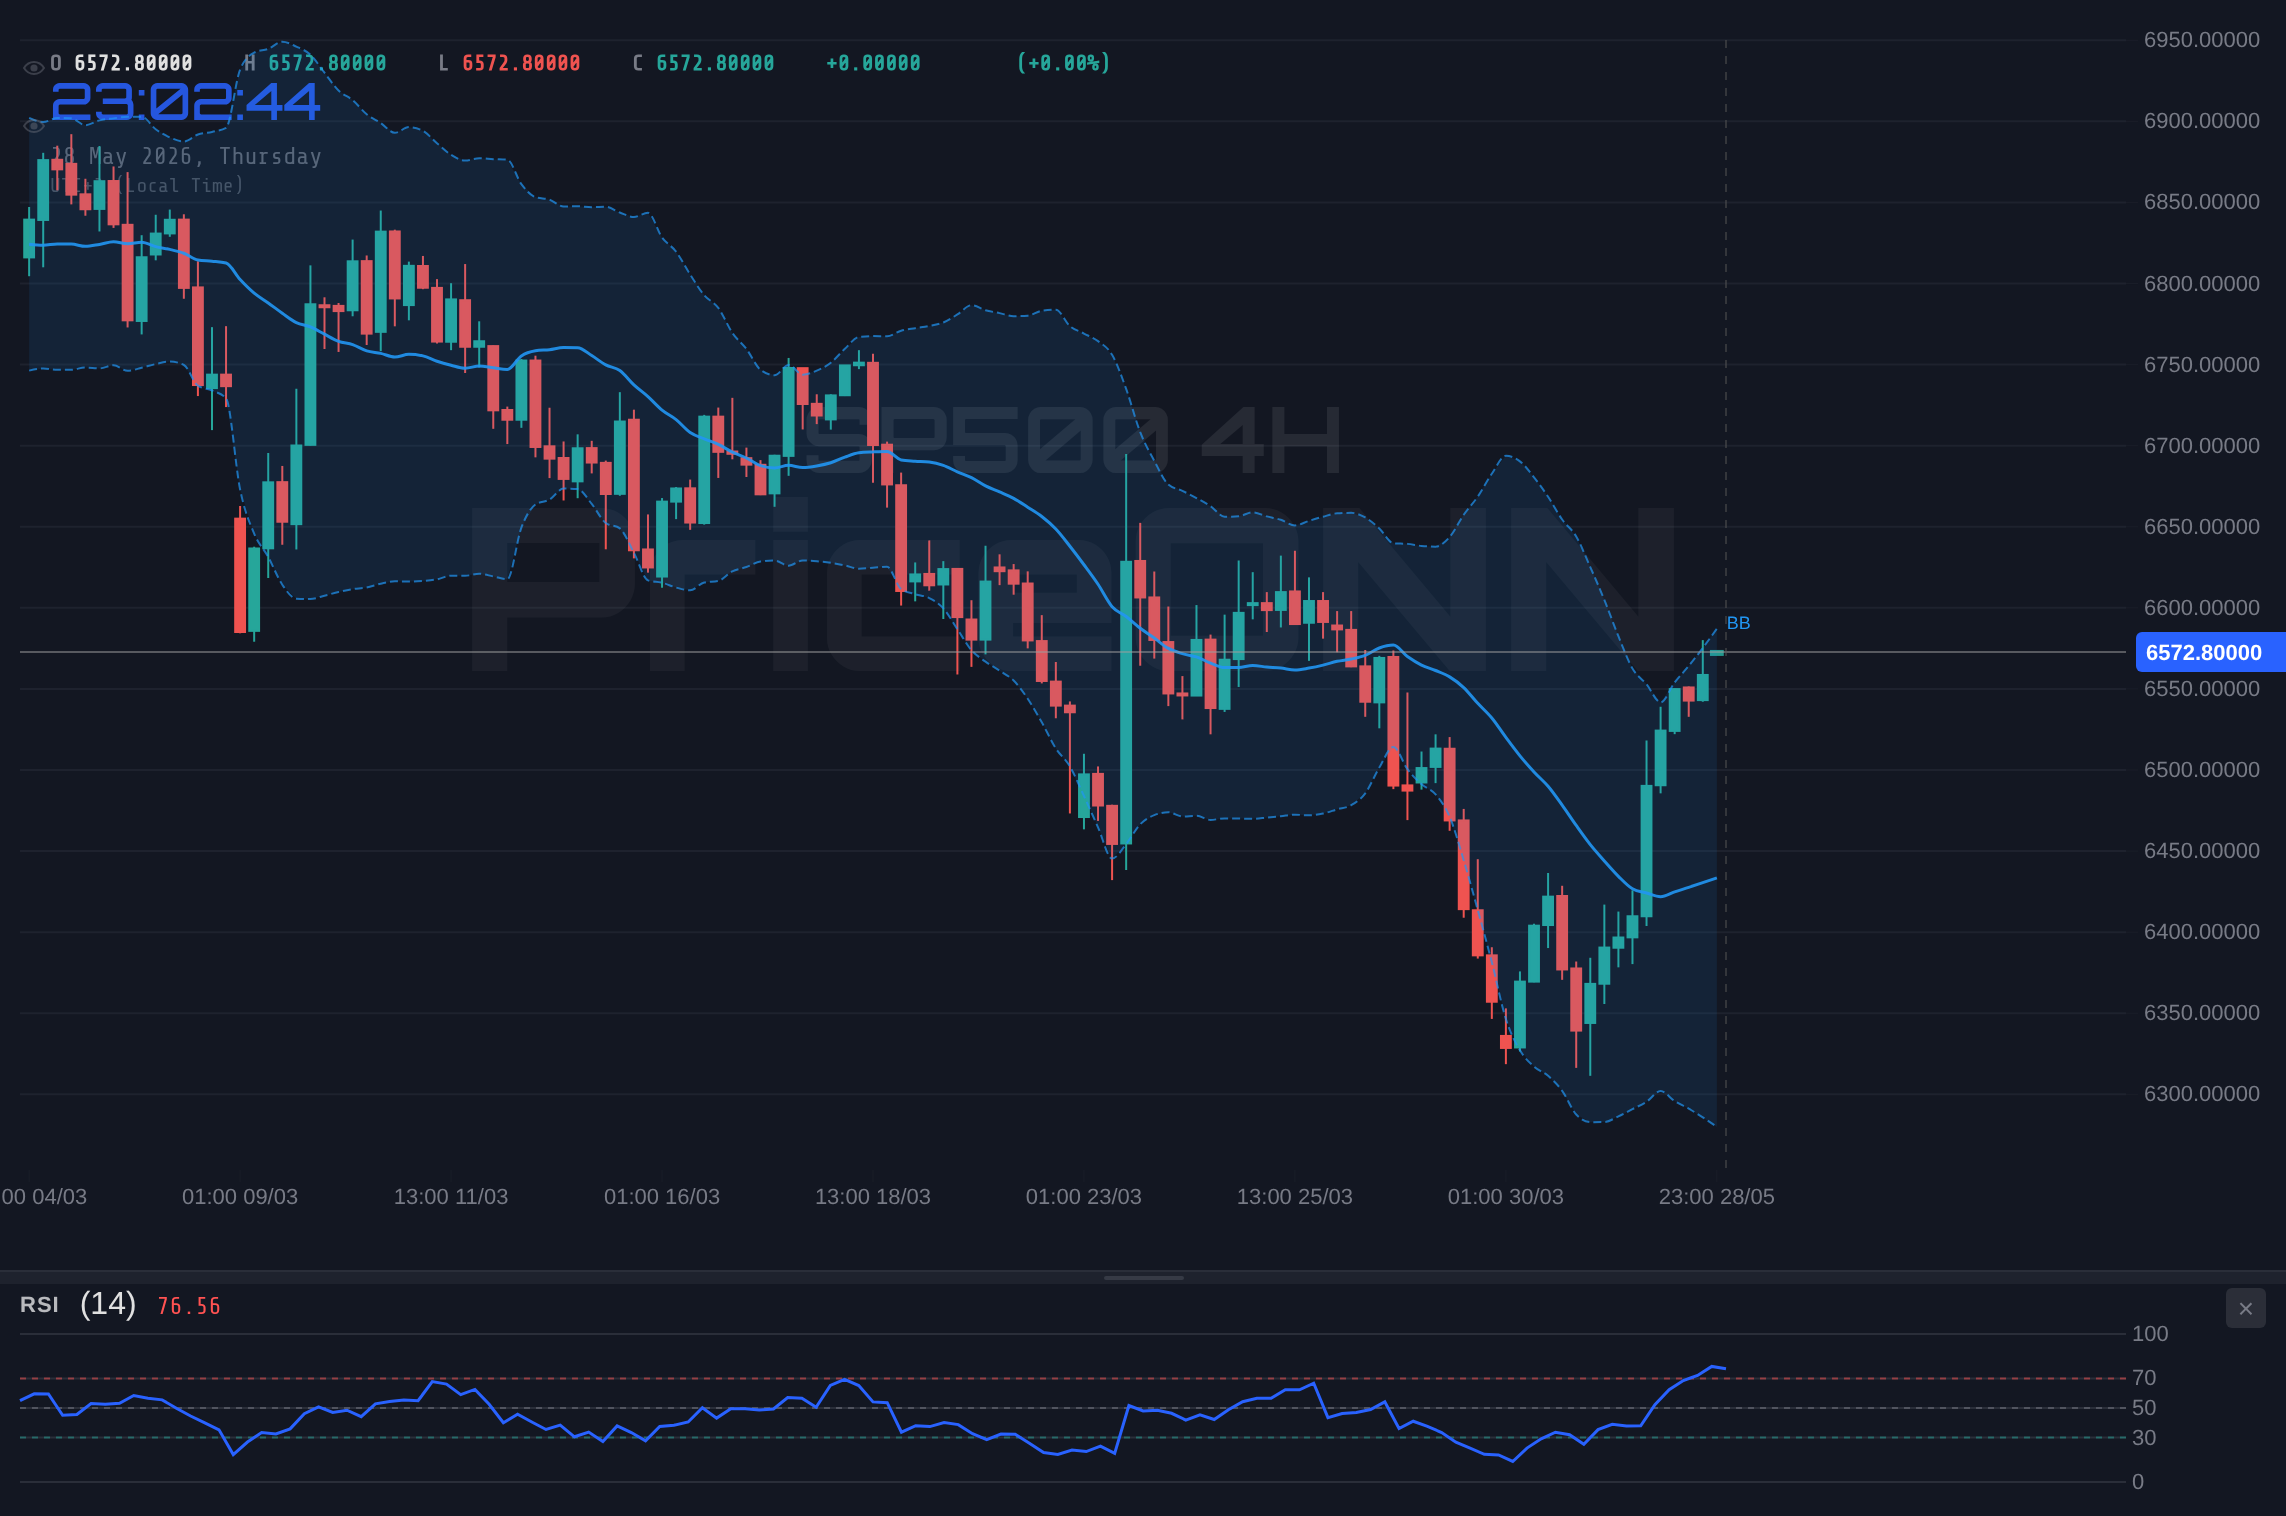
Conversely, failure to overcome the $6,605.07 resistance could see the bears reassert their dominance, pushing the index back towards its support levels. The immediate floor is identified at $6,568.73, followed by a more significant level at $6,547.63, and critically, $6,526.53. A break below $6,526.53 would invalidate the current bullish structure and open the door for a deeper correction, potentially targeting the 4H support at $6,514.53 and even the daily support at $6,377.47. This bearish scenario would likely be triggered by a confluence of negative factors: sticky inflation data prompting the Fed to maintain its hawkish stance, escalating geopolitical risks that dampen risk appetite, or a significant downturn in correlated markets like the Nasdaq 100 or even oil prices. The RSI(14) on the 1H chart currently sits at 70.95, bordering on overbought territory, which often precedes a pullback. If this indicator continues to decline and MACD crosses below its signal line on the 1H chart, it could signal the start of a bearish move. The daily chart for SP500 shows a strong downtrend (ADX 47.51), indicating that underlying weakness might still be present despite recent gains.
The Waiting Game: Sideways Consolidation
Between the immediate resistance at $6,605.07 and the support at $6,526.53 lies a range where the S&P 500 could consolidate. This neutral scenario is characterized by indecision in the market, with neither bulls nor bears able to gain a decisive advantage. Such consolidation often occurs when conflicting economic signals create uncertainty, leading traders to await clearer direction. For instance, if inflation data comes in mixed, or if Fed commentary offers no new insights, the market might drift sideways. During this period, technical indicators can become less reliable, with RSI hovering in the mid-50s and MACD showing choppy signals. The ADX, which is currently strong on the 1H chart (49.72), would likely weaken if the price action becomes range-bound. This consolidation phase could be a period of accumulation or distribution, depending on the underlying sentiment and the eventual catalyst that breaks the stalemate. Traders might look for a clear break of either the support or resistance levels to initiate new positions, while those playing the range might attempt to trade between the defined boundaries, albeit with tighter stop-losses.
The Most Likely Scenario: A Test of Resolve
Given the current technical readings and the prevailing macroeconomic narrative, the most probable scenario for the S&P 500 in the short term involves a test of the $6,605.07 resistance, with a significant chance of a subsequent pullback. The 1H RSI at 70.95 is a strong signal of potential overbought conditions, suggesting that the recent rally might be losing steam. While the ADX indicates a strong trend, the divergence between the 1H and daily charts (1H: strong uptrend, Daily: strong downtrend) highlights underlying tension. The market is caught between the desire for risk-on assets, supported by a weaker dollar (DXY at 98.75), and the fear of persistent inflation that could force the Fed's hand. Therefore, a scenario where the SP500 approaches $6,605.07, fails to break decisively, and then pulls back towards the $6,526.53 support seems most likely. This would play out over the next few trading sessions, with traders closely watching for confirmation signals from economic data releases and Fed commentary. The probability for this scenario is estimated at 65%, reflecting the current technical overbought signals and the persistent macro uncertainties. A bullish continuation scenario, breaking decisively above $6,605.07, is assigned a 25% probability, contingent on overwhelmingly positive news or a dovish Fed pivot. The bearish breakdown below $6,526.53 is given a 10% probability in the immediate short-term, but this could increase if key support levels fail.
Bearish Scenario: The Reversal Play
65% ProbabilityBullish Scenario: Breaking the Ceiling
25% ProbabilityNeutral Scenario: The Waiting Game
10% ProbabilityWhat I'm Watching This Week
The coming week is packed with crucial economic data and central bank commentary that will likely dictate the S&P 500's next move. Firstly, I'll be closely monitoring any further statements from Federal Reserve officials regarding inflation and interest rate policy. Any hint of a more hawkish stance could quickly derail the current rally. Secondly, key economic indicators such as employment figures and inflation reports will be critical. A significant deviation from expectations, either positive or negative, could trigger a sharp move. For instance, stronger-than-expected inflation data could lead to a re-evaluation of the Fed's path and pressure the SP500 lower, while softer data might embolden the bulls. Lastly, I'm watching the DXY's reaction to these events. If the dollar weakens significantly, it could provide a tailwind for equities, even amidst hawkish Fed rhetoric. The interplay between these factors will be key to determining whether the index breaks out to new highs or succumbs to profit-taking pressure.
Frequently Asked Questions: SP500 Analysis
What happens if SP500 breaks above the $6,605.07 resistance level?
A decisive break above $6,605.07, particularly on strong volume, would signal a continuation of the bullish trend. This could lead to further upside, with the next significant target at $6,685.83, and potentially extend towards $6,832.67 if market sentiment remains strongly positive.
Should I buy SP500 at current levels near $6,572.87, given the RSI is at 70.95?
Buying at current levels near $6,572.87 requires caution due to the 1H RSI reading of 70.95, indicating overbought conditions. A more prudent approach might be to wait for a pullback towards the $6,547.63 support or confirmation of a sustained break above $6,605.07 before entering long positions.
Is the RSI at 70.95 a sell signal for SP500 right now?
An RSI of 70.95 on the 1H chart suggests overbought conditions, which historically can precede a short-term pullback or consolidation. It's not an outright sell signal on its own but warrants close observation for bearish confirmation, such as MACD divergence or a break of immediate support.
How will upcoming Fed policy signals affect SP500 this week, with DXY at 98.75?
Hawkish signals from the Fed, despite current DXY weakness at 98.75, could pressure the SP500 lower as markets price in higher rates. Conversely, dovish commentary or a pause in hawkish rhetoric could support the index, especially if it aligns with a continued dollar decline.
| Indicator | Value | Signal | Interpretation |
|---|---|---|---|
| RSI (14) | 70.95 | Overbought | Potential for pullback or consolidation. |
| MACD Histogram | -0.54 | Negative Momentum | Bearish momentum building on 1H chart. |
| Stochastic | K:65.73, D:73.5 | Oversold | %K below %D suggests downward pressure. |
| ADX | 49.72 | Strong Trend | Indicates a strong existing trend, could support breakout or reversal. |
| Bollinger | Middle Band | Watch | Price currently above middle band, showing upward pressure. |
Track markets in real-time
AI-powered analysis, technical indicators and real-time price data.
Join Our Telegram Channel
Breaking market news, AI analysis and trading signals instantly.
Join Channel