

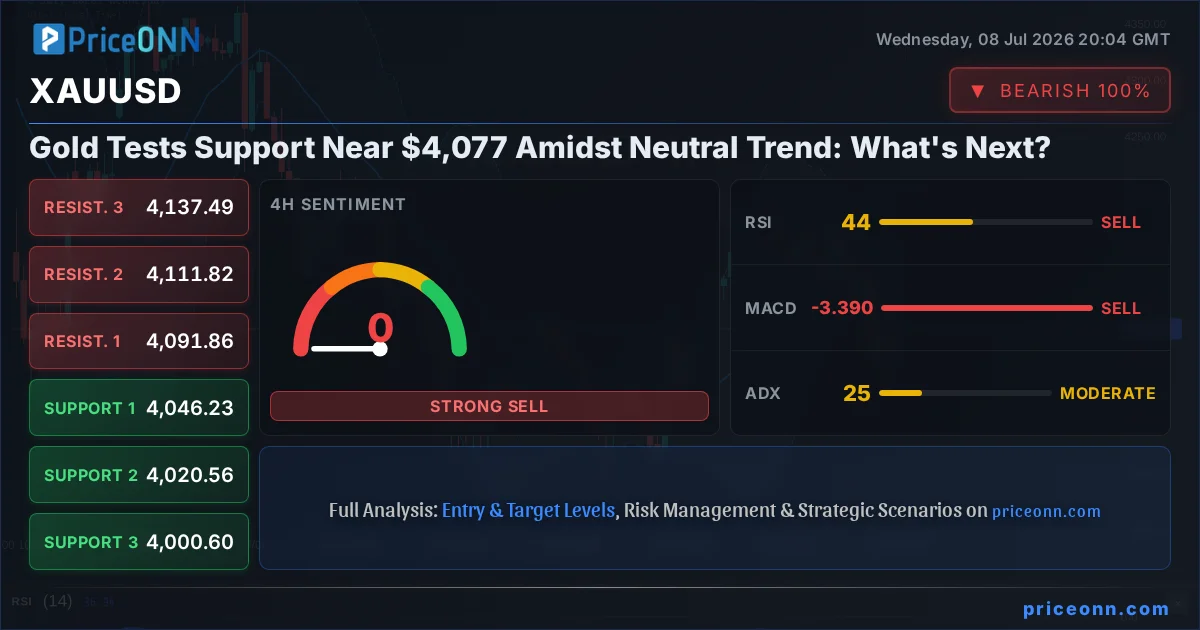
Amidst a complex global economic landscape, gold, or XAUUSD, finds itself at a critical juncture, currently trading at $4,077.41. This pivotal price point comes as the precious metal hovers near significant support levels, painting a picture of cautious consolidation rather than outright directional conviction. The prevailing neutral trend, coupled with mixed signals across multiple timeframes, demands a nuanced approach from traders and investors alike. Understanding the interplay between macroeconomic drivers, geopolitical undercurrents, and the intricate dance of technical indicators is paramount for navigating the immediate future of gold prices. This analysis delves into the current market sentiment, cross-market correlations, and the technical underpinnings that are shaping gold's trajectory, offering a comprehensive outlook for the days and weeks ahead.
- RSI at 46.11 on the 1-hour chart signals a neutral-to-downward lean, indicating that bulls are not in full control.
- Critical support for XAUUSD is identified at $4,068.01, with further levels at $4,051.85 and $4,040.28.
- The ADX at 37.89 on the daily timeframe suggests a strong trend is in play, though its direction is currently debated by other indicators.
- Correlation analysis shows that a rising DXY at 100.98 puts downward pressure on gold, a dynamic that remains a key factor for short-term price action.
- Geopolitical tensions, particularly concerning Iran, are creating underlying support for gold as a safe-haven asset, even as other factors weigh on the price.
The narrative surrounding gold prices is currently one of watchful waiting, a sentiment amplified by the approaching release of crucial US Federal Reserve minutes and ongoing geopolitical developments. The yellow metal has experienced a notable retreat from its recent highs, settling around the $4,077.41 mark. This price action is occurring within a broader context where the US Dollar Index (DXY), currently at 100.98, exerts significant influence. A stronger dollar typically acts as a headwind for dollar-denominated commodities like gold, as it increases the cost for holders of other currencies. The recent uptick in the DXY suggests that, at least for now, the greenback is finding some footing, contributing to the pressure on gold.
Furthermore, the broader market sentiment, often gauged by the performance of equity indices like the S&P 500 (currently at 6572.87) and Nasdaq (at 29217.55), plays a crucial role. A risk-off environment, characterized by falling stock markets, usually bolsters demand for safe-haven assets such as gold. Conversely, a robust risk appetite, where equities are climbing, can divert capital away from traditional safe havens. While the S&P 500 shows some upward momentum on the day, the underlying trend on the daily chart is still considered bearish by many analysts, hinting at potential future headwinds for riskier assets and, by extension, a potential tailwind for gold should sentiment shift.
Navigating the Technical Landscape: A Multi-Timeframe Confluence
Short-Term Signals: A Mixed Bag on the 1-Hour Chart
Examining the 1-hour timeframe for XAUUSD reveals a market in a delicate balance. The trend is officially classified as neutral, with a strength of 50%, underscoring the indecision currently gripping traders. Key support levels are situated at $4,068.01, $4,051.85, and $4,040.28. These are the immediate lines in the sand that bulls must defend to prevent further downside. On the resistance side, $4,095.74, $4,107.31, and $4,123.47 represent hurdles that buyers need to overcome to signal a potential reversal. The Relative Strength Index (RSI) at 46.11 resides in the neutral zone, leaning slightly towards a bearish inclination, which suggests that momentum is not strongly favoring buyers at this moment. While the MACD exhibits positive momentum, with the MACD line above its signal line, the overall picture from this timeframe is one of caution. The Stochastic oscillator, however, offers a conflicting signal at K=79.38 and D=41.44, indicating a potential for upward movement from oversold conditions, a divergence that highlights the choppiness of the intraday market.
The Average Directional Index (ADX) at 22.24 points to a trend of moderate strength, but its directional bias is being challenged by the other indicators. This confluence of neutral-to-slightly-bearish RSI, mixed MACD signals, a conflicting Stochastic, and moderate ADX strength results in an overall 'SELL' signal based on the aggregated indicator readings (3 Buy, 5 Sell, 0 Neutral). This suggests that while short-term traders might find opportunities, the prevailing sentiment on the hourly chart leans towards caution and potential further declines unless key support levels are decisively held.
The 4-Hour Perspective: Bearish Undertones Emerge
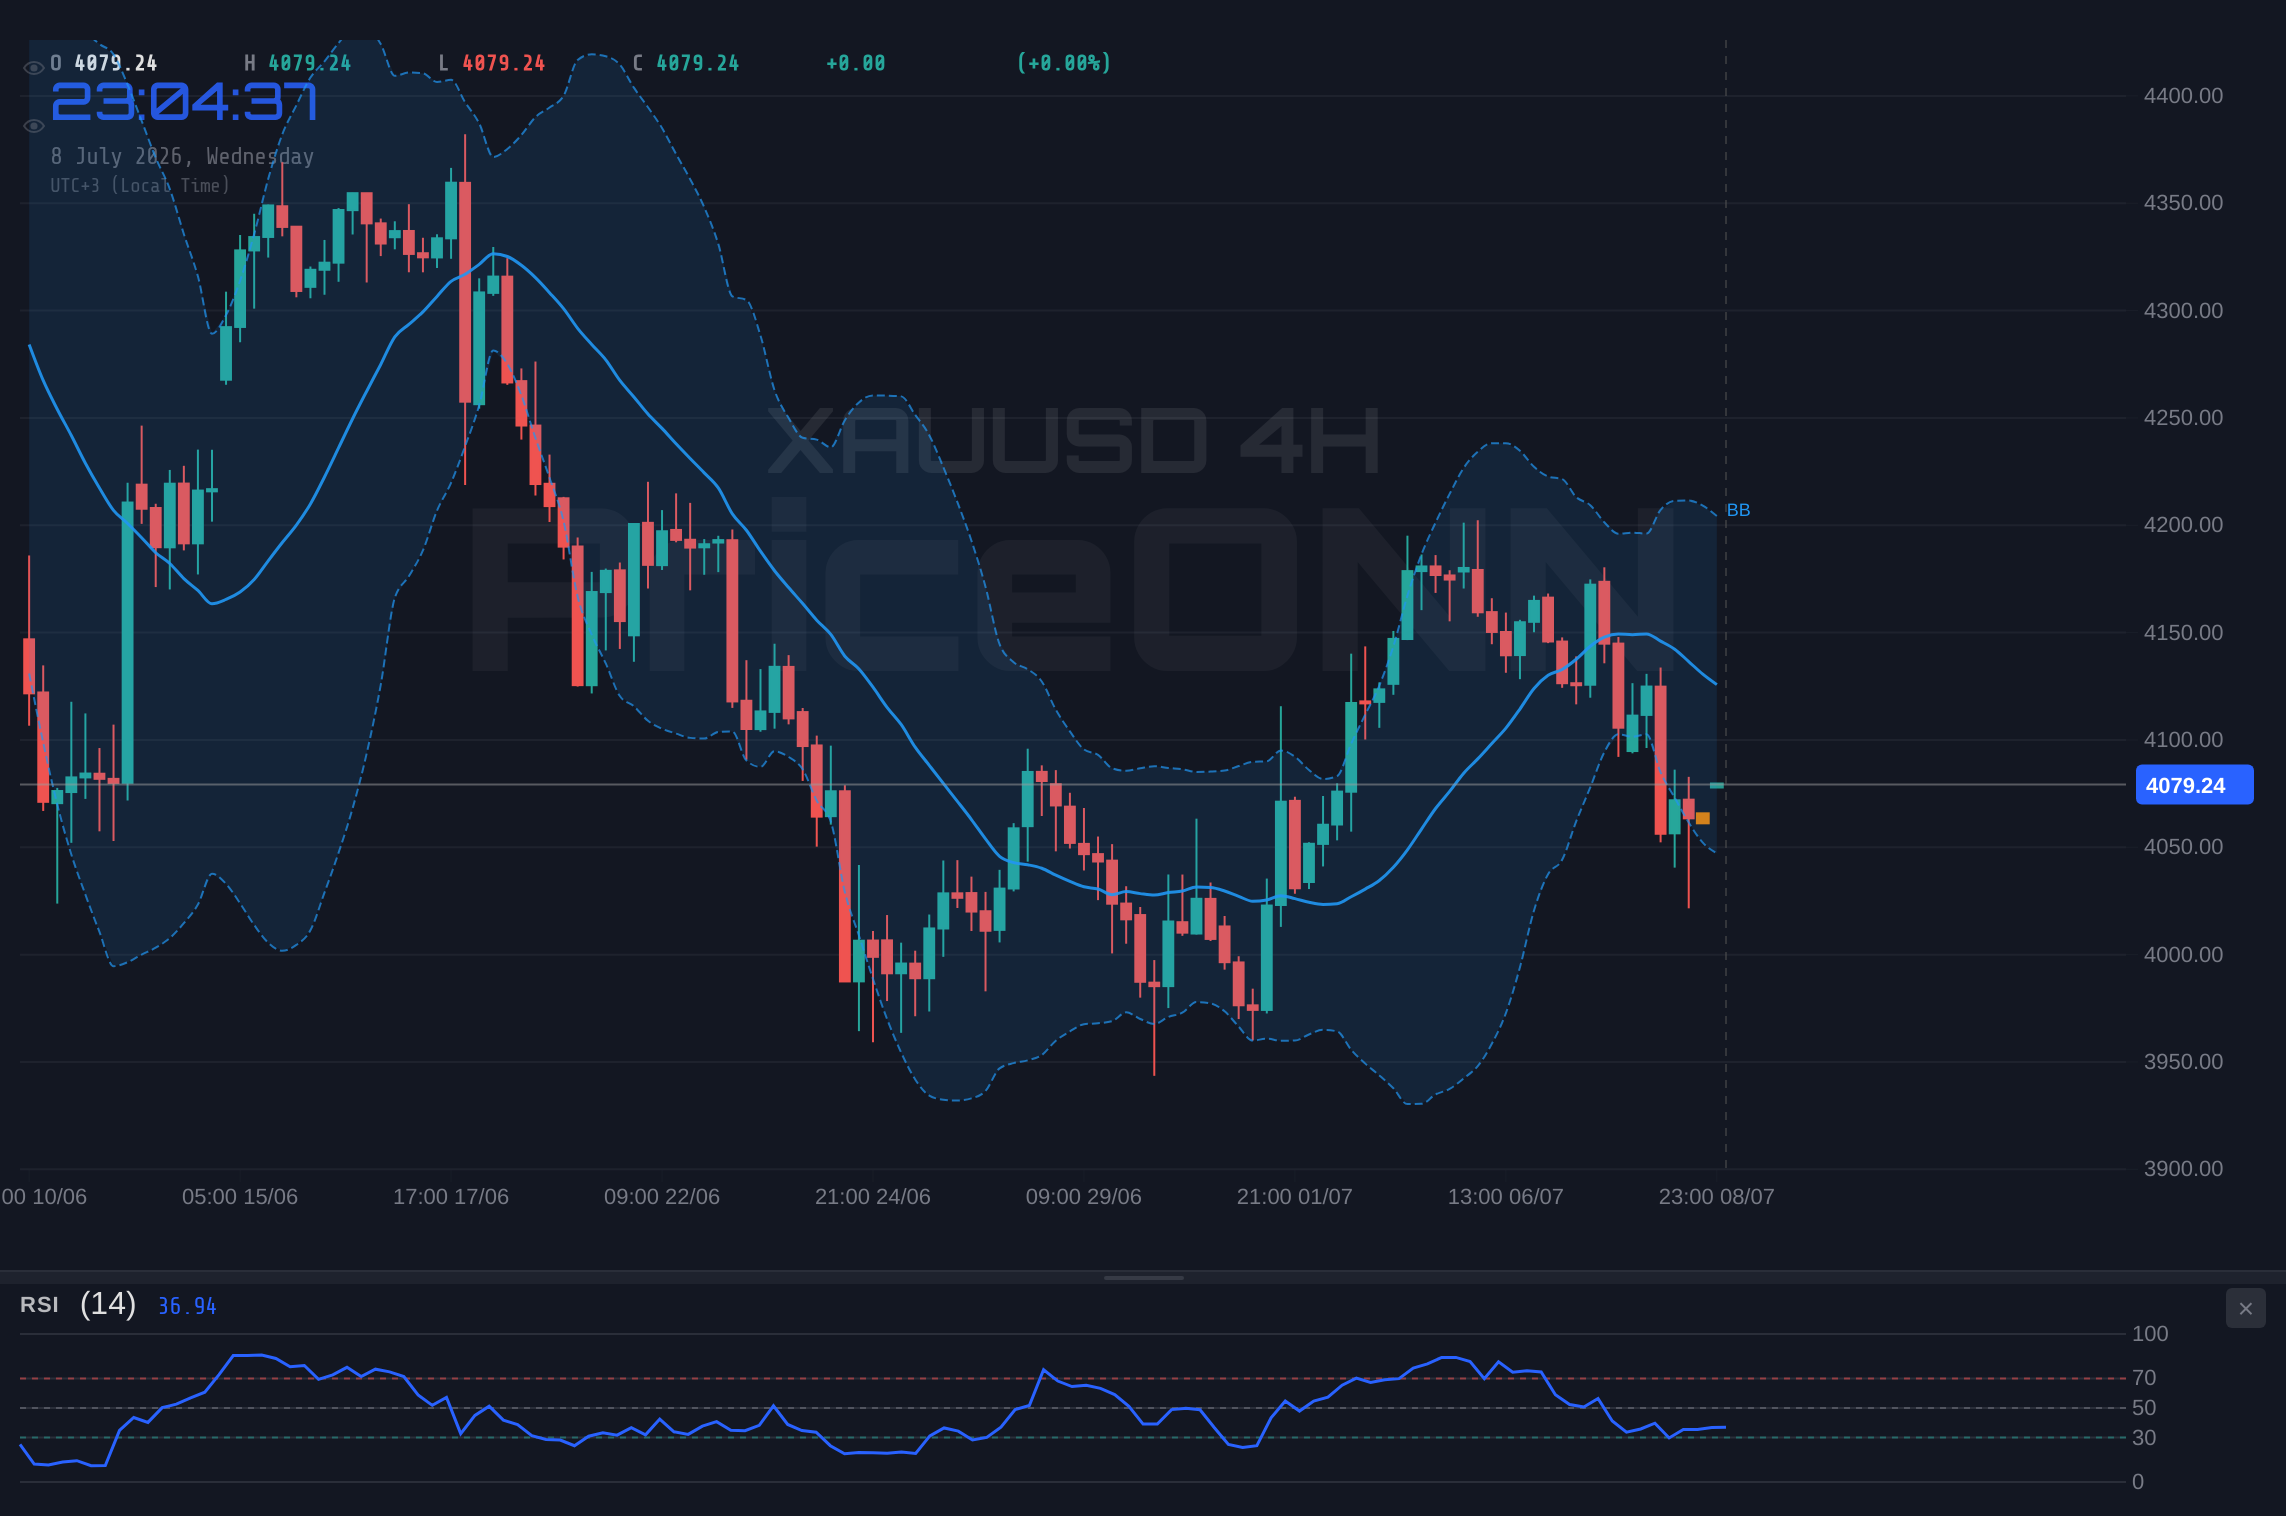
Stepping back to the 4-hour chart provides a slightly more bearish hue to the XAUUSD outlook. The trend remains neutral, again with 50% strength, but the indicators are beginning to align more consistently on the downside. Support levels are identified at $4,046.23, $4,020.56, and $4,000.60, while resistance is pegged at $4,091.86, $4,111.82, and $4,137.49. The RSI at 43.4 further reinforces the bearish lean, sitting comfortably in the neutral zone but trending downwards. This suggests that sellers have a slight edge in controlling the price action over this intermediate timeframe. The MACD is firmly in negative momentum territory, with the MACD line positioned below its signal line, indicating bearish pressure. Bollinger Bands are showing the price trading below the middle band, reinforcing the downward bias.
Adding to this bearish sentiment, the Stochastic oscillator (K=20.23, D=25.87) is signaling a strong oversold condition, with %K below %D, suggesting potential for a bounce but within a predominantly bearish context. The ADX at 24.91 indicates a moderate trend strength, aligning with the bearish sentiment. Crucially, the aggregated signal across all indicators on the 4-hour chart is a definitive 'SELL' (0 Buy, 8 Sell, 0 Neutral). This strong consensus among indicators on the 4-hour timeframe suggests that any short-term rallies might be met with selling pressure, and the path of least resistance could be downwards until these indicators show signs of shifting.
Daily Timeframe: The Big Picture and Emerging Divergences
On the daily chart, the picture becomes more complex, reflecting the broader uncertainty in the market. The trend is neutral (50% strength), but the aggregated signal is 'SELL' (2 Buy, 6 Sell, 0 Neutral), indicating a prevailing bearish bias even on the longer timeframe. Support levels are more substantial here, located at $4,071.73, $4,037.77, and $3,983.42. Resistance lies at $4,160.04, $4,214.39, and $4,248.35. The RSI at 40.94 is in the neutral zone but trending downwards, consistent with the short-to-intermediate term bearish lean. The MACD, however, shows positive momentum with the MACD line above its signal line, presenting a divergence from the lower timeframes and suggesting that longer-term buyers might still be present.
Bollinger Bands remain below the middle band, indicating a bearish tendency, but the Stochastic oscillator (K=66.62, D=57.91) is showing a bullish signal, with %K above %D and entering the upper territory. This divergence between the RSI and MACD on the daily chart, against the Stochastic's bullish lean, is noteworthy. It implies that while the immediate pressure might be downwards, there's a potential for underlying strength that could emerge if key resistance levels are breached. The ADX at 37.89 is the strongest reading across all timeframes, indicating a robust trend is in place, but the conflicting signals from other indicators prevent a clear directional call solely based on this. This daily timeframe analysis suggests that while the overall signal leans bearish, traders should be aware of potential bullish divergences that could lead to a significant reversal if confirmed.
Macroeconomic Crosscurrents: DXY, Oil, and the Fed Factor
The prevailing narrative for gold is intrinsically linked to macroeconomic forces, chief among them being the trajectory of the US Dollar Index (DXY) and expectations surrounding Federal Reserve policy. With the DXY currently at 100.98, its recent strength is a significant headwind for gold. As a safe-haven asset itself, gold often competes with the dollar for investor capital. When the dollar strengthens, typically due to expectations of higher US interest rates or a perceived increase in global risk aversion, gold tends to face selling pressure. The current technical setup for the DXY on the daily chart, showing a strong uptrend (ADX 36.35) despite some mixed signals, suggests that dollar strength could persist, capping gold's upside potential in the short term.
The upcoming release of the Federal Reserve's FOMC minutes is a critical event on the economic calendar. Traders will be poring over these minutes for any clues about the future path of US monetary policy. Any hint of a more hawkish stance – suggesting further interest rate hikes or a prolonged period of higher rates – could bolster the dollar and put renewed pressure on gold. Conversely, any indication of a more dovish outlook, perhaps signaling a pause or even a future pivot towards rate cuts, could weaken the dollar and provide a significant boost to gold prices. The market's reaction to these minutes will likely set the tone for gold in the coming days and weeks. As of now, CME FedWatch Tool data (if available, otherwise general market sentiment) indicates a certain probability of rate changes, which traders are actively pricing in.
Oil prices, represented by Brent crude at $78.48 and WTI at $74.47, also play a role in the gold narrative, primarily through their impact on inflation expectations. Higher oil prices can fuel inflation concerns, which historically makes gold an attractive hedge. The recent surge in oil prices, particularly Brent's jump of 3.7%, driven by geopolitical factors such as the 'Iran ceasefire declared over' news, adds an inflationary element to the market. This could provide a baseline level of support for gold, acting as a counterweight to dollar strength and Fed policy concerns. However, the correlation isn't always direct; if oil prices rise due to supply constraints rather than demand, it can also signal broader economic weakness, which might temper the safe-haven appeal of gold if it leads to a severe risk-off sentiment impacting all asset classes.
Geopolitical Tensions and Safe-Haven Demand
The geopolitical landscape continues to be a significant, albeit often unpredictable, driver for gold prices. The recent news regarding Iran, specifically President Trump declaring an 'interim ceasefire over' and reports of escalating tensions, injects an element of uncertainty into global markets. Such developments typically increase demand for safe-haven assets, and gold is at the forefront of this demand. Even as other factors might push gold lower, these geopolitical risks can provide a floor, preventing sharp declines and potentially fueling sharp rallies if tensions escalate significantly. The market's reaction to these headlines is often swift and can override other technical or fundamental signals in the short term.
This underlying demand for gold as a safe haven is a structural feature of the market, particularly relevant in times of heightened global uncertainty. While the specifics of geopolitical events can be volatile, the general principle remains: when geopolitical risks rise, investors tend to seek refuge in assets perceived as having intrinsic value and stability, with gold being a prime example. This dynamic explains why gold might hold its ground or even rally despite a strengthening dollar or hawkish central bank rhetoric, as the safe-haven bid provides a counterbalance. The ongoing conflict in Eastern Europe and broader US-China relations also contribute to this persistent background demand, making gold a crucial barometer of global stability.
The Trade Plan: Navigating the Neutral Zone
Bearish Scenario: Testing the Lower Support Levels
The bearish outlook for XAUUSD gains traction if key support levels fail to hold. The immediate trigger for this scenario would be a decisive close below the $4,068.01 support level on the 1-hour chart. Invalidation of this bearish thesis would occur if the price decisively breaks above the $4,095.74 resistance. Should the bearish scenario play out, the first target would be the $4,051.85 support level. A more significant move downwards could then target the $4,040.28 level. This scenario is supported by the prevailing 'SELL' signals on the 1-hour and 4-hour charts, as well as the bearish lean in the daily RSI. The probability for this scenario is estimated at 65%, reflecting the current technical pressures and the influence of a strong DXY.
Bearish Scenario: Downside Pressure Mounts
65% ProbabilityNeutral Scenario: Consolidation and Indecision
A neutral scenario envisions gold continuing to trade within its current range, characterized by indecision and volatility. The trigger for this scenario would be the price consolidating between the immediate support at $4,068.01 and resistance at $4,095.74, with neither level giving way decisively. Invalidation would occur if either the bullish or bearish scenario's trigger levels are breached. The targets in this scenario are less about price levels and more about observing the price action within the range. Target 1 might be the midpoint of the range, around $4,081.875, and Target 2 could be the upper or lower boundary of this consolidation zone, depending on which it approaches first. This scenario is plausible given the mixed signals on the daily chart and the general uncertainty surrounding upcoming economic data. We assign a 25% probability to this outcome, acknowledging the market's tendency to consolidate before major news events.
Neutral Scenario: Range-Bound Trading Continues
25% ProbabilityBullish Scenario: Reclaiming Higher Ground
For gold to rally, a decisive break above immediate resistance is necessary. The trigger for a bullish scenario would be a clear breach and sustained hold above the $4,095.74 resistance level on the 1-hour chart. Invalidation of this bullish thesis would occur if the price falls back below the $4,068.01 support. If the bullish momentum takes hold, the first target would be the $4,107.31 resistance level, followed by a more significant test of $4,123.47. This scenario is less probable in the immediate short term given the current technical indicators, but it could be fueled by dovish surprises from the Fed minutes or a significant escalation in geopolitical tensions. We assign a 10% probability to this upside scenario, reflecting the current headwinds.
Bullish Scenario: Breaking Through Resistance
10% ProbabilityThe Week Ahead: Fed Minutes and Inflationary Whispers
Looking ahead, the economic calendar is dominated by the release of the Federal Reserve's FOMC minutes. This document will be scrutinized for any shifts in the central bank's stance on inflation and interest rates. Any indication of continued hawkishness could strengthen the dollar and pressure gold, while signs of a pivot towards easing could ignite a rally. The market's interpretation of these minutes will be crucial. Given that the DXY is showing strong daily trend characteristics (ADX 36.35), dollar strength remains a significant factor that gold traders must monitor closely. A higher DXY at 100.98 currently suggests headwinds for XAUUSD.
Simultaneously, ongoing geopolitical developments, particularly concerning the Middle East, continue to provide a baseline level of support for gold as a safe-haven asset. The price of Brent crude at $78.48 and WTI at $74.47 reflects heightened energy market sensitivity to these events, which can indirectly support gold through inflation expectations. While technical indicators present a mixed picture, with short-term charts leaning bearish and longer-term charts showing some conflicting signals, the overarching theme is one of caution. The ADX on the daily chart at 37.89 indicates a strong trend, but its direction is not clearly defined by other indicators, suggesting potential for significant moves in either direction depending on the catalysts that emerge.
The current price of XAUUSD at $4,077.41 places it precariously close to critical support levels. Traders are faced with a scenario where a breakdown could lead to further declines, potentially testing the $4,037.77 mark, while a sustained hold above $4,068.01 could pave the way for a recovery. The interplay between Fed policy expectations, dollar strength, and geopolitical risks will be the key determinants of gold's path in the immediate future. Patience and disciplined risk management will be essential for navigating this period of uncertainty. As always, waiting for clear confirmation of a directional bias, rather than anticipating moves, is the prudent strategy in such a market environment.
Frequently Asked Questions: XAUUSD Analysis
What happens if XAUUSD breaks below the $4,068.01 support level?
A decisive break below $4,068.01 on the 1-hour chart would invalidate the immediate bullish outlook and trigger a bearish scenario. This could lead to further downside, with the next key support levels being $4,051.85 and potentially $4,040.28, as indicated by the 1-hour and 4-hour technical analysis.
Should I buy XAUUSD at current levels around $4,077.41 given the neutral trend and mixed signals?
Buying at current levels requires caution. The neutral trend and mixed signals suggest consolidation or a potential move lower. A more prudent approach would be to wait for confirmation, such as a clear bounce from support near $4,068.01 or a decisive break above resistance at $4,095.74, with a probability of 65% favoring a bearish move in the short term.
Is the RSI at 46.11 on the 1-hour chart a sell signal for XAUUSD?
An RSI of 46.11 on the 1-hour chart is in the neutral zone but leans towards a bearish indication, suggesting that momentum is not strongly favoring buyers. While not an outright sell signal on its own, it aligns with the overall bearish sentiment seen on the 4-hour chart and contributes to the cautious outlook for gold.
How will the upcoming Fed minutes affect XAUUSD this week, given the DXY at 100.98?
The Fed minutes are critical. Hawkish signals could strengthen the DXY (currently at 100.98), putting downward pressure on XAUUSD. Conversely, dovish signals might weaken the dollar and support gold. The market's interpretation of the minutes, especially regarding inflation and future rate policy, will heavily influence short-term price action.
Track markets in real-time
AI-powered analysis, technical indicators and real-time price data.
Join Our Telegram Channel
Breaking market news, AI analysis and trading signals instantly.
Join Channel