

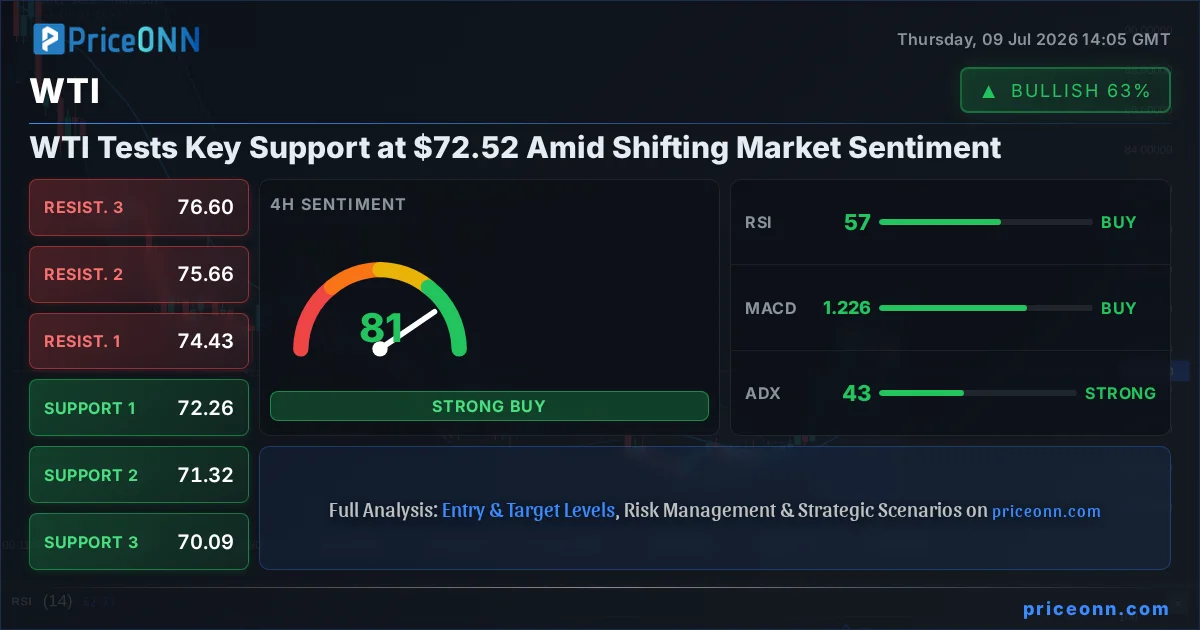
The global energy landscape is in constant flux, and the recent movements in West Texas Intermediate (WTI) crude oil prices underscore this volatility. Currently trading around the $72.77 mark, WTI is navigating a critical juncture as it tests a significant support level at $72.52. This price point is not merely a number on a chart; it represents a crucial battleground where the forces of supply, demand, geopolitical tensions, and macroeconomic sentiment collide. Understanding the interplay of these factors is paramount for any trader or investor looking to navigate the complexities of the oil market. The current technical setup, combined with broader market correlations and evolving geopolitical risks, paints a nuanced picture that demands careful analysis.
- WTI crude oil is currently testing support at $72.52, with the price hovering around $72.77.
- The ADX at 19.95 indicates a weak trend on the 1H chart, suggesting potential for a breakout or reversal.
- Conflicting signals from RSI (42.58, bearish) and Stochastic (K=49.63, rising) highlight market indecision.
- Geopolitical tensions in the Middle East and shifts in the US Dollar Index (DXY) are key external drivers influencing WTI prices.
Navigating the Crosscurrents: Macro and Geopolitical Influences on WTI
The price of WTI crude oil is seldom dictated by domestic supply and demand alone. In today's interconnected financial world, global macroeconomic trends and geopolitical developments play an outsized role. The US Dollar Index (DXY), currently trading around 100.88 and showing a bearish sentiment on the 1-hour chart despite a strong 1-day trend, acts as a significant barometer. When the dollar strengthens, commodities like oil, which are typically priced in dollars, tend to become more expensive for holders of other currencies, potentially dampening demand and pressuring prices. Conversely, a weaker dollar can make oil more affordable globally, often providing a tailwind for price increases. The current DXY data presents a mixed picture, with short-term weakness but a strong longer-term trend, creating an uncertain environment for oil.
Furthermore, the broader risk sentiment across financial markets, as indicated by the performance of indices like the S&P 500 (currently at 6572.87, showing a strong upward trend on 1H and 4H but a bearish 1D trend) and Nasdaq 100 (at 29695.03, generally bullish), influences oil prices. A 'risk-off' environment, characterized by declining equity markets and increased demand for safe-haven assets, can lead to reduced demand for riskier assets like oil, pushing prices down. Conversely, a 'risk-on' mood, with rising stock markets, often correlates with increased economic activity and higher oil consumption. The mixed signals from these major indices suggest a cautious approach from market participants, which can translate into volatility for crude oil.
Geopolitical instability, particularly in energy-producing regions, remains a persistent factor. Recent news highlights that Middle East tensions continue to weigh on gold, which can often be a precursor or parallel indicator for oil market reactions. While specific details on WTI's direct exposure to current events are not provided, any escalation of conflicts or disruptions to supply routes in major oil-producing nations can trigger sharp price increases due to fears of supply shortages. Traders are closely monitoring these developments, as they can quickly override fundamental supply/demand calculations. The delicate balance between OPEC+ production policies, global inventory levels, and unexpected geopolitical events creates a dynamic backdrop against which WTI's price action must be viewed.
Technical Crossroads: Interpreting WTI's Chart Patterns
On the 1-hour chart, WTI exhibits a neutral trend with a power score of 50%. The RSI(14) is at 42.58, indicating a bearish sentiment and suggesting that selling pressure might be dominant in the short term. However, the Stochastic oscillator presents a conflicting signal, with %K at 49.63 and %D at 48.58, showing a potential for a rise as %K is slightly above %D. This divergence is a classic sign of market indecision. The ADX at 19.95 further supports the notion of a weak trend, implying that the current price action may not be indicative of a strong, sustained move in either direction. This environment is ripe for potential breakout opportunities if key levels are breached decisively.
The MACD indicator on the 1H chart shows negative momentum, with the MACD line below the signal line, reinforcing the bearish short-term outlook. The Bollinger Bands are positioned below the middle band, which also suggests a bearish bias in this timeframe. However, the overall signal summary for the 1H chart is a mix, leaning towards sell (Al: 2, Sat: 6, Nötr: 0), underscoring the lack of clear conviction. This choppy action around the $72.77 mark, with support identified at $72.52, $72.36, and $72.20, and resistance at $73.07, $73.30, and $73.57, means short-term traders must be extremely vigilant.
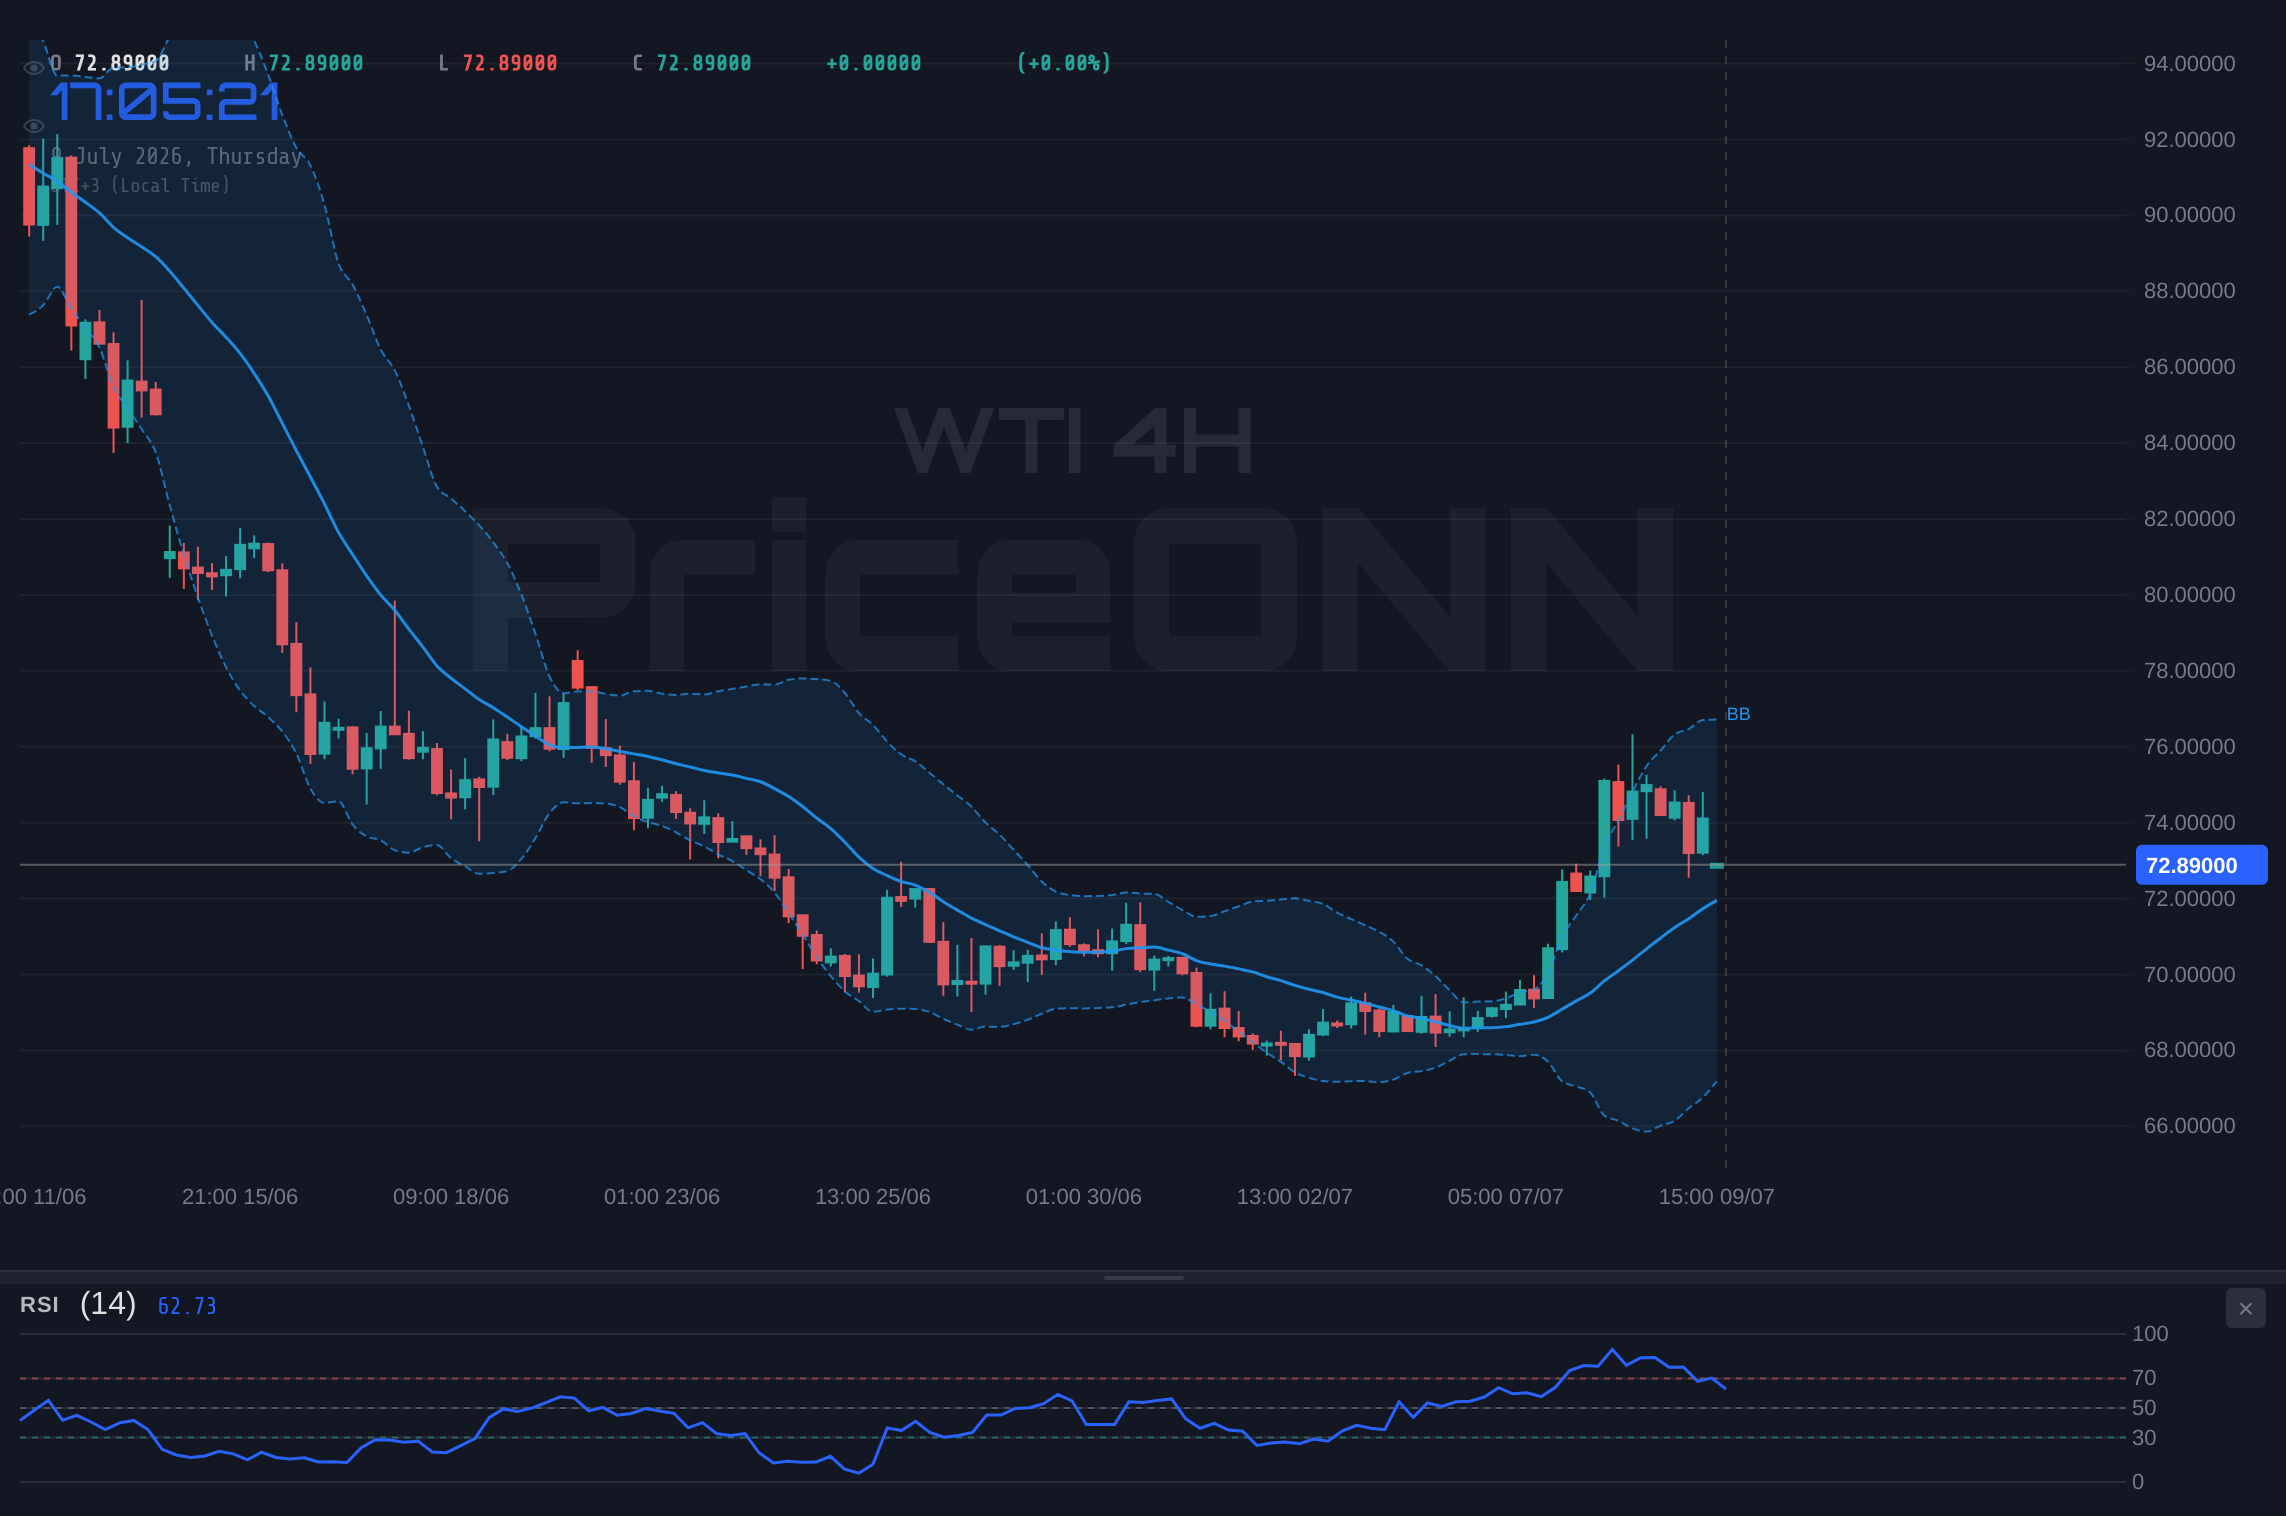
Shifting to the 4-hour timeframe, the trend is identified as bullish with a power score of 92%. This suggests a stronger underlying upward momentum, despite the short-term bearish signals. The RSI(14) is at 55.82, still within the neutral zone but leaning bullish, indicating room for further upside. The MACD shows positive momentum, with the MACD line above the signal line, a bullish sign. The Stochastic oscillator, however, presents a bearish signal with K at 38.5 and D at 68.11 (%K
The conflict between the 1H and 4H timeframes is a critical observation. The 1H chart's bearish signals, including the RSI at 42.58 and negative MACD momentum, suggest immediate downside pressure. Yet, the 4H chart's bullish trend, strong ADX of 43.22, and positive MACD momentum point towards a potential continuation of the broader upward move. This technical dichotomy means that the $72.52 support level is of paramount importance. A failure to hold this level on the 1H chart could trigger a cascade of selling, but if it holds firm and the 4H bullish trend reasserts itself, we could see a significant rebound. The general signal on the 4H is AL (Al: 5, Sat: 3, Nötr: 0), suggesting that the longer-term bullish bias is still in play.
The daily (1D) chart offers a longer-term perspective, showing a neutral trend with a power score of 50%. The RSI(14) is at 40.35, indicating a bearish inclination and suggesting that the market is not yet oversold but has room to fall further before reaching extreme levels. The MACD is positive, with the MACD line above the signal line, which is a bullish signal on this longer timeframe, contradicting the RSI. The Stochastic oscillator shows a strong bullish signal with K at 78.7 and D at 38.6 (%K > %D), indicating a potential upward move from current levels. However, the ADX at 35.55 signifies a strong downtrend, which appears to be in conflict with the Stochastic and MACD signals. This conflicting data across different timeframes underscores the current uncertainty and the critical nature of the $72.52 support level.
The $72.52 Level: A Critical Juncture for WTI
The support level at $72.52 is more than just a technical marker; it represents a psychological and structural point that has likely been tested and respected in the past. For WTI to maintain its bullish potential, holding this level is crucial. A break below $72.52, especially on increased volume, could signal a deeper correction, potentially targeting the next support at $72.36 and even $72.20. Such a move would likely be exacerbated if coupled with a strengthening dollar or a significant drop in risk appetite across global markets. The current ADX of 35.55 on the daily chart, indicating a strong downtrend, means that a break of support could lead to a swift and significant price decline.
Conversely, if WTI finds footing around $72.52 and begins to rebound, the immediate resistance to watch is at $73.07. A decisive break above this level, ideally supported by increasing volume and positive momentum across multiple timeframes, would invalidate the short-term bearish signals and could pave the way for a move towards the next resistance at $73.30 and then $73.57. The confluence of a bullish Stochastic signal on the daily chart and the positive MACD momentum provides a basis for such a recovery scenario. However, the weak trend indicated by the 1H ADX (19.95) suggests that any upward move might lack strong conviction initially, requiring confirmation from higher timeframes.
The interplay between these immediate support and resistance levels, the conflicting indicator signals, and the broader macroeconomic backdrop creates a high-stakes environment. The overall signal summary for the daily chart is SAT (Al: 3, Sat: 4, Nötr: 0), indicating a slight bearish bias in the longer term, which aligns with the RSI and ADX readings but conflicts with the Stochastic and MACD. This complex technical picture necessitates a strategy that accounts for multiple possibilities. The immediate focus remains on whether the $72.52 support can hold, acting as a pivot for the next significant price move.
Trade Scenarios and Risk Management
Bearish Scenario: Breakdown Below $72.52
60% ProbabilityNeutral Scenario: Consolidation Around $72.77
25% ProbabilityBullish Scenario: Defense of $72.52 Support
15% ProbabilityRisk management is paramount in such a volatile environment. For a bearish scenario, traders might consider short positions upon a confirmed break of $72.52, with a stop-loss placed just above the invalidated level or the short-term resistance at $73.07. Targets would be set at $72.36 and potentially lower. For a bullish scenario, entry could be considered on a bounce from $72.52, particularly if accompanied by positive divergence on oscillators or a break above immediate resistance. A stop-loss below the support level, perhaps around $72.20, would be prudent. The neutral scenario suggests range-bound trading, looking for opportunities at the edges of the $72.52-$73.07 range, with tight stops.
The current ADX reading of 43.22 on the 4-hour chart indicates a strong trend, which, if bullish, means that pullbacks to support levels like $72.52 could be buying opportunities. However, the conflicting weak trend (ADX 19.95) on the 1-hour chart suggests caution. This means that while the 4-hour trend might be strong, the immediate price action is prone to choppy movements. Traders should pay close attention to volume confirmation on any break of these key levels. A low-volume move might be a false signal, whereas high-volume penetration of $72.52 or $73.07 would carry more weight.
The Broader Picture: Correlations and Future Outlook
The correlation between WTI and the DXY is a critical factor to monitor. With the DXY showing a bearish trend on the 1H chart (RSI 43.58) but a strong 1D uptrend (ADX 35.14), its influence on WTI is complex. If the dollar continues to weaken in the short term as suggested by the 1H indicators, it could provide some support for WTI, helping to defend the $72.52 level. However, the persistent strength of the dollar on the daily chart poses a risk to any sustained oil rally. Investors should watch for confirmation of dollar weakness or strength to gauge its impact on oil prices.
The performance of equity markets also provides context. The S&P 500's upward momentum on the 1H and 4H charts (RSI 70.95 and 62.83 respectively) suggests a generally positive risk sentiment, which typically supports oil prices. However, the bearish 1D trend for the S&P 500 (RSI 45.35) and the strong downtrend ADX (47.51) indicate that the longer-term outlook for equities might be turning negative. If equities were to experience a significant sell-off, it could spill over into the oil market, reinforcing bearish sentiment and potentially pushing WTI below $72.52. The Nasdaq 100 shows a similar pattern, with strong short-term bullish signals but a more cautious long-term view.
Looking ahead, the energy market will remain sensitive to geopolitical developments, particularly any news from the Middle East that could threaten supply. Additionally, OPEC+ production decisions and global inventory reports will continue to be closely watched. On the macroeconomic front, upcoming inflation data and central bank commentary, especially from the Federal Reserve, will shape the outlook for the dollar and overall market risk appetite. The current technical picture for WTI, with its conflicting signals across timeframes and the crucial test at $72.52, suggests a period of heightened volatility. Patience and disciplined risk management will be key for traders navigating these uncertain waters.
Frequently Asked Questions: WTI Analysis
What happens if WTI breaks below the $72.52 support level?
A break below $72.52 could trigger further selling, potentially targeting $72.36 and $72.20, especially if confirmed by high volume and negative momentum across multiple timeframes. This scenario is assigned a 60% probability.
Should I consider buying WTI at current levels around $72.77, given the RSI is at 42.58?
Buying at current levels carries risk due to the bearish RSI signal. A more prudent approach for a bullish trade would be to wait for confirmation of support holding at $72.52, with targets at $73.07 and $73.30. This bullish scenario has a 15% probability.
Is the ADX at 19.95 on the 1H chart a sell signal for WTI?
An ADX of 19.95 indicates a weak trend, not necessarily a sell signal itself. It suggests that the market lacks strong directional conviction, making it prone to consolidation or volatile swings rather than a clear trend. Confirmation from other indicators is needed.
How will the shifting DXY trend affect WTI prices this week?
The DXY's short-term bearish trend (1H chart) could offer some support to WTI, potentially helping it hold $72.52. However, the DXY's strong daily uptrend poses a risk, and any sustained dollar strength could pressure WTI prices lower.
Technical Outlook Summary
| Indicator | Value | Signal | Interpretation |
|---|---|---|---|
| RSI (14) | 42.58 | Bearish | Suggests selling pressure in short-term. |
| MACD Histogram | -0.78 | Bearish | Negative momentum indicates weakening price action. |
| Stochastic | K:49.63, D:48.58 | Neutral | %K slightly above %D, indecisive. |
| ADX | 19.95 | Weak Trend | Lack of strong directional conviction. |
| Bollinger Bands | Lower Band | Bearish | Price below middle band, bearish bias. |
Key Levels
Track markets in real-time
AI-powered analysis, technical indicators and real-time price data.
Join Our Telegram Channel
Breaking market news, AI analysis and trading signals instantly.
Join Channel