

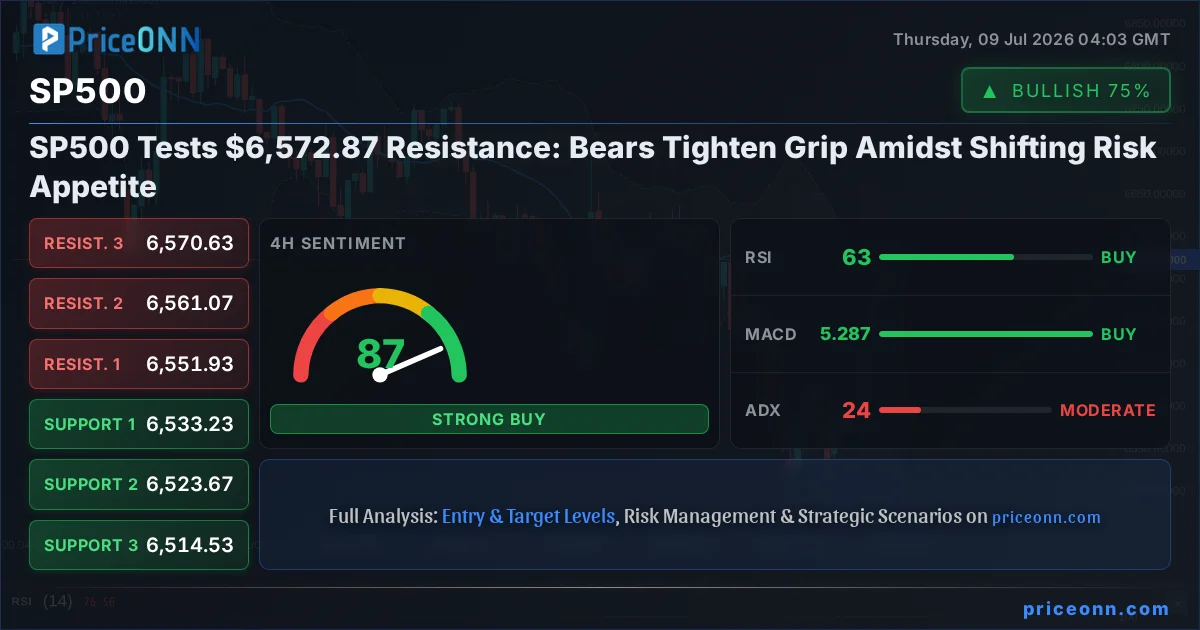
The S&P 500 index is currently facing a critical juncture, trading at $6,572.87 as it bumps against a key resistance level. After a period of robust upward momentum, the market sentiment appears to be shifting, with bears showing signs of regaining control. This subtle but significant change in market dynamics is not occurring in a vacuum; it's deeply intertwined with broader macroeconomic trends, fluctuating risk appetite, and geopolitical undercurrents that are painting a complex picture for investors right now.
- With RSI at 70.95 on the 1H chart, the S&P 500 signals overbought pressure, suggesting potential pullback.
- Critical resistance sits at $6,572.87, a level the index is currently testing and has faced headwinds from in the past.
- MACD histogram shows negative momentum on the 4H chart, indicating that bullish momentum may be fading.
- Fed rate expectations and geopolitical tensions are creating a complex correlation with DXY, influencing risk sentiment.
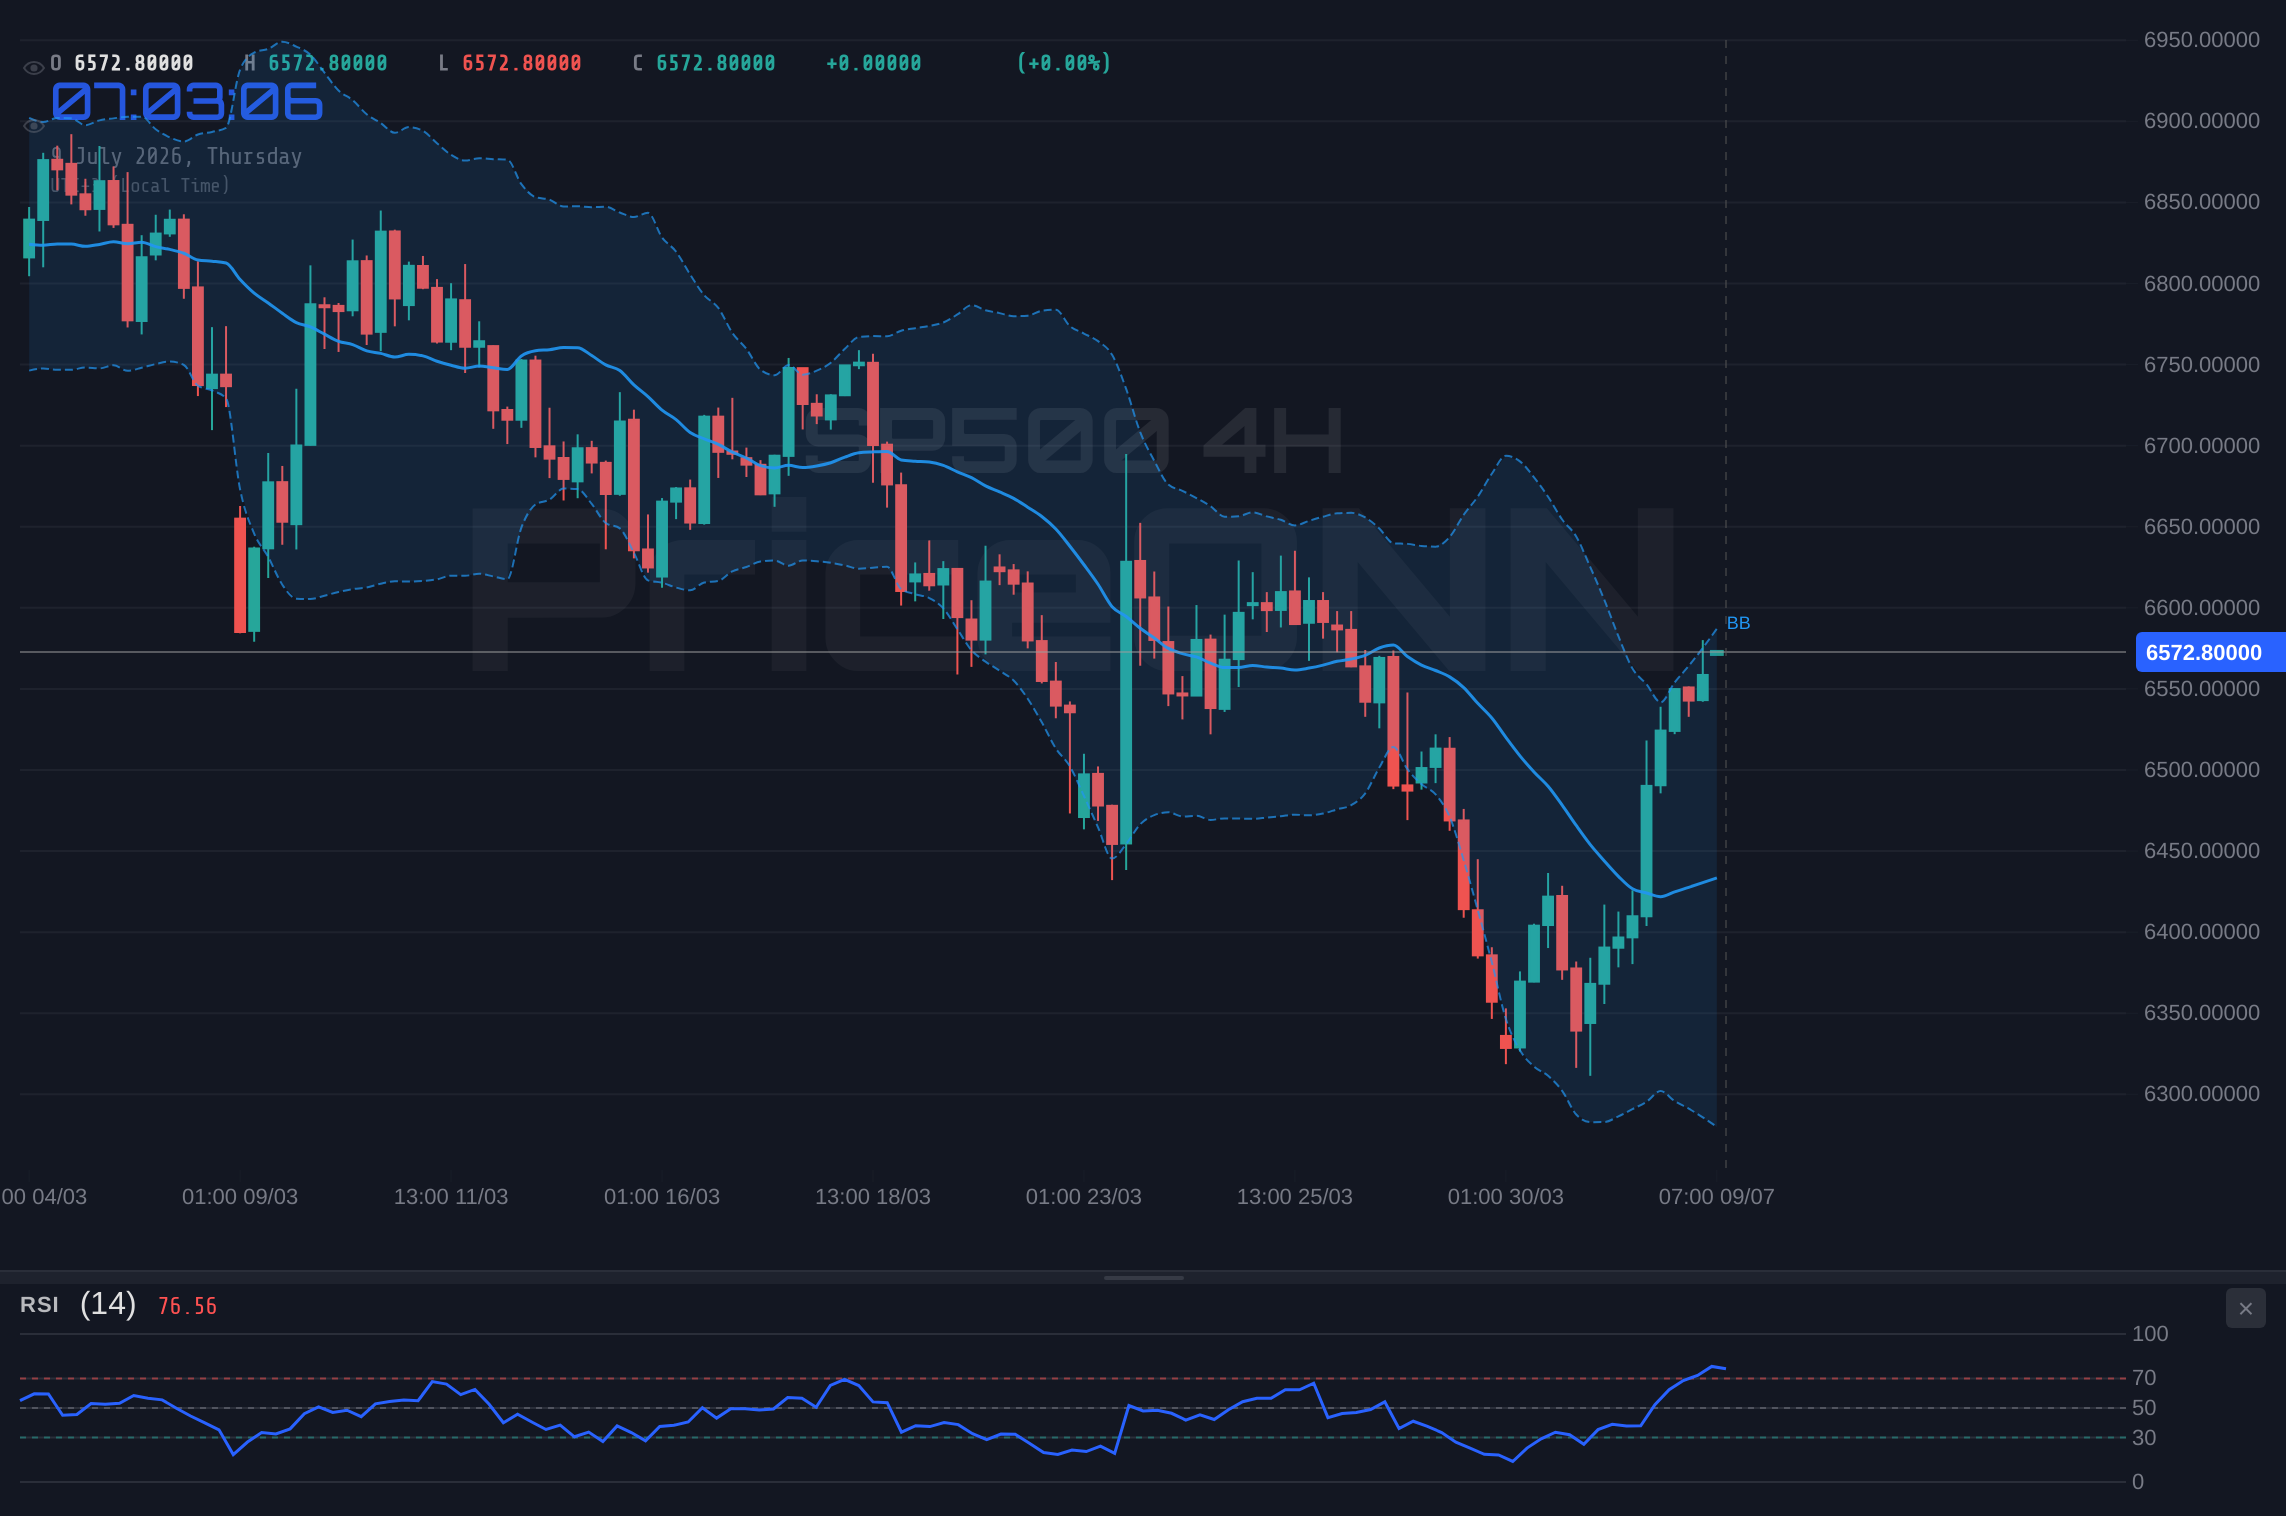
The technical indicators on the 1-hour timeframe present a cautionary tale for the bulls. The Relative Strength Index (RSI) is hovering around 70.95, a zone typically associated with overbought conditions. While this doesn't automatically signal a reversal, it does suggest that the recent upward surge might be losing steam and that a period of consolidation or a pullback could be on the horizon. Furthermore, the MACD histogram on the 4-hour chart has dipped into negative territory, hinting at a potential weakening of bullish momentum that has propelled the index higher. This divergence between the price action and the underlying momentum indicators warrants close observation.
Adding another layer to this complex market narrative is the performance of the US Dollar Index (DXY). Currently trading around 100.98, the DXY has shown a slight downtrend, which typically correlates with increased risk appetite and a weaker dollar, often benefiting equity markets. However, the relationship isn't always straightforward. Geopolitical events and shifting central bank expectations can complicate this dynamic. While the DXY's current trajectory might seem supportive of equities, the underlying causes for its movement – whether it's a tactical pause or a more significant shift in monetary policy expectations – are crucial for understanding the broader implications for the S&P 500.
The energy markets, particularly Brent crude oil, are also playing a significant role in shaping the inflationary outlook and, by extension, central bank policy. With Brent trading around $78.55, it has seen a slight pullback after a substantial surge. This volatility in oil prices acts as a barometer for inflation expectations. Higher oil prices tend to fuel inflation, potentially forcing central banks to maintain hawkish stances or even consider further tightening. Conversely, falling oil prices can ease inflationary pressures, creating room for more dovish monetary policy. The current price action in Brent suggests that while inflationary fears might be tempering slightly, the market remains sensitive to supply-side risks and geopolitical developments, as evidenced by the recent surge following the Iran ceasefire declaration being 'over'. This sensitivity to energy prices directly impacts the S&P 500 by influencing corporate costs and consumer spending power.
Navigating the Cross-Market Correlations
Understanding the interconnectedness of global markets is paramount for any serious trader. The S&P 500's current dance around the $6,572.87 resistance level is heavily influenced by its correlation with other major assets. For instance, the US Dollar Index (DXY) at 100.98 has been a key driver. A strengthening dollar often puts pressure on US equities as it makes American goods more expensive for foreign buyers and can signal tighter monetary policy. Conversely, a weakening dollar, as observed recently, can sometimes provide a tailwind for stocks, especially those with significant international exposure. However, the current situation is nuanced. The DXY's slight dip might be more about tactical positioning ahead of key economic data rather than a fundamental shift, and its correlation with risk assets like the S&P 500 can break down under specific circumstances, such as heightened geopolitical uncertainty.
The broader risk sentiment, as indicated by the performance of the Nasdaq 100 (currently at 29,297.64) and the Dow Jones Industrial Average (at 52,412.50), provides further context. While the S&P 500 is testing resistance, the Nasdaq 100 shows a mixed picture with a strong 1H uptrend signal but a bearish 4H and 1D outlook. The Dow Jones, on the other hand, displays a more bullish leaning on the daily chart despite some short-term headwinds. This divergence within the US equity indices suggests that while the overall market sentiment might be leaning towards caution, specific sectors or growth-oriented tech stocks (often represented by the Nasdaq) are facing different pressures than the broader market or more established industrial companies (Dow Jones). This internal market rotation is a critical aspect of S&P 500 analysis today, hinting that the index's next move could be influenced by which components are leading or lagging.
Precious metals, specifically gold (XAUUSD at $4,064.07) and silver (XAGUSD at $57.9), are often seen as havens during times of economic uncertainty or geopolitical turmoil. Gold's current downward trend, testing support at $4,058.57, presents an interesting counterpoint. Typically, a weakening dollar and rising inflation expectations would boost gold prices. However, the yellow metal is currently struggling, possibly due to a combination of factors including receding Fed rate hike bets being outweighed by reviving inflation fears, or perhaps a lack of strong conviction from safe-haven seekers. This complex behavior in gold, despite the S&P 500 facing resistance, suggests that investors might be adopting a more selective approach to risk, perhaps favoring certain equity sectors over traditional safe havens or waiting for clearer signals from central banks.
The forex market adds another layer of complexity. EUR/USD is trading around 1.14271, showing a slight upward bias on shorter timeframes but a bearish daily trend. This pair's movement is heavily influenced by the diverging monetary policy stances of the European Central Bank (ECB) and the US Federal Reserve. With the ECB having delivered a 25bp hike in June and the Fed's next move shrouded in uncertainty, traders are carefully assessing interest rate paths. This uncertainty is also reflected in GBP/USD (at 1.33959), which shows a bullish short-term trend but a neutral daily outlook. The interplay between these major currency pairs and the US dollar provides crucial clues about global liquidity conditions and investor sentiment, which directly feed into the S&P 500's trading environment.
The Shifting Sands of Risk Sentiment
Market sentiment is a fickle beast, and currently, it appears to be in a state of flux. The recent surge in oil prices, driven by geopolitical developments like the escalation in the Middle East, injects a dose of risk-off sentiment into the market. When oil prices spike significantly, as they did following the news about Iran, it typically raises inflation concerns and can prompt a reassessment of riskier assets. This is precisely why the S&P 500's current struggle at resistance is so telling. Investors are likely weighing the inflationary impact of higher energy costs against the potential for central bank tightening, which could stifle economic growth and corporate earnings.
The Federal Reserve's stance remains a pivotal factor. While recent data might show some cooling in inflation, the persistence of price pressures, potentially exacerbated by energy costs, keeps the Fed in a delicate balancing act. Traders are closely watching Fed rate expectations, and any indication of a more hawkish tone could quickly dampen risk appetite. The S&P 500's current position at resistance, coupled with the mixed signals from indicators like the RSI and MACD, suggests that the market is waiting for definitive guidance. The upcoming FOMC minutes will be crucial in deciphering the Fed's current thinking and will likely dictate the next significant move in equities.
The interplay between inflation, central bank policy, and geopolitical events creates a challenging environment for traders. On one hand, the strong performance of the Nasdaq 100 and Dow Jones suggests underlying resilience in certain market segments. On the other hand, the cautious approach in gold and the mixed signals across the forex majors indicate a broader hesitancy. This makes the S&P 500's current test of resistance at $6,572.87 a critical moment. A failure to break through could signal a broader market correction, while a decisive breakout might suggest that the bulls are still in charge, perhaps anticipating a less aggressive Fed or a swift resolution to geopolitical tensions.
From a trader's perspective, the current environment demands a high degree of discipline and risk management. The mixed signals across different asset classes and timeframes indicate a market that is searching for direction. While the short-term upward trend on the 1-hour chart for the S&P 500 might entice some, the longer-term indicators and the resistance at $6,572.87 suggest caution. It's a classic scenario where a breakout could lead to significant gains, but a failure to break could result in a sharp reversal. Therefore, focusing on clear entry and exit points, managing risk exposure, and waiting for confirmation are key strategies in this uncertain landscape.
Trade Scenarios and Actionable Insights
Bearish Scenario: Resistance Holds Firm
65% ProbabilityConsolidation Scenario: Sideways Action
25% ProbabilityBullish Scenario: Breakout Confirmation
10% ProbabilityThe current technical setup for the S&P 500, trading at $6,572.87, presents a classic resistance test scenario. The 1-hour chart shows an RSI nearing overbought territory at 70.95, suggesting that the recent upward momentum might be exhausted. This is further corroborated by the MACD histogram on the 4-hour chart displaying negative momentum, hinting at a potential pullback. The ADX reading of 24.23 on the 4-hour chart indicates a moderate trend strength, meaning the current move isn't a weak consolidation but has some directional conviction, which could amplify a move if the resistance at $6,572.87 holds.
Given these mixed signals and the critical resistance level at $6,572.87, the most probable outcome in the short term appears to be a consolidation or a slight pullback. The ADX at 16.33 on the 1-hour chart suggests a weak trend, reinforcing the idea that the market might be indecisive around this key level. However, traders should remain vigilant. A decisive breakout above $6,577.27, especially on increased volume, could signal a continuation of the bullish trend, targeting higher resistance levels. Conversely, a failure to hold above the immediate support at $6,547.63 could initiate a more significant downward move, potentially retesting lower support levels around $6,535.07 and $6,526.53. The current environment calls for patience and strict adherence to risk management protocols.
Frequently Asked Questions: SP500 Analysis
What happens if SP500 fails to break above the $6,572.87 resistance level?
If the S&P 500 fails to break above $6,572.87, a bearish scenario becomes more likely. We could see a pullback towards the 1-hour support at $6,547.63, potentially extending to $6,535.07. This would align with the RSI nearing overbought levels on the 1H chart.
Should I buy SP500 at current levels of $6,572.87 given the mixed signals?
Buying at $6,572.87 is not advisable due to the strong resistance and mixed technical indicators. A more prudent approach involves waiting for a confirmed breakout above $6,577.27 for bullish continuation or a clear break below $6,547.63 for bearish confirmation, with a 65% probability favoring the bearish scenario in the short term.
Is the RSI at 70.95 a sell signal for SP500 right now?
An RSI of 70.95 on the 1-hour chart suggests overbought conditions, indicating that the recent rally may be losing momentum. While not an immediate sell signal on its own, it warrants caution and suggests that further upside may be limited without a significant shift in market drivers.
How will the upcoming FOMC minutes affect SP500 around the $6,572.87 resistance level?
The upcoming FOMC minutes could be a major catalyst. If they signal a hawkish stance, it could increase pressure on the S&P 500 at $6,572.87, potentially triggering a sell-off. Conversely, a more dovish tone might provide the impetus for a breakout above resistance, especially if geopolitical risks subside.
| Indicator | Value | Signal | Interpretation |
|---|---|---|---|
| RSI (1H) | 70.95 | Bearish Pressure | Overbought territory, potential for pullback |
| MACD Histogram (4H) | -0.48 | Negative Momentum | Bullish momentum fading |
| Stochastic (1H) | 65.73 / 73.5 | Divergence | %K |
| ADX (4H) | 24.23 | Moderate Trend | Trend strength is present, but not overwhelming |
| Bollinger Bands (1H) | Upper Band | Watch | Price near upper band, potential stall |
Track markets in real-time
AI-powered analysis, technical indicators and real-time price data.
Join Our Telegram Channel
Breaking market news, AI analysis and trading signals instantly.
Join Channel