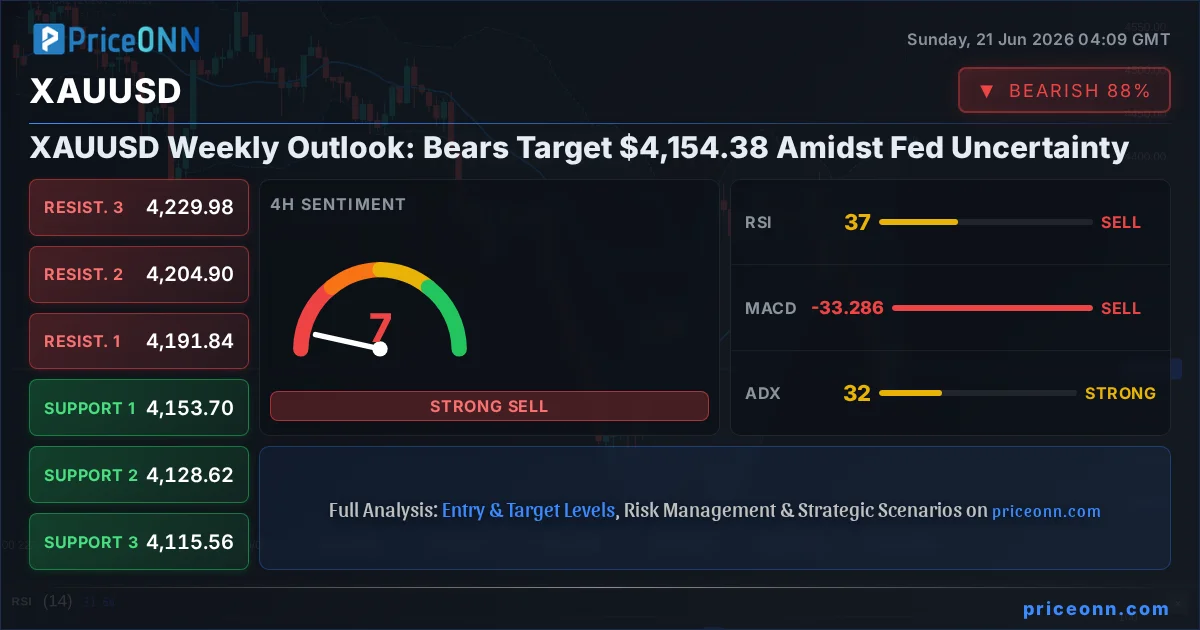
The battleground for gold traders this week is firmly set around the $4,154.38 mark, a level where the bulls and bears are locked in a fierce tug-of-war. Following a challenging week that saw prices retreat significantly, the sentiment surrounding XAUUSD is decidedly cautious, leaning towards bearish. However, the narrative is far from concluded, with a complex interplay of central bank policy expectations, geopolitical undercurrents, and evolving market sentiment creating a volatile landscape. This analysis delves into the intricate technical and fundamental factors shaping the outlook for gold, examining the key levels that will dictate its trajectory in the coming days and exploring potential trade scenarios for savvy investors. We will dissect the technical indicators, assess the correlation with the US Dollar Index (DXY) and broader equity markets, and consider the impact of recent economic data and geopolitical shifts that have kept gold prices on a tightrope walk.
- RSI at 35.6 signals bearish momentum, with the price holding below the daily middle Bollinger Band.
- Critical support for XAUUSD is identified at $4,118.59, tested multiple times this week.
- The ADX at 36.72 indicates a strong downtrend, suggesting further downside potential if key levels break.
- Fed rate hike expectations are currently driving a strong positive correlation with the DXY, pressuring gold prices.
The Bearish Case: $4,154.38 Under Pressure
Sustained Downtrend and Technical Weakness
The technical picture for XAUUSD paints a predominantly bearish narrative as we close out the trading week. The 1-day timeframe reveals a clear downtrend, with the price action consistently making lower highs and lower lows. The current price of $4,154.38 is significantly below the resistance levels that were tested earlier in the week, and crucially, it's also failing to hold above the key support at $4,163.76. This breakdown is a strong signal that selling pressure is accumulating, and the bears are firmly in control of the short to medium-term trend. The strength of this trend is underscored by the Average Directional Index (ADX) on the daily chart, which stands at a robust 36.72, indicating a firmly established bearish move. This is not a market characterized by indecision; it's a market with a clear directional bias to the downside, at least from a purely technical standpoint.
Further exacerbating the bearish sentiment is the state of the Relative Strength Index (RSI) on the daily chart, currently reading 35.6. While not yet in oversold territory (typically below 30), the RSI's position in the lower half of the neutral zone clearly indicates that momentum is favouring sellers. This is further supported by the MACD, which is printing negative momentum and remains below its signal line, reinforcing the bearish bias. The Bollinger Bands also offer a bearish confirmation, with the price consistently trading below the middle band, suggesting that the downward momentum is likely to continue. The 1-hour and 4-hour charts echo this sentiment, with most indicators flashing 'SELL' signals, indicating a consistent bearish outlook across multiple timeframes. The Stochastic Oscillator on the 1-day chart, with %K at 46.4 and %D at 46.63, is also showing a slight bearish cross, with %K dipping below %D, further validating the prevailing downtrend. The sheer number of 'SELL' signals across all examined timeframes (8 out of 8 on the daily, 7 out of 8 on the 4-hour) cannot be ignored by traders looking for directional conviction.

Correlation with DXY and Risk-Off Sentiment
The prevailing bearish sentiment in gold is significantly amplified by the strength observed in the US Dollar Index (DXY). As the DXY has shown resilience, even pushing into overbought territory on the daily chart with an RSI of 70.32, it typically exerts downward pressure on gold. This inverse correlation is a well-established market dynamic; a stronger dollar makes dollar-denominated assets like gold more expensive for holders of other currencies, thus reducing demand. The DXY's current reading of 100.82, despite a slight daily dip, reflects underlying dollar strength driven by renewed Federal Reserve hawkishness and a general risk-off sentiment pervading global markets. This is not just a forex play; it has direct implications for precious metals. The market appears to be repricing the Federal Reserve's monetary policy path, with expectations of fewer rate cuts - or even potential hikes - gaining traction. This shift in Fed expectations is a significant driver of dollar strength and, consequently, a headwind for gold.
Furthermore, the performance of major equity indices like the S&P 500 (SP500) and Nasdaq 100 (Nasdaq) reflects a cautious to bearish risk appetite. The SP500, currently trading at 6572.87 with a daily gain of 0.74%, still shows signs of weakness on longer timeframes, with its daily chart exhibiting a downtrend and an ADX of 47.51. The Nasdaq 100, despite a slight rebound, also shows bearish signals on its daily chart. This broader market hesitancy, where investors are moving away from riskier assets, often translates into a flight towards perceived safe-haven assets. However, in the current environment, the US dollar itself is acting as a primary safe haven, eclipsing gold's traditional role. This dynamic means that even as broader market sentiment turns risk-off, the benefit doesn't automatically flow to gold; instead, it often bolsters the dollar, creating a double whammy for precious metals. The recent news regarding potential US-Iran tensions, while usually a catalyst for gold, seems to be overshadowed by Fed policy concerns, highlighting the dominant influence of monetary policy over geopolitical events in the current market narrative.
Recent Price Action and Key Levels to Watch
Looking at the intraday price action, XAUUSD has been struggling. The 1-hour chart shows the price hovering precariously above the support level of $4,147.54, but with a clear bearish bias. The daily range has been established between $4,121.66 and $4,213.22, and the current price of $4,154.38 sits uncomfortably close to the lower end of this range. A decisive break below the $4,144.32 support on the 1-hour chart would signal further immediate downside, potentially targeting the next key support at $4,141.22. On the daily chart, the critical support level to watch is $4,118.59. A breach of this level would be a significant bearish development, opening the door to much lower prices, potentially towards the $4,035.66 mark. The failure to hold these levels suggests a lack of buying conviction and a willingness from market participants to liquidate positions on any rallies.
The resistance levels on the hourly chart are clustered around $4,153.86, $4,156.96, and $4,160.18. For the bears to maintain control, gold must remain below these immediate hurdles. Any sustained move above $4,160.18 on the 1-hour chart could signal a temporary reprieve, but the larger bearish trend on the daily chart would still need to be overcome. On the 4-hour chart, resistance is seen at $4,191.84, $4,204.9, and $4,229.98. A move back into this higher resistance zone would challenge the current bearish narrative, but given the overwhelming 'SELL' signals across timeframes, such a scenario appears less probable in the immediate short term without a significant shift in market fundamentals, such as a dovish surprise from the Fed or a major geopolitical escalation that clearly favors gold as a safe haven.
The Bullish Counter-Argument: Potential for a Rebound
Signs of Oversold Conditions and Divergence
Despite the prevailing bearish technicals, there are glimmers of hope for the bulls, primarily stemming from potential oversold conditions and the possibility of divergences emerging. While the daily RSI at 35.6 is not yet deeply oversold, the 4-hour RSI at 36.78 and the 1-hour RSI at 39.43 are approaching levels where a short-term bounce could occur. More importantly, the Stochastic Oscillator on the 4-hour chart is showing a bullish signal (%K at 22.1, %D at 10.25, with %K > %D), indicating a potential upward correction from current levels. This divergence between the bearish trend on the daily chart and the potential for a bounce on shorter timeframes is something traders often watch for potential turning points.
Furthermore, while the ADX readings across the board are high, suggesting strong trends, it's crucial to consider that these strong trends can eventually lead to exhaustion. A sustained period of trending price action, especially to the downside, can leave the market vulnerable to sharp reversals or 'bear traps' if underlying fundamentals shift. The fact that the 'General Signal' across all timeframes is overwhelmingly 'SAT' (Sell) might, in itself, be a contrarian indicator for some traders who believe that extreme readings often precede a reversal. While confirmation is key, the possibility of a 'bullish divergence' forming - where price makes new lows but an oscillator makes higher lows - cannot be entirely dismissed, although it is not yet evident. The current Stochastic reading on the 1-hour chart (%K=86.05, %D=81.7) is in overbought territory, indicating that EURUSD is potentially due for a correction, which could indirectly influence gold if it signals a broader dollar pullback.
Shifting Fundamentals and Geopolitical Triggers
While the Federal Reserve's hawkish stance is currently a dominant force, the market narrative is fluid. Any indication of a softening in Fed policy, perhaps a less aggressive tone in upcoming statements or a surprise shift in economic data that suggests inflation is cooling faster than expected, could rapidly alter the landscape. For instance, if upcoming inflation data (like PCE, which is eyed by markets) comes in significantly below expectations, it could reignite hopes for earlier rate cuts, weakening the dollar and providing a tailwind for gold. The recent economic news, while generally pointing towards dollar strength and potential rate hikes, also highlights resilience in consumer spending, which could eventually lead to a more balanced economic picture, reducing the need for extreme hawkishness from the Fed.
Geopolitical events remain a wildcard. While current market focus is on monetary policy, any unexpected escalation in global tensions, particularly in regions affecting oil supply or creating broad-based risk aversion, could see a swift return of safe-haven demand for gold. Reports from sources like Reuters and Bloomberg often highlight potential flashpoints, and a significant event could quickly override the current dollar-centric narrative. For example, while the recent news about India ordering strategic oil reserve expansion and the ongoing discussions around the Strait of Hormuz might seem secondary, a tangible disruption in oil supplies could rapidly increase inflation expectations, forcing central banks to reconsider their policy paths and potentially boosting gold's appeal. The market can pivot quickly, and gold's historical role as a geopolitical hedge remains a potent factor.
Levels to Watch for a Bullish Reversal
For a bullish scenario to gain traction, gold must first decisively break above the immediate resistance levels. On the 1-hour chart, clearing $4,156.96 and then $4,160.18 would be the first signs of life for the bulls. A more significant hurdle lies on the 4-hour chart, where the $4,191.84 resistance needs to be conquered. A sustained move above this level would challenge the prevailing downtrend and could signal the beginning of a short-term recovery. The daily chart presents a more formidable challenge, with resistance at $4,291.86, $4,374.79, and ultimately $4,419.96. Breaking through these levels would require a fundamental shift in market dynamics, such as a clear dovish pivot from the Fed or a major geopolitical crisis.
Crucially, for any bullish reversal to be sustainable, gold would need to reclaim and hold above the daily middle Bollinger Band, which is currently acting as resistance. The ability to hold above the $4,147.54 support on the 1-hour chart is the immediate test. If this level gives way, the bullish case becomes significantly weaker. However, if buyers step in strongly around $4,144.32 or even $4,121.66, and manage to push the price back towards the $4,160-$4,180 range, it could signal a bottoming process. The Stochastic Oscillator on the 4-hour chart showing a bullish signal, combined with the potential for RSI divergence on shorter timeframes, provides a basis for expecting at least a short-term bounce, though a full trend reversal would require much more evidence.
The Neutral Ground: Consolidation and Uncertainty
Navigating the Conflicting Signals
The market for XAUUSD is currently exhibiting a classic case of conflicting signals across different timeframes and indicators, suggesting a period of consolidation or heightened volatility is possible before the next major directional move. While the daily trend is undeniably bearish (ADX 36.72, RSI 35.6), the shorter-term charts present a more mixed picture. The 1-hour chart shows a 'BUY' signal (5 buys, 3 sells), with the Stochastic Oscillator in overbought territory (86.05/81.7), hinting at a potential short-term pullback or consolidation. Conversely, the 4-hour chart leans heavily 'SELL' (7 sells, 1 buy), with its own Stochastic showing a bullish crossover, creating a divergence even within the shorter timeframes.
This technical discordance mirrors the fundamental uncertainty. The Federal Reserve's policy path remains the dominant narrative, yet market participants are grappling with conflicting data points. Inflation appears persistent, justifying a hawkish stance, but signs of economic cooling could eventually force a policy rethink. This ambiguity creates a vacuum where neither bulls nor bears can gain a decisive upper hand, leading to choppy price action and range-bound trading. Traders are likely to remain on the sidelines, waiting for clearer directional cues from economic data releases or central bank commentary. The current price of $4,154.38 is caught in this crossfire, unable to decisively break higher or lower without a catalyst.
The Importance of Key Levels in a Choppy Market
In such a consolidating or uncertain environment, key support and resistance levels become paramount. The immediate support at $4,147.54 and $4,144.32 on the 1-hour chart, and the more significant daily support at $4,118.59, are critical for the bears. A failure to hold these levels would confirm the bearish trend. Conversely, for the bulls to regain footing, they must overcome the immediate hourly resistances at $4,156.96 and $4,160.18, and more importantly, challenge the 4-hour resistance zone starting at $4,191.84. The price of $4,154.38 itself acts as a psychological pivot point – a level that, if breached decisively in either direction, could trigger a more significant move.
The range between the immediate hourly resistance ($4,160.18) and the immediate hourly support ($4,147.54) represents a zone of indecision. Trading within this narrow band suggests a lack of conviction. Scalpers might find opportunities on either side of this range, but swing traders and longer-term investors would be wise to wait for a clear breakout. The ADX readings, while indicating strong trends on the daily (36.72) and 1-hour (35.02) charts, are somewhat contradictory on the 4-hour (32.07) and exhibit weakness on the 1-hour (10.01 for USDJPY, which is correlated). This suggests that while a trend might be present, its conviction can vary significantly depending on the timeframe, further supporting the idea of a potential consolidation phase or a period where trends are not yet fully established across all durations.
Trade Scenarios and Probabilities
Bearish Scenario: The Downward Grind
65% ProbabilityNeutral Scenario: Range-Bound Volatility
25% ProbabilityBullish Scenario: The Rebound Attempt
10% ProbabilityNavigating the Week Ahead: Key Events and Levels
Economic Calendar Watchlist
The upcoming week will be crucial for XAUUSD, heavily influenced by key economic data releases and central bank commentary. While specific dates for next week's major events were not provided in the market data, traders will be keenly watching for any new inflation figures (CPI, PCE), employment reports (NFP, unemployment rate), and GDP growth updates. The market's reaction to these will significantly shape expectations for the Federal Reserve's next move. Any data that suggests persistent inflation could reinforce the Fed's hawkish stance, further pressuring gold. Conversely, signs of a significant economic slowdown might prompt a reassessment of monetary policy, potentially offering relief to precious metals.
The correlation with the DXY will remain a primary focus. If the dollar continues its upward trajectory, driven by hawkish Fed rhetoric or a 'risk-off' sentiment, gold will likely struggle. Any news that weakens the dollar, such as dovish Fed comments or a shift in global risk appetite favoring other safe havens, could provide an opportunity for gold prices to rebound. Geopolitical developments also remain a background risk; any unexpected escalation in tensions, particularly concerning major oil-producing regions or global trade relations, could quickly shift market focus back to gold's traditional role as a safe-haven asset, potentially overriding monetary policy concerns.
Levels to Monitor Closely
For the bearish outlook to remain intact, XAUUSD must stay below the immediate resistance at $4,156.96 and $4,160.18 on the 1-hour timeframe. A sustained break above these levels, particularly closing decisively above $4,160.18, would be the first indication of a potential bullish shift. However, the more significant test lies in breaking the 4-hour resistance zone starting at $4,191.84. Failure to overcome these levels will keep the downside targets in play. The critical daily support level remains at $4,118.59. A breach below this mark would be a strong bearish signal, opening the path towards $4,035.66.
Conversely, for a bullish reversal, gold needs to not only break immediate resistances but also establish a firm foothold above the $4,191.84 level on the 4-hour chart. The ultimate test for the bulls would be reclaiming the daily resistance at $4,291.86. Until then, the path of least resistance appears to be downwards, with the $4,118.59 support being a key level to watch for potential capitulation or a bounce. The $4,154.38 price point itself serves as a crucial psychological level; its decisive movement in either direction will likely dictate the short-term trend.
The current market environment for XAUUSD is heavily dominated by Federal Reserve policy expectations. Until there is a clear shift in these expectations, driven by concrete economic data or explicit central bank communication, the dollar's strength is likely to remain a significant headwind for gold prices. Traders should prioritize monitoring inflation and employment data releases for clues on the Fed's next move.
Frequently Asked Questions: XAUUSD Analysis
What happens if XAUUSD breaks below the $4,118.59 support level this week?
A break below $4,118.59 on the daily chart would invalidate the current consolidation pattern and confirm the prevailing bearish trend. This could trigger a sharp sell-off, with the next significant support level to watch being $4,035.66. Such a move would likely be accompanied by continued dollar strength and potentially weaker equity markets.
Is the current RSI reading of 35.6 a buy signal for XAUUSD at $4,154.38?
No, an RSI of 35.6 is not a direct buy signal; it indicates bearish momentum but is not yet in oversold territory (typically below 30). While it suggests that gold is moving towards oversold conditions, further confirmation, such as bullish divergence or a clear break of resistance, is needed before considering a buy. A bounce could occur, but a sustained trend reversal is unlikely based on RSI alone.
How is the DXY's current price of 100.82 impacting XAUUSD's outlook?
The DXY at 100.82 indicates a strong US dollar, which typically exerts downward pressure on gold prices due to their inverse correlation. This strength, driven by Fed policy expectations, is a major headwind for XAUUSD, making it more expensive for holders of other currencies. Continued dollar strength will likely keep gold prices suppressed unless other factors, like geopolitical risk, significantly boost safe-haven demand.
How might upcoming economic data affect XAUUSD around the $4,154.38 level?
Upcoming economic data, particularly inflation and employment figures, will be critical in shaping Fed policy expectations. Stronger-than-expected data could reinforce hawkish Fed sentiment, pushing the DXY higher and XAUUSD lower. Conversely, weaker data could lead to a dovish reassessment, weakening the dollar and potentially supporting gold prices above $4,154.38. Market participants will be scrutinizing these releases for directional cues.
Track markets in real-time
AI-powered analysis, technical indicators and real-time price data.
Join Our Telegram Channel
Breaking market news, AI analysis and trading signals instantly.
Join Channel