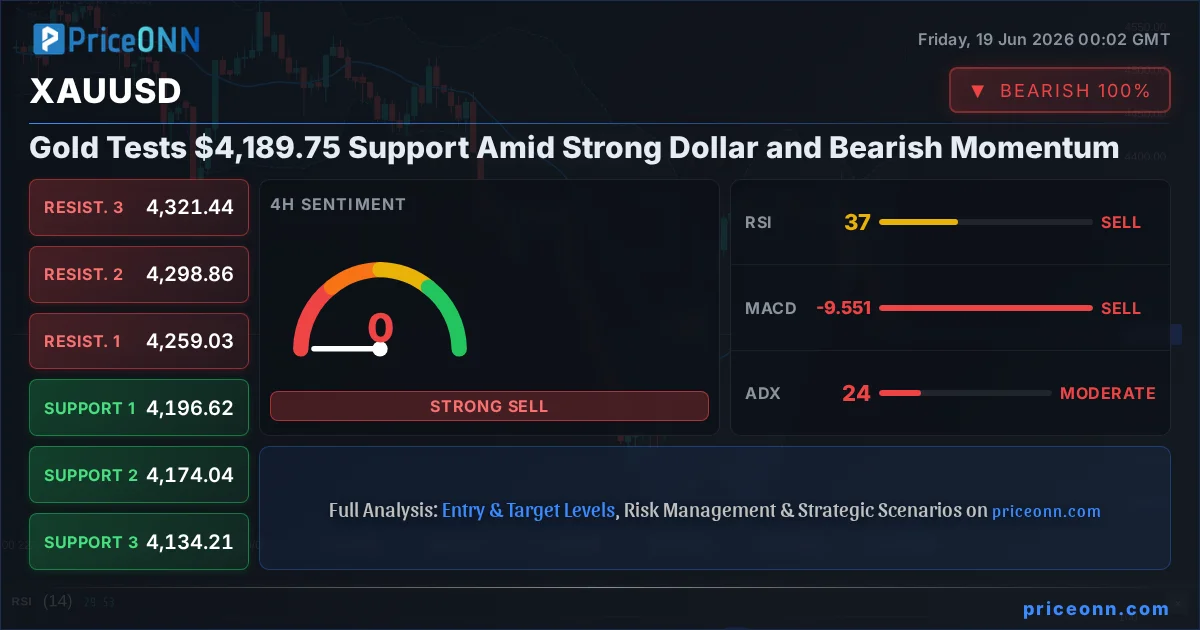
Gold, or XAUUSD, is currently grappling with significant downside pressure, trading at $4,189.75. This level represents a crucial test for the precious metal, as a potent combination of a strengthening US Dollar Index (DXY) and deeply oversold technical indicators paints a complex picture for traders. The recent sharp decline, marked by a 1.59% drop or $67.82 in a single day, underscores the bearish sentiment currently dominating the yellow metal. While the immediate outlook appears challenging, the extreme oversold conditions on shorter timeframes present a potential inflection point. Understanding the interplay between these factors is paramount for navigating the volatility ahead.
- The current price for XAUUSD is $4,189.75, with a daily change of -1.59%.
- The Dollar Index (DXY) is trading at 100.9, showing a strong upward trend that typically pressures gold prices.
- On the 1-hour chart, RSI is at 27.25, indicating extreme oversold conditions, while ADX at 32.47 points to a strong downtrend.
- Key support is identified at $4,190.18 on the daily chart, with resistance looming at $4,353.57.
- The prevailing technical signals across multiple timeframes lean heavily towards a 'SELL' recommendation.
The narrative surrounding gold has taken a decidedly bearish turn, driven by a confluence of factors that are testing the resolve of even the most optimistic bulls. The Dollar Index (DXY) has seen a notable surge, currently trading at 100.9, a move that historically correlates with increased pressure on dollar-denominated assets like gold. This strengthening dollar makes gold more expensive for holders of other currencies, thereby dampening demand. Furthermore, the prevailing risk sentiment, as indicated by the performance of indices like the SP500 which is showing a 0.74% daily gain, suggests that while equities are finding some footing, the broader safe-haven appeal of gold is currently overshadowed by dollar strength and possibly by the prospect of inflation cooling, though oil prices remain elevated.
Delving into the technical indicators, the picture on the 1-hour timeframe for XAUUSD is unequivocally bearish. The trend strength is a formidable 100% in the downtrend, supported by an RSI(14) reading of 27.25. This RSI value plunges deep into oversold territory, a condition that, while signaling potential exhaustion for sellers, also confirms the ferocity of the recent sell-off. The MACD indicator further corroborates this bearish sentiment, showing negative momentum with the MACD line firmly below its signal line. Bollinger Bands are also trading below the middle band, reinforcing the downward trajectory. The Stochastic oscillator, with %K at 7.27 and %D at 12.59, also resides in oversold territory, suggesting a short-term pause or minor bounce might be on the cards, but not yet a reversal. The ADX, a measure of trend strength, stands at 32.47, confirming a robust downtrend is in play. The aggregated signal across this timeframe is a strong 'SELL', with 6 sell signals against only 2 buy signals.
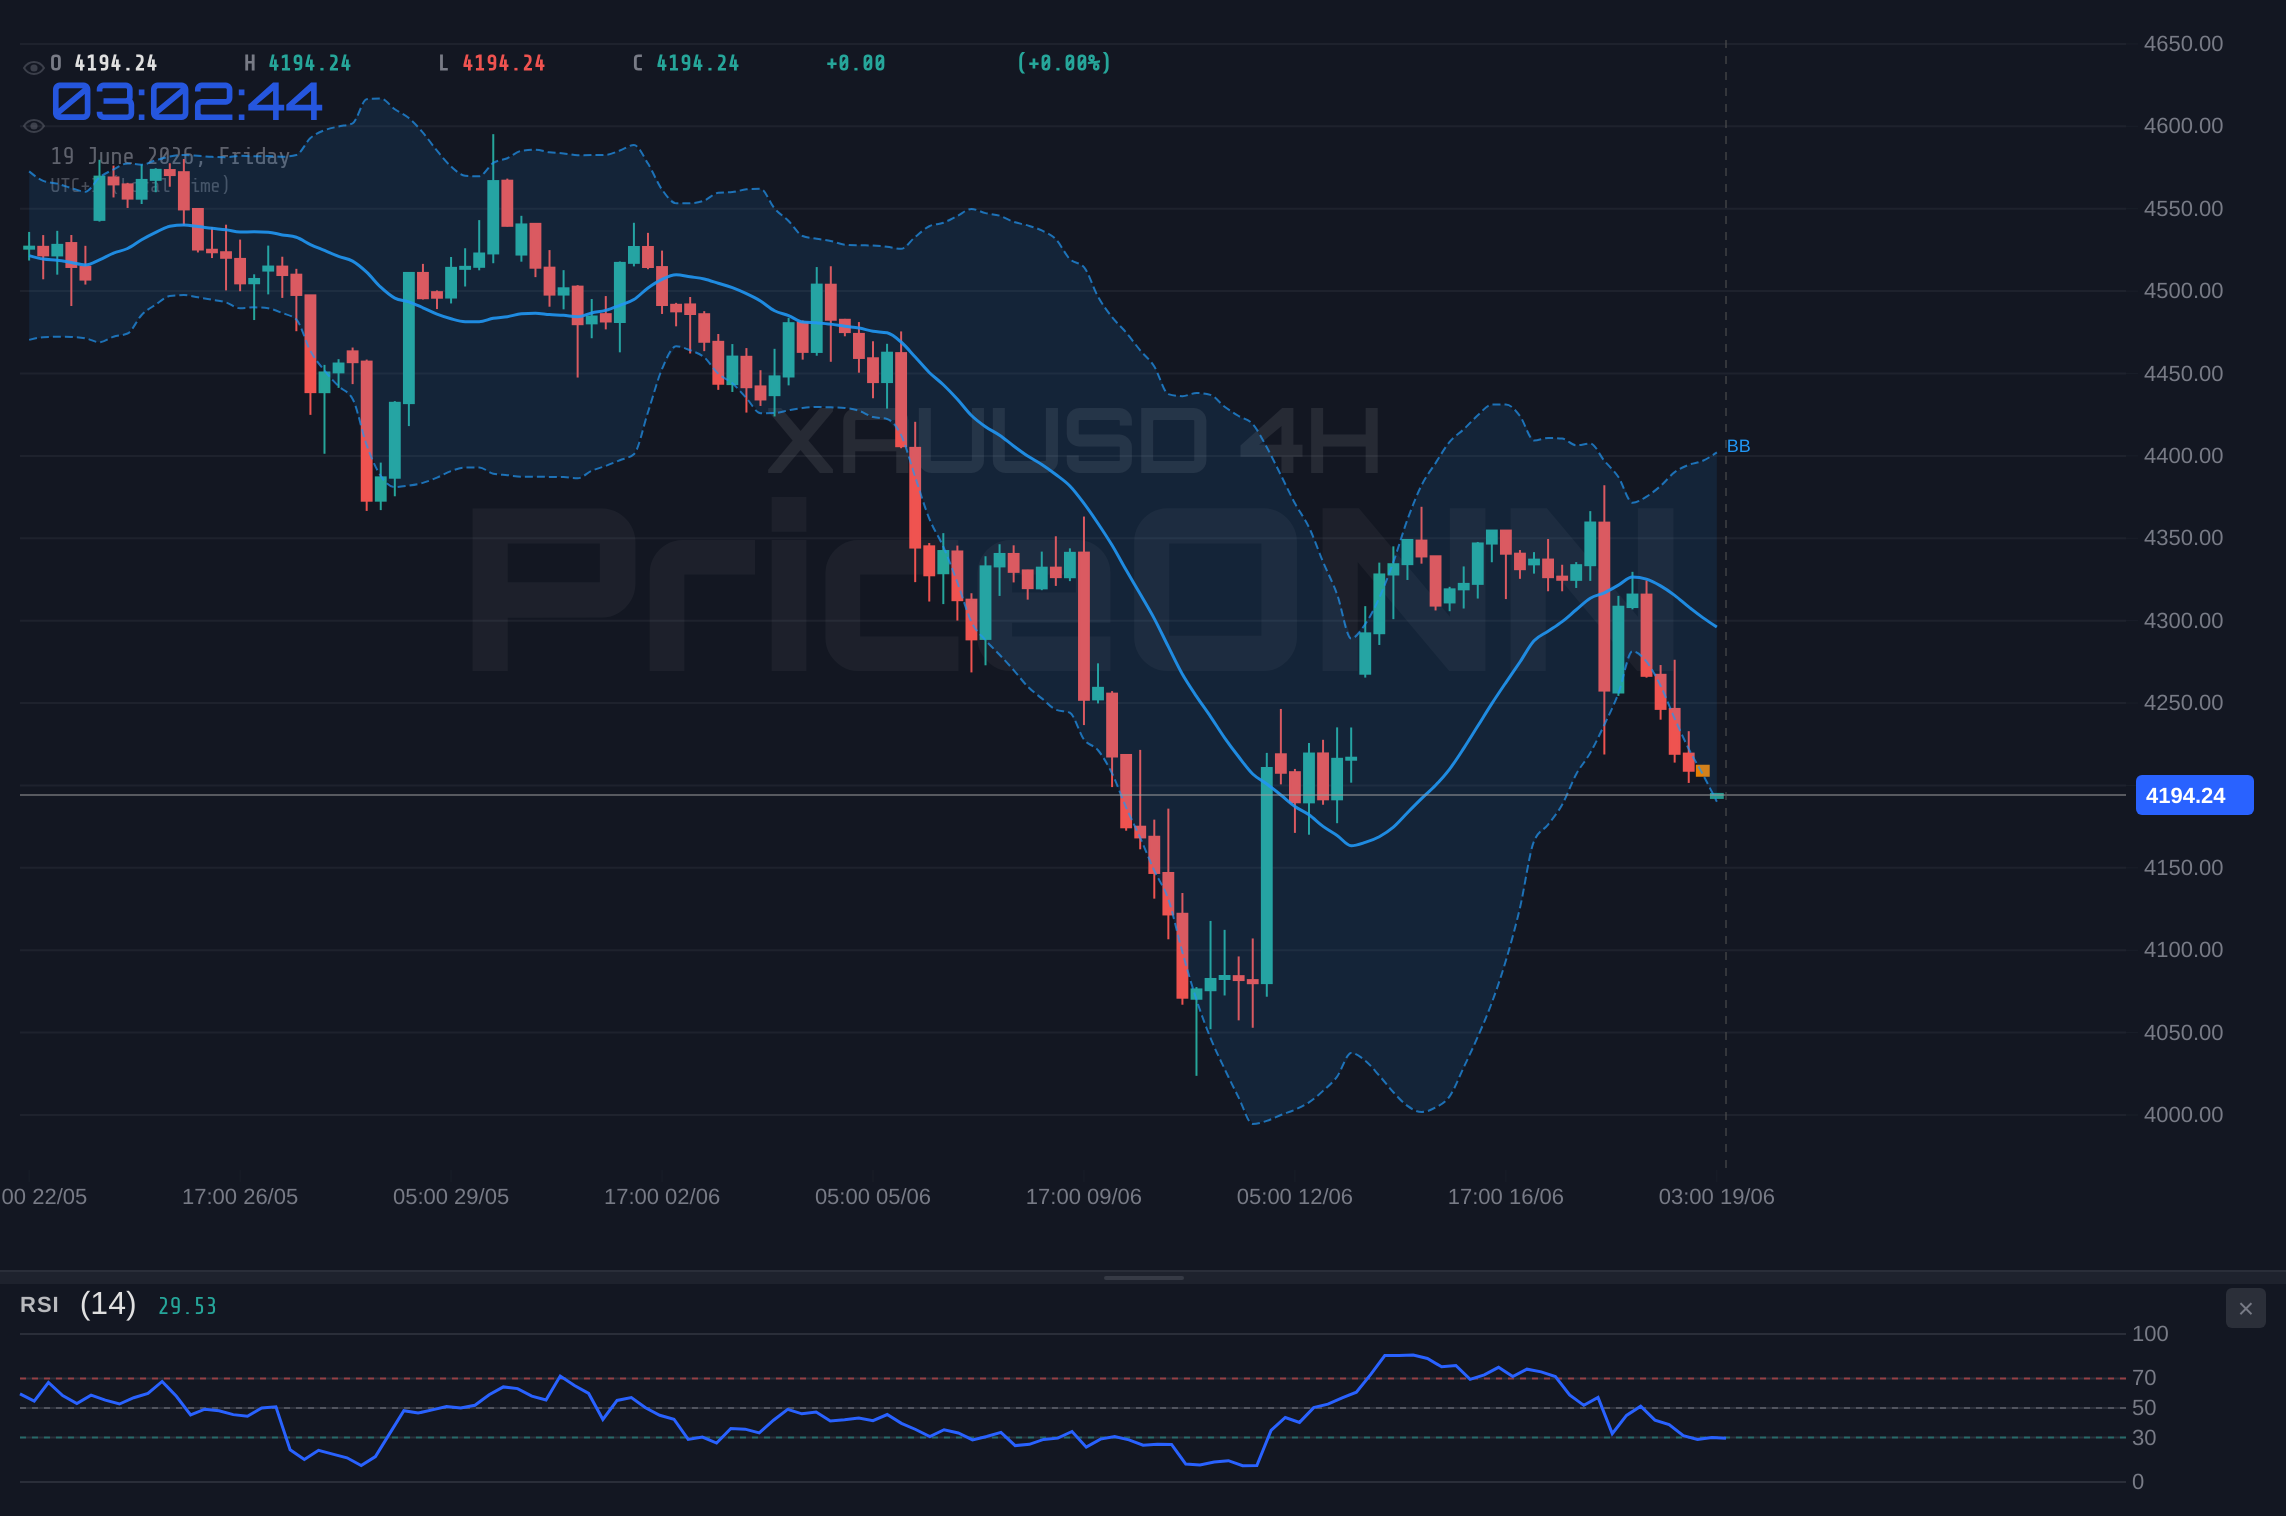
Moving to the 4-hour timeframe, the trend is characterized as neutral, but the underlying momentum remains subdued. The ADX here sits at 24.04, indicating a moderately strong trend, still leaning bearish. The RSI(14) is at 36.31, still within the neutral zone but clearly trending downwards, suggesting sellers are still more in control than buyers. MACD continues to exhibit negative momentum, and the Bollinger Bands are positioned below the middle band, aligning with the prevailing bearish bias. The Stochastic oscillator (%K: 6.7, %D: 34.57) paints a picture of deep oversold conditions, with %K significantly below %D, a bearish signal that hints at further potential downside or consolidation before any meaningful recovery. The overall signal on the 4-hour chart is also overwhelmingly 'SAT' (Sell), with no buy signals registered and eight sell signals, underscoring the persistent weakness.
On the daily chart, the bearish trend for XAUUSD remains firmly in place, albeit with a slight nuance in the overall strength. The ADX is at 35.96, denoting a strong trend, and the MACD continues to show negative momentum. However, the Stochastic oscillator presents a contrasting signal, with %K at 53.33 and %D at 40.98, indicating a bullish divergence as %K crosses above %D, emerging from oversold territory. This could be an early warning of a potential shift in momentum or a dead cat bounce. The RSI(14) at 37.2 remains in neutral territory, leaning towards oversold, and the Bollinger Bands are below the middle band, confirming the downtrend. Despite the mixed signal from the Stochastic, the daily timeframe still overwhelmingly favors selling, with 7 sell signals and only 1 buy signal, reflecting the dominant bearish sentiment. The key support level on this timeframe is $4,190.18, with immediate resistance found at $4,353.57.
The current price action around $4,189.75 is pivotal. On the 1-hour chart, the immediate support levels are $4,202.15, $4,197.11, and $4,191.58. A decisive break below these could accelerate the downtrend. Conversely, resistance is stacked at $4,212.72, $4,218.25, and $4,223.29. For the bulls to regain any semblance of control, they need to reclaim these resistance levels. However, given the broader bearish sentiment, a move above the daily resistance of $4,353.57 would be required to signal a more significant trend change. The proximity of the current price to the 1-hour support at $4,191.58 is critical; a failure to hold here could trigger further liquidation.
The broader market context, particularly concerning the US Dollar Index (DXY), cannot be overstated. With the DXY at 100.9 and exhibiting a strong upward trend, the pressure on gold is palpable. This strength in the dollar is often driven by expectations of tighter monetary policy, increased geopolitical uncertainty, or a general flight to safety. If the Federal Reserve signals a more hawkish stance, or if global tensions escalate in a way that favors the US dollar as the ultimate safe haven, gold could face prolonged headwinds. Conversely, any sign of dollar weakness, perhaps due to easing inflation concerns or a shift in Fed policy expectations, could provide a much-needed reprieve for gold. The current dynamic suggests that the dollar's strength is a primary driver, and its trajectory will heavily influence gold's next move.
Considering the overwhelming 'SELL' signals across the 1-hour and 4-hour timeframes, and the dominant bearish trend on the daily chart, the immediate outlook for XAUUSD remains cautious. The price is testing critical support levels, and the confluence of a strong dollar and negative momentum indicators suggests that further downside is possible. However, the extreme oversold readings on the oscillators, particularly on the 1-hour and 4-hour charts, warrant attention. A short-term bounce or consolidation is not out of the question as traders might look to take profits on existing short positions or test buying opportunities at these depressed levels. The key will be whether this potential bounce has legs or if it's merely a pause before the next leg down.
Let's consider the scenario probabilities. The technical landscape, dominated by bearish signals and a strong dollar, heavily favors a bearish outcome in the short to medium term. Therefore, a bearish scenario carries the highest probability. The primary trigger for this scenario would be a break and hold below the immediate support at $4,191.58. If this occurs, we could see a swift move towards the next significant support level at $4,134.21, and potentially even lower towards $4,026.79. The invalidation of this bearish thesis would occur if price decisively breaks above the 1-hour resistance at $4,223.29 and, more importantly, closes above the daily resistance at $4,353.57. The bullish scenario, while less probable currently, hinges on the oversold oscillators generating enough upward momentum to overcome the dollar's strength and break key resistance levels.
Bearish Scenario: Downside Momentum Continues
65% ProbabilityNeutral Scenario: Consolidation Around Support
25% ProbabilityBullish Scenario: Oversold Bounce Potential
10% ProbabilityLooking at the economic calendar, while no specific high-impact events for gold itself are listed within the last 48 hours, the broader macroeconomic sentiment is crucial. The prevailing narrative around potential Fed policy shifts, inflation data, and geopolitical developments continues to influence currency markets and, by extension, gold. For instance, recent reports on UK jobs growth stalling and wage pressures easing slightly, while specific to the UK, contribute to the global picture of economic indicators that central banks are monitoring. Any indication of cooling inflation or economic slowdown globally could bolster safe-haven demand for gold, but currently, the strong dollar is overriding these potential positives. Investors will be keenly watching upcoming economic releases for any signs that could shift the DXY's trajectory or alter inflation expectations.
The interplay between gold, the US dollar, and broader market sentiment is a constant dance. Historically, gold has served as a hedge against inflation and geopolitical turmoil. However, in recent times, its correlation with the dollar has often been more pronounced. When the DXY strengthens, as it is doing now at 100.9, gold typically faces selling pressure. This is a complex relationship, as gold can also act as a safe haven during times of geopolitical stress, which might simultaneously boost the dollar. Currently, the dollar's strength appears to be the dominant factor, pushing gold towards its support levels. The ADX at 32.47 on the 1-hour chart and 35.96 on the daily chart confirms that a strong trend is in motion, albeit a bearish one for gold.
The deeply oversold conditions indicated by the Stochastic and RSI on the shorter timeframes present an interesting dilemma. While a strong trend suggests that these oversold conditions can persist, they also increase the probability of a sharp rebound or a 'bull trap' if buyers decide to step in aggressively. For traders, this means that while the path of least resistance appears to be downwards, the potential for a snap-back rally cannot be ignored. The key support level at $4,190.18 is where the market is currently testing its resolve. A failure to hold this level could lead to a rapid cascade towards the next significant support at $4,122.79. Conversely, if buyers manage to defend $4,189.75 and push prices higher, the first hurdle will be the 1-hour resistance at $4,212.72.
The current technical setup for XAUUSD suggests a high probability of further downside, especially with the dollar's strength and the bearish momentum across most timeframes. The 1-hour and 4-hour charts show extreme oversold readings, which could lead to a short-term bounce, but the daily chart's overall trend remains bearish. This suggests that any rallies might be met with selling pressure, especially as price approaches resistance levels like $4,212.72 on the 1-hour chart or the more significant daily resistance at $4,353.57. The critical takeaway is that while the oversold conditions might tempt some to buy, the prevailing trend and macro factors suggest caution. The market is signaling a clear 'SELL' across multiple indicators, and until key resistance levels are convincingly broken, the downside remains the more probable path.
Frequently Asked Questions: XAUUSD Analysis
What happens if XAUUSD breaks below the $4,191.58 support level?
A break below $4,191.58 would likely trigger further selling pressure, potentially accelerating the decline towards the next significant support at $4,134.21. This would validate the bearish scenario, especially if the DXY continues to strengthen.
Is the RSI at 27.25 a buy signal for XAUUSD at current levels?
While an RSI of 27.25 indicates extreme oversold conditions on the 1-hour chart, it is not a direct buy signal in isolation, especially with a strong downtrend confirmed by ADX at 32.47. A confirmed bullish reversal would require price action to break key resistance levels and for oscillators to show sustained upward momentum.
How does the strong DXY at 100.9 affect XAUUSD's trend analysis?
A DXY reading of 100.9 signifies a strong US dollar, which typically exerts downward pressure on gold prices. This correlation is a key bearish factor for XAUUSD, as it makes gold more expensive for foreign buyers and suggests underlying strength in the US economy or risk appetite favoring the dollar.
How will upcoming economic data potentially impact XAUUSD if it deviates from expectations?
Unexpected inflation or employment data could significantly shift Fed rate expectations, impacting the DXY and subsequently XAUUSD. If data suggests higher inflation or a stronger economy than expected, gold might face renewed selling. Conversely, weaker data could boost safe-haven demand for gold if it leads to dollar weakness.
| Indicator | Value | Signal | Interpretation |
|---|---|---|---|
| RSI (14) | 27.25 | Oversold | Potential bounce, but downtrend strong |
| MACD Histogram | -15.20 | Negative | Strong selling momentum |
| Stochastic (%K) | 7.27 | Oversold | Extreme downside, potential reversal if confirmed |
| ADX | 32.47 | Strong Trend | Momentum favors current direction (down) |
| Bollinger Bands | Price below Middle Band | Bearish bias confirmed | |
Track markets in real-time
AI-powered analysis, technical indicators and real-time price data.
Join Our Telegram Channel
Breaking market news, AI analysis and trading signals instantly.
Join Channel