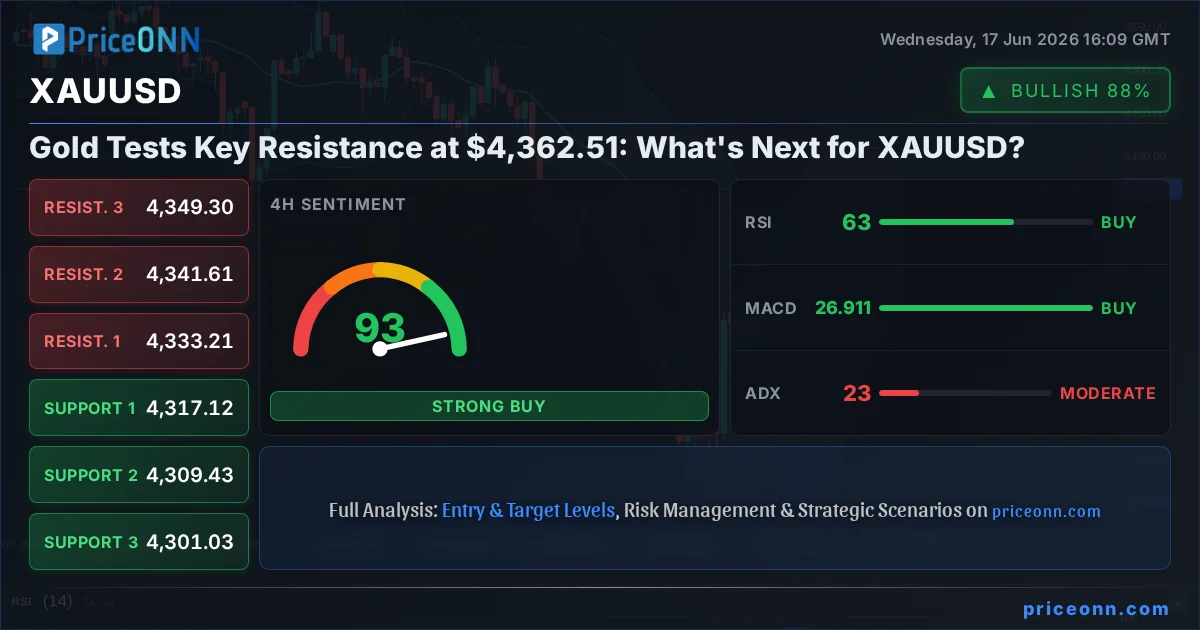
Gold, or XAUUSD, is currently trading at a critical juncture, hovering around the $4,362.51 mark. The precious metal has been on an upward trajectory, but it's now approaching a significant resistance level at $4,355.49. This confluence of price action and technical indicators paints a complex picture, demanding a closer look at the underlying market dynamics. The question on many traders' minds is whether this current price action represents a consolidation before another leg up, or if the resistance at $4,355.49 will hold firm, signaling a potential pullback. Understanding the interplay between global risk sentiment, the strength of the US Dollar Index (DXY), and geopolitical undercurrents is crucial for navigating the path ahead.
- XAUUSD faces key resistance at $4,355.49, currently trading around $4,362.51 with upward momentum.
- The 1-hour and 4-hour charts show bullish signals (RSI 66.85 and 63.11), while the daily chart indicates a 92% strong downtrend (RSI 46.13).
- DXY is at 99.75, showing a 0.18% daily rise, potentially pressuring gold prices if it continues to climb.
- Geopolitical shifts and Fed expectations are driving gold's recent 2% surge since the week's opening, according to recent reports.
The gold market is at a pivotal moment. After a notable climb, XAUUSD finds itself testing the boundaries of resistance, with the $4,355.49 level acting as a significant hurdle. The current price of $4,362.51 indicates a slight breach, but the true strength of this move will be determined by its sustainability. On the 1-hour chart, gold exhibits strong bullish momentum, with RSI at 66.85 and a general 'BUY' signal across multiple indicators. This short-term optimism is echoed in the 4-hour timeframe, where the trend is also bullish with an 86% strength and a prevailing 'BUY' signal. However, the longer-term daily perspective presents a contrasting view. The daily chart shows a strong 92% bearish trend, with RSI at 46.13 and a 'SELL' signal dominating. This divergence between short-term bullishness and long-term bearish indicators creates a critical tension that traders are closely monitoring. The ability of gold to sustain a close above the $4,361.87 resistance on the 1H chart and push towards the $4,379.21 level will be key for the bulls. Conversely, a failure to hold these gains and a decisive break below the $4,329.11 support could signal a reversal.
The broader market context is equally important in deciphering gold's next move. The US Dollar Index (DXY) is currently trading at 99.75, showing a modest daily increase of 0.18%. Historically, a strengthening dollar often exerts downward pressure on gold, as the precious metal is priced in USD. If the DXY continues its ascent, it could act as a significant headwind for gold prices, potentially invalidating the short-term bullish signals. Conversely, any sign of weakness in the DXY could provide further fuel for gold's rally. Recent news highlights geopolitical shifts and evolving Federal Reserve expectations as key drivers for gold's upward momentum. Reports indicate that gold has surged over 2% since the week's opening, fueled by these factors. This suggests that while the technical picture offers mixed signals across different timeframes, fundamental drivers are currently leaning towards a supportive environment for gold. The delicate balance between dollar strength, geopolitical anxieties, and central bank policy expectations will dictate whether gold can overcome its daily bearish trend.
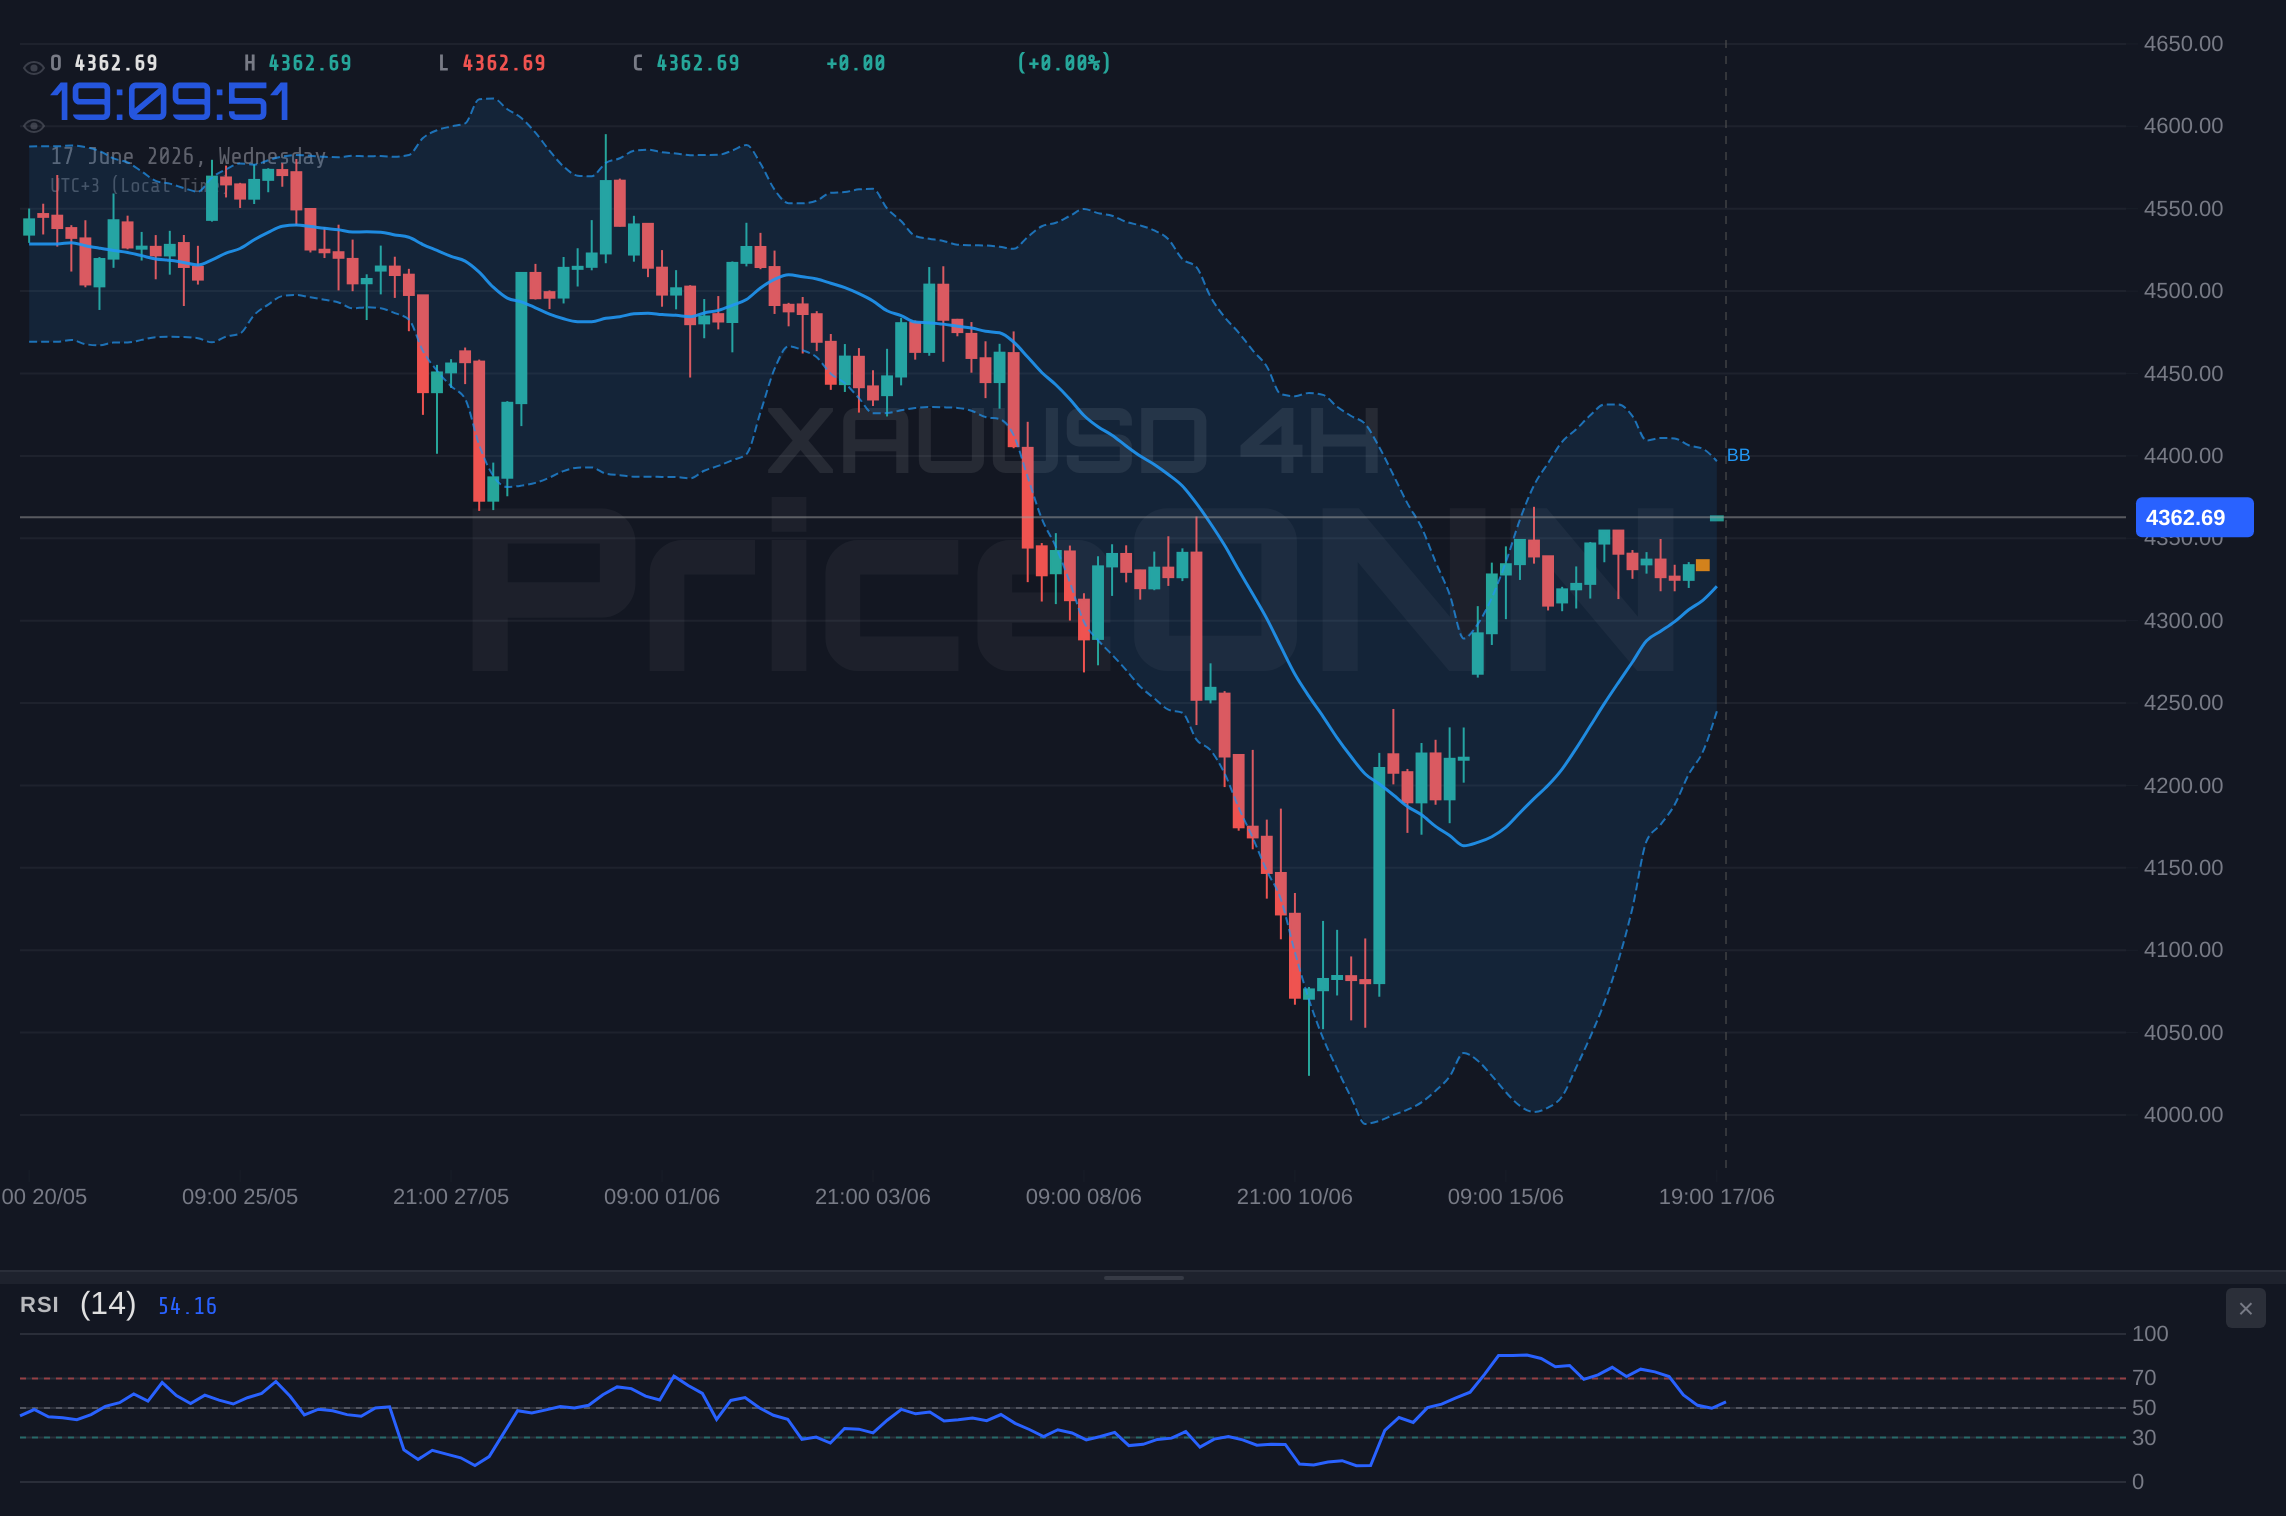
Delving deeper into the technicals, the 1-hour timeframe for XAUUSD shows a robust uptrend, supported by an RSI of 66.85 and positive MACD momentum. The Stochastic oscillator, with K at 78.13 and D at 59.03, clearly indicates a bullish signal, with %K surpassing %D. Bollinger Bands are positioned above the upper band, suggesting either strong upward momentum or an overbought condition that might precede a pullback. However, the ADX at 13.87 points to a weak trend, implying that this upward move might lack sustained conviction. This is a crucial observation; while the indicators are screaming 'buy' in the short term, the low ADX suggests that the underlying trend strength isn't yet fully established. This creates a scenario where a breakout could be sharp, but a reversal could also be swift if key levels are breached. The general 'BUY' signal across most indicators on this timeframe is encouraging for intraday traders, but the lack of strong trend confirmation on the ADX warrants caution.
The 4-hour chart offers a slightly more nuanced, yet still predominantly bullish, perspective for XAUUSD. The trend is confirmed as bullish with 86% strength. RSI stands at 63.11, comfortably in the neutral zone with an upward bias. MACD shows positive momentum, with the MACD line above its signal line, reinforcing the bullish sentiment. Bollinger Bands are trading above the middle band, indicating an upward bias. The Stochastic oscillator (K=60.28, D=55.08) also provides a bullish signal, with %K above %D. However, the ADX here is 22.62, which, while stronger than the 1-hour reading, still classifies the trend as moderately strong rather than overwhelmingly dominant. This suggests that the upward move has some backing, but it's not yet a runaway train. The overall 'BUY' signal (7 buys, 1 sell) from the 4-hour indicators aligns with the short-term optimism, suggesting that if the price can maintain its position above the $4,333.21 resistance, further upside is plausible within this timeframe.
The daily chart, however, paints a starkly different picture, revealing a strong 92% bearish trend for XAUUSD. The RSI at 46.13 sits in the neutral zone but leans towards a bearish bias, indicating that sellers are beginning to exert pressure. MACD, despite showing positive momentum on shorter timeframes, is positioned above its signal line, but the overall trend context suggests this might be a temporary reprieve. Bollinger Bands are trading below the middle band, a classic sign of bearish pressure. The Stochastic oscillator shows a bullish signal (K=64.91, D=34.8), which appears to be an anomaly when viewed against the dominant bearish trend and ADX reading of 34.77. This ADX value signifies a strong downtrend, suggesting that the prevailing direction is downwards. The 'SELL' signal on the daily timeframe (3 buys, 5 sells) underscores this bearish outlook. This daily perspective is critical; it implies that any short-term rallies might be opportunities for sellers to enter the market or for existing positions to be liquidated.
Considering the divergence between the timeframes, the most likely scenario hinges on the interplay between the immediate bullish pressures and the dominant long-term bearish trend. The $4,355.49 resistance level on the daily chart is paramount. If XAUUSD fails to decisively break and hold above this level, the bearish trend indicated by the daily chart will likely reassert itself. This could lead to a retracement towards the daily support levels, beginning with $4,306.36. The 1-hour and 4-hour bullish signals might represent a 'bear market rally' – a temporary upswing within a larger downtrend. Such rallies often trap unwary buyers before the price resumes its downward path. The fact that the DXY is showing strength adds to this cautionary tale. A sustained break above $4,361.87 on the 1H chart is needed to even consider a bullish continuation scenario in the very short term.
The geopolitical landscape and central bank expectations are currently providing a tailwind for gold. Recent reports mention that Europe is bracing for continued energy price shocks despite tentative peace deals, and the US-Iran situation remains a point of tension. These factors typically increase demand for safe-haven assets like gold. Furthermore, evolving Federal Reserve expectations, possibly influenced by inflation data, can sway gold prices. If inflation proves persistent, it could prompt the Fed to maintain a hawkish stance or delay rate cuts, which historically supports gold as an inflation hedge. Conversely, any signs of easing inflation or a dovish shift from the Fed could reduce gold's appeal. The interplay of these macro factors with the current technical setup is what makes the $4,355.49 to $4,362.51 range so critical. A break above this zone, supported by positive macro news, could signal a more significant upside move, whereas failure here reinforces the bearish daily outlook.
The market sentiment, as indicated by the aggregate signals across different timeframes, presents a mixed bag, but with a clear leaning towards caution when considering the longer term. While the 1-hour and 4-hour charts are predominantly bullish, the overwhelming 'SELL' signal on the daily chart cannot be ignored. This suggests that the current upward momentum might be a short-term phenomenon, potentially a 'relief rally' within a broader downtrend. The ADX readings further complicate the picture: strong trends on the daily (34.77) and 4-hour (22.62) charts are contradicted by the weak trend on the 1-hour (13.87). This indicates choppiness and a lack of clear directional conviction across all timeframes simultaneously. For traders, this means careful risk management is paramount. Scalpers might find opportunities on the buy-side in the very short term, but swing and position traders would likely be looking for clearer signals or a confirmed break of key daily levels before committing.
Now, let's consider the scenario cards, mapping out potential paths for XAUUSD based on the current data. The probabilities assigned reflect the technical confluence and the prevailing trend signals across different timeframes, with a slight edge given to the dominant daily bearish trend. The immediate resistance at $4,355.49 and the current price hovering around $4,362.51 are the focal points. A sustained move above these levels, especially with supportive macro news, could invalidate the bearish thesis. Conversely, a failure to hold current levels and a break below the $4,329.11 support on the 1H chart would strongly favor the bearish outlook.
Bearish Scenario: The Daily Downtrend Reasserts
65% ProbabilityBullish Scenario: Breaking Out to New Highs
25% ProbabilityNeutral Scenario: Range-Bound Consolidation
10% ProbabilityThe current market environment for XAUUSD is a classic example of conflicting signals across timeframes, amplified by external macro factors. The short-term charts are painting a bullish picture, driven by what appears to be a combination of geopolitical risk appetite and potentially shifting Fed expectations, as suggested by recent news. However, the dominant daily trend remains bearish, underpinned by strong ADX readings and a prevailing 'SELL' signal. This divergence means that while intraday traders might find opportunities on the buy side, longer-term investors should exercise extreme caution. The critical battleground remains around the $4,355.49 daily resistance and the $4,361.87 hourly resistance. A failure to decisively clear these levels could see the bearish daily trend reassert itself, pushing gold back towards its support levels, starting with $4,306.36.
What I'm watching closely this week are three key triggers. Firstly, the sustainability of price action above the $4,361.87 hourly resistance. A strong hourly close above this level, especially with increasing volume and confirmation from a weaker DXY, would lend credence to the bullish scenario. Secondly, I'm monitoring the daily close relative to the $4,355.49 resistance. A daily close below this level, particularly if accompanied by rising Treasury yields or a strengthening dollar, would strongly favor the bearish outlook. Lastly, I'll be keeping an eye on geopolitical headlines and any fresh commentary from Federal Reserve officials. Any significant developments that shift the market's perception of inflation, interest rates, or global stability could act as a catalyst, potentially breaking the current deadlock and ushering in a more decisive move for gold.
The interplay between the dollar's strength and gold's safe-haven appeal is a constant theme. With the DXY at 99.75 and showing upward momentum, it presents a headwind for gold. However, geopolitical tensions often override dollar strength, creating complex correlations. The fact that gold has rallied significantly despite a firming dollar suggests that the safe-haven bid is currently potent. Traders should remain vigilant, as any de-escalation in geopolitical hotspots could quickly shift the narrative, leading to a sharp unwinding of gold's gains and a strengthening of the dollar. This highlights the importance of not relying solely on one indicator or timeframe but integrating a holistic view of market forces.
| Indicator | Value | Signal | Interpretation |
|---|---|---|---|
| RSI (14) | 66.85 | Neutral | Approaching overbought on 1H, but still room to run. Daily RSI at 46.13 shows caution. |
| MACD Histogram | +15.27 | Bullish | Positive momentum on 1H, confirming short-term strength. Daily MACD is also positive. |
| Stochastic | K: 78.13, D: 59.03 | Bullish | Strong bullish signal on 1H, but approaching overbought. Daily Stochastic shows a recovery signal. |
| ADX | 13.87 | Weak Trend | Lack of strong trend confirmation on 1H. Daily ADX at 34.77 indicates a strong downtrend. |
| Bollinger Bands | Upper Band | Watch | Price above upper band on 1H suggests momentum, but could signal overextension. Daily is below middle band. |
The current price action in XAUUSD, sitting at $4,362.51, represents a critical inflection point. While short-term indicators suggest bullish momentum, the overarching daily trend remains bearish. This divergence demands a high degree of risk management. Traders should not chase this rally blindly but rather wait for confirmation or a clear breakdown. The battle between the bulls aiming to push past $4,379.21 and the bears defending the $4,355.49 daily resistance will likely define the near-term direction. Patience and adherence to a well-defined trading plan are essential. The market always offers opportunities, but it's crucial to wait for the right setup, especially when faced with such conflicting signals across different timeframes.
Frequently Asked Questions: XAUUSD Analysis
What happens if XAUUSD fails to break above $4,361.87 resistance?
If XAUUSD fails to hold above the $4,361.87 hourly resistance and closes below $4,329.11 support, the bearish daily trend is likely to reassert itself, targeting $4,306.36 and potentially $4,281.49.
Should I buy XAUUSD at current levels of $4,362.51 given the bullish 1H/4H signals?
Buying at current levels carries risk due to the dominant daily bearish trend. A confirmed close above $4,355.49 with supportive macro news is needed for a higher probability bullish setup, targeting $4,379.21.
Is RSI at 66.85 a sell signal for XAUUSD right now?
The RSI at 66.85 on the 1-hour chart indicates strong upward momentum but is approaching overbought territory. It's not a direct sell signal yet, but suggests caution and potential for a short-term pullback, especially against the daily bearish trend.
How will the Fed expectations affect XAUUSD this week?
Evolving Fed expectations, particularly regarding inflation and interest rates, are a key driver. Persistent inflation concerns could support gold as a hedge, potentially pushing prices towards $4,379.21 if the Fed remains hawkish, while easing inflation could dampen gold's appeal.
Track markets in real-time
AI-powered analysis, technical indicators and real-time price data.
Join Our Telegram Channel
Breaking market news, AI analysis and trading signals instantly.
Join Channel