The battle lines are drawn for Bitcoin (BTCUSD) as it consolidates near the critical $64,189.00 level. Bulls and bears are locked in a tense standoff, with traders scrutinizing every tick for clues about the next major move. This multi-timeframe analysis delves into the conflicting signals, intermarket correlations, and potential catalysts shaping BTCUSD's immediate future, aiming to provide clarity in a market that's anything but simple.
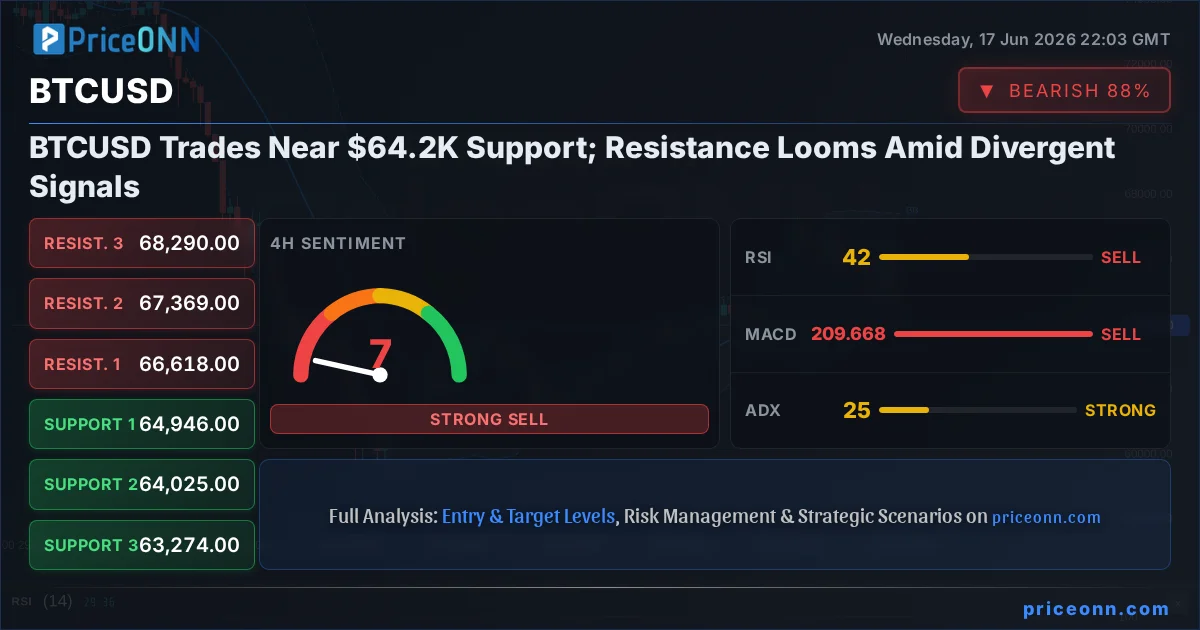
- BTCUSD hovers at $64,189.00, testing crucial support levels.
- RSI at 34.06 signals bearish momentum on the 1H chart, while ADX at 22.35 indicates a moderate trend.
- Key support is identified at $64,065, with resistance eyed around $64,556.
- DXY's ascent to 100.45 adds pressure, contrasting with a risk-on sentiment in the S&P 500.
The cryptocurrency market, often characterized by its rapid shifts and dramatic swings, is currently presenting a complex picture for Bitcoin. After a significant downturn, BTCUSD finds itself perched precariously above the $64,189.00 mark. This price point is not arbitrary; it represents a confluence of historical support and a psychological level that traders are watching closely. The question on everyone's mind is whether this level will hold, providing a springboard for a recovery, or if the relentless selling pressure will push prices lower, triggering a cascade of stop-loss orders. Understanding the interplay between technical indicators, broader market sentiment, and macroeconomic factors is crucial for navigating this pivotal juncture.
On the 1-hour timeframe, the technical indicators paint a decidedly cautious, if not bearish, picture. The Relative Strength Index (RSI) hovers at 34.06, firmly within neutral territory but leaning towards oversold conditions, suggesting that sellers have been dominant recently. However, it's not yet in the extreme oversold territory that might typically signal an immediate bounce. Complementing this, the Moving Average Convergence Divergence (MACD) histogram is negative and positioned below the signal line, reinforcing the bearish momentum observed in the short term. The Average Directional Index (ADX) at 22.35 indicates a moderate trend strength, implying that while there's directional movement, it hasn't reached the intensity of a full-blown trend yet. This suggests that any upward movement could face immediate headwinds from profit-taking or renewed selling.
The Bull Case: Defending the $64.2K Line
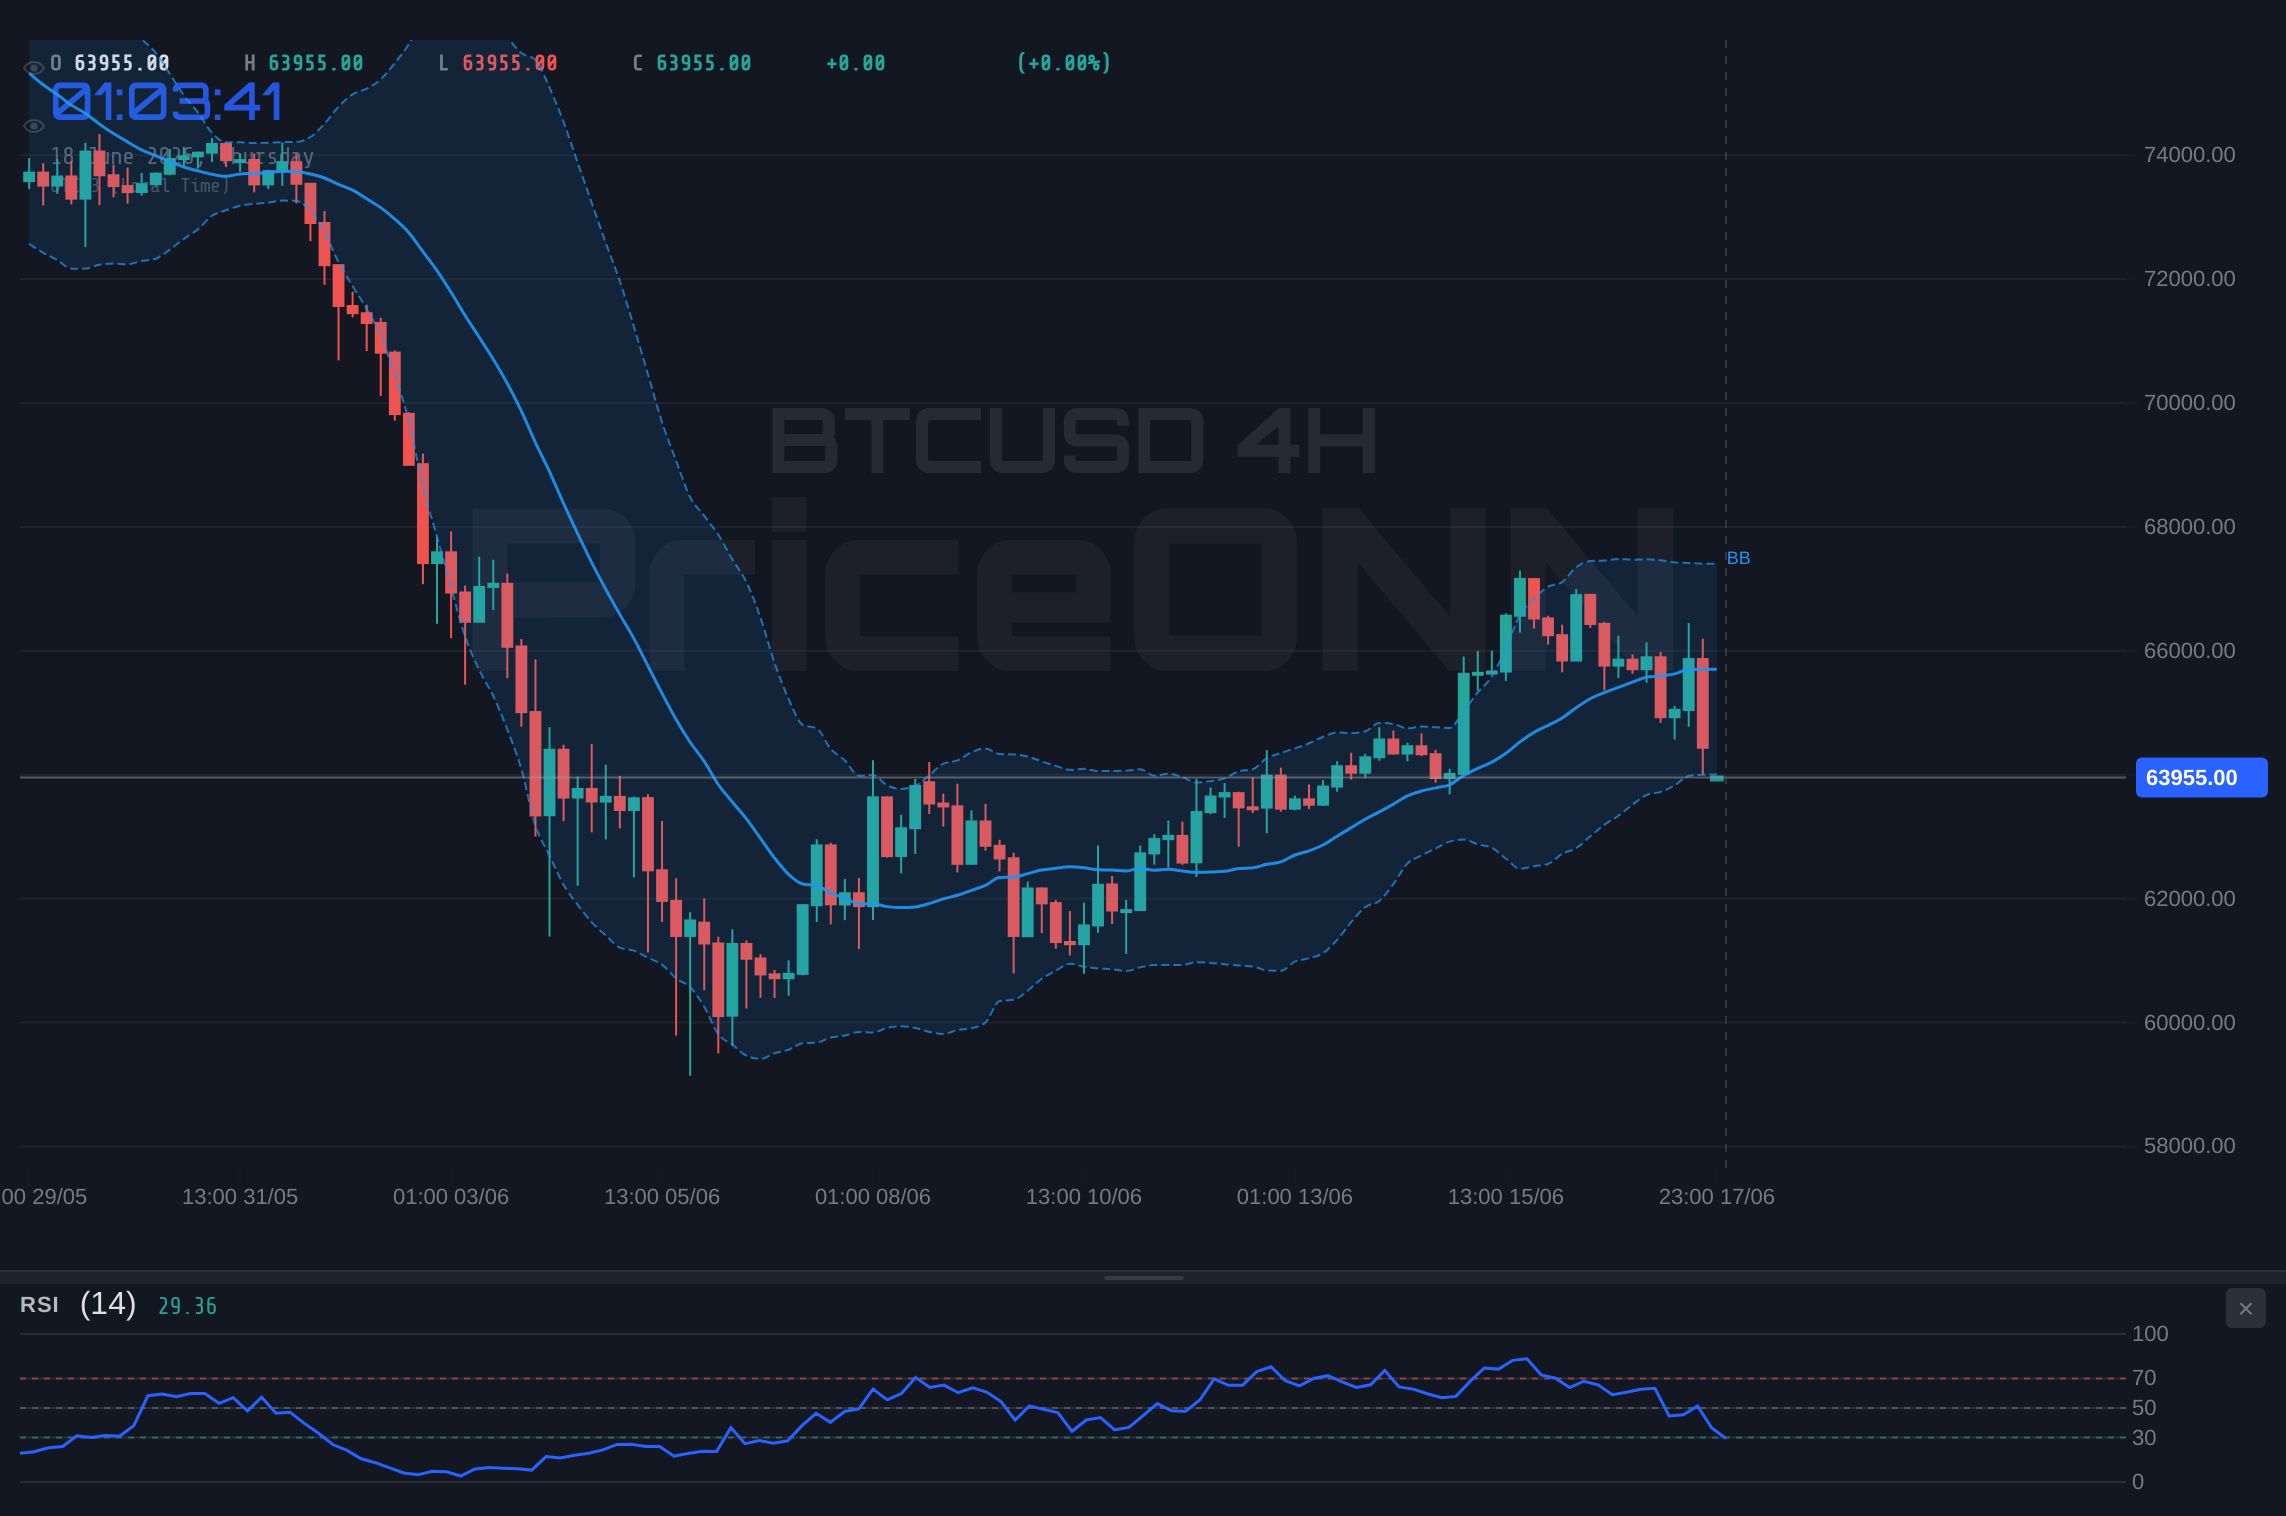
Despite the short-term bearish signals, a robust argument can be made for a bullish continuation, provided key levels hold. The 4-hour chart offers a glimmer of hope. While the RSI at 42.89 still indicates a downtrend, it's less severe than the 1-hour reading. More importantly, the Stochastic oscillator is showing a potential bullish crossover, with %K (26.61) poised to cross above %D (22.16). This, combined with the ADX at 25.27 (indicating a strengthening trend, albeit still moderate), suggests that the market might be preparing for a reversal. The key here is the ability of bulls to defend the immediate support levels, particularly the $64,065 mark identified on the 4-hour chart. A failure to hold this would invalidate much of the bullish thesis, but a successful defense could see prices re-test higher resistance levels.
Furthermore, the daily chart, while showing a downtrend bias, presents a different perspective on momentum. The MACD is positive and above its signal line, indicating underlying bullish momentum that might not be fully reflected in the current price action. This divergence between the daily MACD and the shorter-term price action could be a precursor to a larger trend shift. The Stochastic oscillator on the daily timeframe shows %K at 72.98 and %D at 74.19, signaling an overbought condition. While this can sometimes precede a reversal, in a strong uptrend, it can also indicate sustained buying pressure. The ADX at 39.14 on the daily chart is concerning, pointing to a strong trend, but its alignment with the MACD's positive momentum suggests that this strong trend could potentially be upwards if buying pressure intensifies.
The Bear Case: Momentum Favors the Downside
Conversely, the bearish argument is compelling, particularly when examining the confluence of signals across multiple timeframes. The overwhelming 'SAT' (Sell) signals across the 1-hour and 4-hour timeframes, with only a handful of 'AL' (Buy) signals, cannot be ignored. The persistent negative MACD momentum on the 1-hour and 4-hour charts, coupled with RSI readings that, while not extremely oversold, consistently favor downside pressure, suggests that the path of least resistance is currently downwards. The ADX readings, while indicating moderate to strong trends, are often aligned with the dominant direction, which appears to be bearish in the shorter term. The price action itself, with BTCUSD trading below its 1-hour and 4-hour middle Bollinger bands, further supports the notion of immediate selling pressure.
The daily chart's ADX at 39.14 is particularly noteworthy. A reading above 25 generally signifies a strong trend, and at nearly 40, it indicates that the market is not merely fluctuating but is in a firmly established trend. While the MACD is positive on the daily, this could represent lingering bullish momentum from a previous cycle that is now being overwhelmed by a new bearish impulse. The Stochastic oscillator on the daily chart, showing %K (72.98) above %D (74.19), is technically a bearish signal, indicating that the recent upward movement might be losing steam and could be poised for a pullback. The fact that BTCUSD is trading below its daily middle Bollinger band also reinforces the bearish sentiment on the longer timeframe, suggesting that the current price level might be a temporary reprieve rather than a stable support.
Intermarket Dynamics: DXY's Shadow and Equity's Mixed Signals
To fully grasp the forces acting on BTCUSD, we must look beyond its own chart and examine its correlations with other major markets. The US Dollar Index (DXY) is currently showing significant strength, trading at 100.45 and exhibiting a strong upward trend on the 1-hour and daily charts. Historically, a strengthening dollar often correlates with a risk-off environment, putting pressure on riskier assets like Bitcoin. The DXY's RSI at 82.83 on the 1-hour chart indicates extreme overbought conditions, suggesting a potential pullback in the dollar could offer some relief to BTCUSD. However, until that dollar pullback materializes, its strength remains a headwind.
Equities present a more complex picture. The S&P 500 is showing a strong upward trend on the 1-hour chart, trading at 6572.87, and the Nasdaq 100 is also showing bullish signs on its daily chart, despite some short-term weakness. This suggests a degree of risk appetite in the broader stock market, which would typically be supportive of Bitcoin. However, the Dow Jones Industrial Average (DJIA) presents a conflicting view, with a strong bearish signal on its 1-hour chart and a mixed overall trend. This divergence within the equity markets adds another layer of uncertainty. The falling oil prices, as indicated by Brent Crude trading at $78.83 and WTI at $75.99, both showing bearish trends, could ease inflationary pressures. This might reduce the impetus for aggressive central bank tightening, which could indirectly benefit risk assets like Bitcoin. However, the immediate impact of falling oil prices is often seen as a signal of weakening global demand, which can also be interpreted as risk-off.
Geopolitical Undercurrents and Inflationary Pressures
In the background, geopolitical shifts continue to influence market sentiment. News regarding potential US-Iran agreements and their impact on oil prices suggests a potential easing of energy-related inflation concerns. While this could be positive for risk assets by reducing the need for hawkish central bank policies, the underlying geopolitical tensions remain a constant source of volatility. The ECB's stance, as reported by some outlets, indicates that Europe will still face energy price shocks despite tentative peace deals, highlighting the persistent inflationary risks that could force central banks to maintain tighter monetary policies. Higher interest rates globally tend to dampen enthusiasm for speculative assets like Bitcoin, as the cost of capital increases and the attractiveness of safer, yield-bearing assets rises.
The interconnectedness of these factors cannot be overstated. A strong dollar, coupled with persistent inflation fears or geopolitical instability, creates a challenging environment for cryptocurrencies. Conversely, signs of easing inflation, a dovish pivot from major central banks, or a significant shift towards risk-on sentiment could provide the catalyst needed for Bitcoin to break its current resistance. For now, the market appears to be caught between these opposing forces, leading to the tight consolidation observed around the $64,189.00 level. Traders are likely waiting for a clearer signal from macroeconomic data releases or a decisive move in correlated markets before committing to a significant position.
Navigating the Current Market Structure
The current market structure for BTCUSD is characterized by a lack of clear direction, often referred to as a 'chop' or 'range-bound' environment. On the hourly chart, the ADX at 22.35 indicates that the trend is not yet strongly established, making it difficult to rely on trend-following strategies. This environment often leads to whipsaws, where prices briefly move in one direction before reversing sharply. Scalpers and short-term traders might find opportunities in these fluctuations, but swing and position traders often prefer to wait for a clearer breakout or breakdown.
The trading signals from the indicators are mixed. While shorter timeframes lean bearish, the daily MACD suggests underlying bullish momentum. This conflict implies that the market is at a critical juncture. A break below the $64,065 support could trigger a move towards the next support at $63,944, potentially attracting buyers looking for a dip. However, a sustained break above the immediate resistance at $64,556 could signal a more significant recovery, targeting higher levels. The lack of strong conviction from indicators like the RSI on the hourly chart (34.06) suggests that neither bulls nor bears have a decisive upper hand at this exact moment, making risk management paramount.
The Path Forward: Scenarios and Probabilities
Given the current ambiguity, it's prudent to outline potential scenarios. The market's indecision suggests a period of consolidation or a potential breakout/breakdown. The probabilities assigned reflect the technical leanings and intermarket correlations discussed.
Bearish Scenario: Breaking Below Support
65% ProbabilityNeutral Scenario: Consolidation Around $64.2K
25% ProbabilityBullish Scenario: Defense and Recovery
10% ProbabilityFrequently Asked Questions: BTCUSD Analysis
What happens if BTCUSD breaks below the $64,065 support level?
A break below $64,065 on the 1-hour chart, especially with increased volume, would likely trigger further selling pressure. This could lead to price targets around $63,944 and potentially $63,274, as indicated by the 4-hour support levels. The bearish scenario currently carries a 65% probability.
Should I buy BTCUSD at current levels of $64,189.00 given the mixed signals?
Buying at current levels carries significant risk due to the bearish short-term indicators and the strong DXY. A more prudent approach would be to wait for confirmation: either a strong defense of $64,065 leading to a bounce, or a clear breakdown below this level to reassess entry points. The current environment is not ideal for aggressive buying.
Is the RSI at 34.06 a sell signal for BTCUSD right now?
An RSI of 34.06 on the 1-hour chart indicates bearish momentum but isn't in extreme oversold territory. It suggests sellers have been in control, but it doesn't automatically signal a 'sell' for immediate action. It's more of a warning that the price has been falling and could be due for a temporary bounce, or continue lower if other bearish factors align.
How will the strong DXY at 100.45 affect BTCUSD this week?
The strong DXY, trading at 100.45 and showing bullish momentum, typically exerts downward pressure on risk assets like BTCUSD. This correlation suggests that continued dollar strength could hinder any significant recovery attempts by Bitcoin, potentially leading to further downside unless the dollar shows signs of reversal or inflation fears subside dramatically.
Track markets in real-time
AI-powered analysis, technical indicators and real-time price data.
Join Our Telegram Channel
Breaking market news, AI analysis and trading signals instantly.
Join Channel