This past week for Bitcoin, BTCUSD has been trading around the critical $64,573 mark, painting a picture of neutrality that traders are dissecting with a fine-tooth comb. After a period of significant volatility, the market appears to be consolidating, waiting for the next catalyst. The question on everyone's mind is: what does this calm before the storm tell us, and where are the key levels to watch as we move into a data-heavy week? We've seen a fascinating interplay between on-chain metrics, macroeconomic influences, and technical patterns, all converging to create a complex but potentially rewarding environment for those who can navigate it with precision. This analysis delves into the current state of BTCUSD, examining the subtle shifts in its technical indicators and correlating them with broader market forces to offer a clear perspective on the path forward.
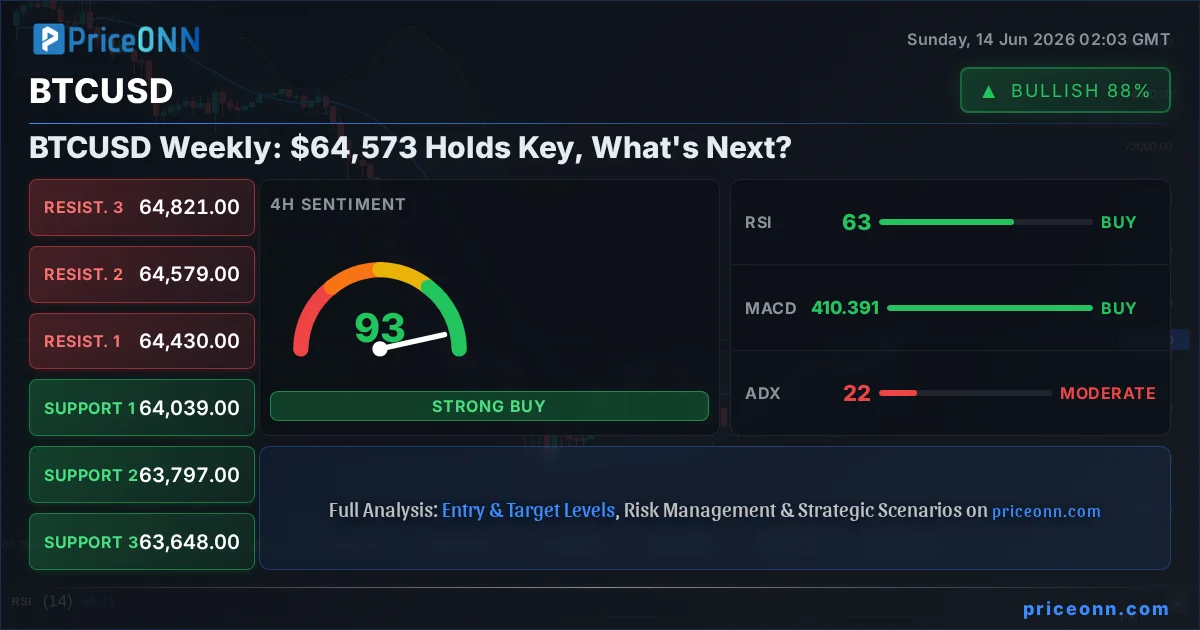
- BTCUSD is consolidating around $64,573, indicating a neutral market sentiment after recent volatility.
- The RSI at 67.42 on the 1-hour chart suggests overbought pressure is building, potentially signaling a short-term pullback.
- Critical support for BTCUSD remains at $64,236.33, a level that needs to hold for the bullish short-term trend to persist.
- The ADX at 34.49 on the 1-hour chart indicates a strong uptrend is present, contradicting some of the weaker signals from other oscillators.
- Correlation analysis with DXY, currently at 99.78, suggests a potential headwind for risk assets if the dollar strengthens further.
The week concluded with BTCUSD hovering precariously close to the $64,573 level, a price point that has become a battleground for bulls and bears. While the 1-hour and 4-hour charts suggest a continuation of the upward momentum, with strong bullish signals from ADX and Stochastic oscillators respectively, the daily timeframe paints a more cautious picture. The daily RSI at 36.88 indicates a downtrend is still firmly in place, and the MACD histogram showing negative momentum suggests that underlying selling pressure might be masked by short-term buying. This divergence across timeframes is precisely why a neutral stance is currently warranted. The market is at an inflection point, and the upcoming economic data releases will be crucial in determining which direction the pendulum swings. For now, patience is the name of the game, and observing how price reacts to key support and resistance levels will be paramount for any informed trading decisions.
Navigating the Neutral Zone: BTCUSD's Technical Tightrope
The Daily Divergence: A Tale of Two Trends
Looking at the daily chart for BTCUSD, the narrative is one of caution. The current price of $64,573.00 finds itself below the middle Bollinger Band, a technical indicator that often signals a shift in trend when prices consistently trade outside its bands. This positioning, coupled with a daily RSI reading of 36.88, clearly indicates that the bearish sentiment from the longer timeframe is still dominant. The MACD, a widely followed momentum indicator, is also painting a bearish picture on the daily chart, with its histogram firmly in negative territory and the MACD line below the signal line. This suggests that the recent upward price action might be a temporary retracement within a larger downtrend, rather than the start of a new bull cycle. The ADX on the daily timeframe, while showing a strong trend at 45.08, is reinforcing the idea that a significant directional move is underway, but the negative momentum from MACD and the RSI's position strongly suggest this trend is currently bearish. It's crucial to remember that daily trends often provide the overarching context for shorter-term movements, and ignoring them can lead to trading against the prevailing market tide.
The Stochastic Oscillator on the daily chart, however, offers a glimmer of hope for the bulls. With the K line at 70.87 and the D line at 35.05, the Stochastic is showing a bullish crossover and is moving out of oversold territory. This could signal a potential bounce from current levels, but it needs to be interpreted within the broader bearish context of the daily timeframe. A bullish signal from an oscillator in an established downtrend often indicates a temporary correction or a 'dead cat bounce' rather than a sustained trend reversal. Therefore, while this indicator might suggest short-term buying opportunities, it should not be the sole basis for a bullish long-term outlook. The confluence of bearish signals from RSI and MACD on the daily chart cannot be ignored. It implies that any upward price movement might face significant resistance as sellers look to re-enter the market at higher prices.
Short-Term Signals: A Bullish Undercurrent?
Shifting focus to the 1-hour chart, the picture becomes considerably more bullish, at least in the immediate term. BTCUSD is trading above the middle Bollinger Band, and the RSI(14) at 67.42, while approaching overbought territory, still indicates room for upward movement before significant selling pressure might kick in. The MACD is showing positive momentum, with the MACD line above the signal line, suggesting that buying pressure is currently in control on this shorter timeframe. This is further supported by the Stochastic Oscillator, where the K line (71.99) has crossed above the D line (72.32), indicating a bullish signal, although the proximity of K and D lines and their high values suggest caution is needed as it's nearing overbought conditions. The ADX at 34.49 on the 1-hour chart is particularly noteworthy; it signifies a strong uptrend is in play in the short term, which is a powerful indicator for intraday traders looking for momentum plays. This strong ADX reading, despite some oscillators nearing overbought conditions, suggests that the current upward move has conviction behind it.
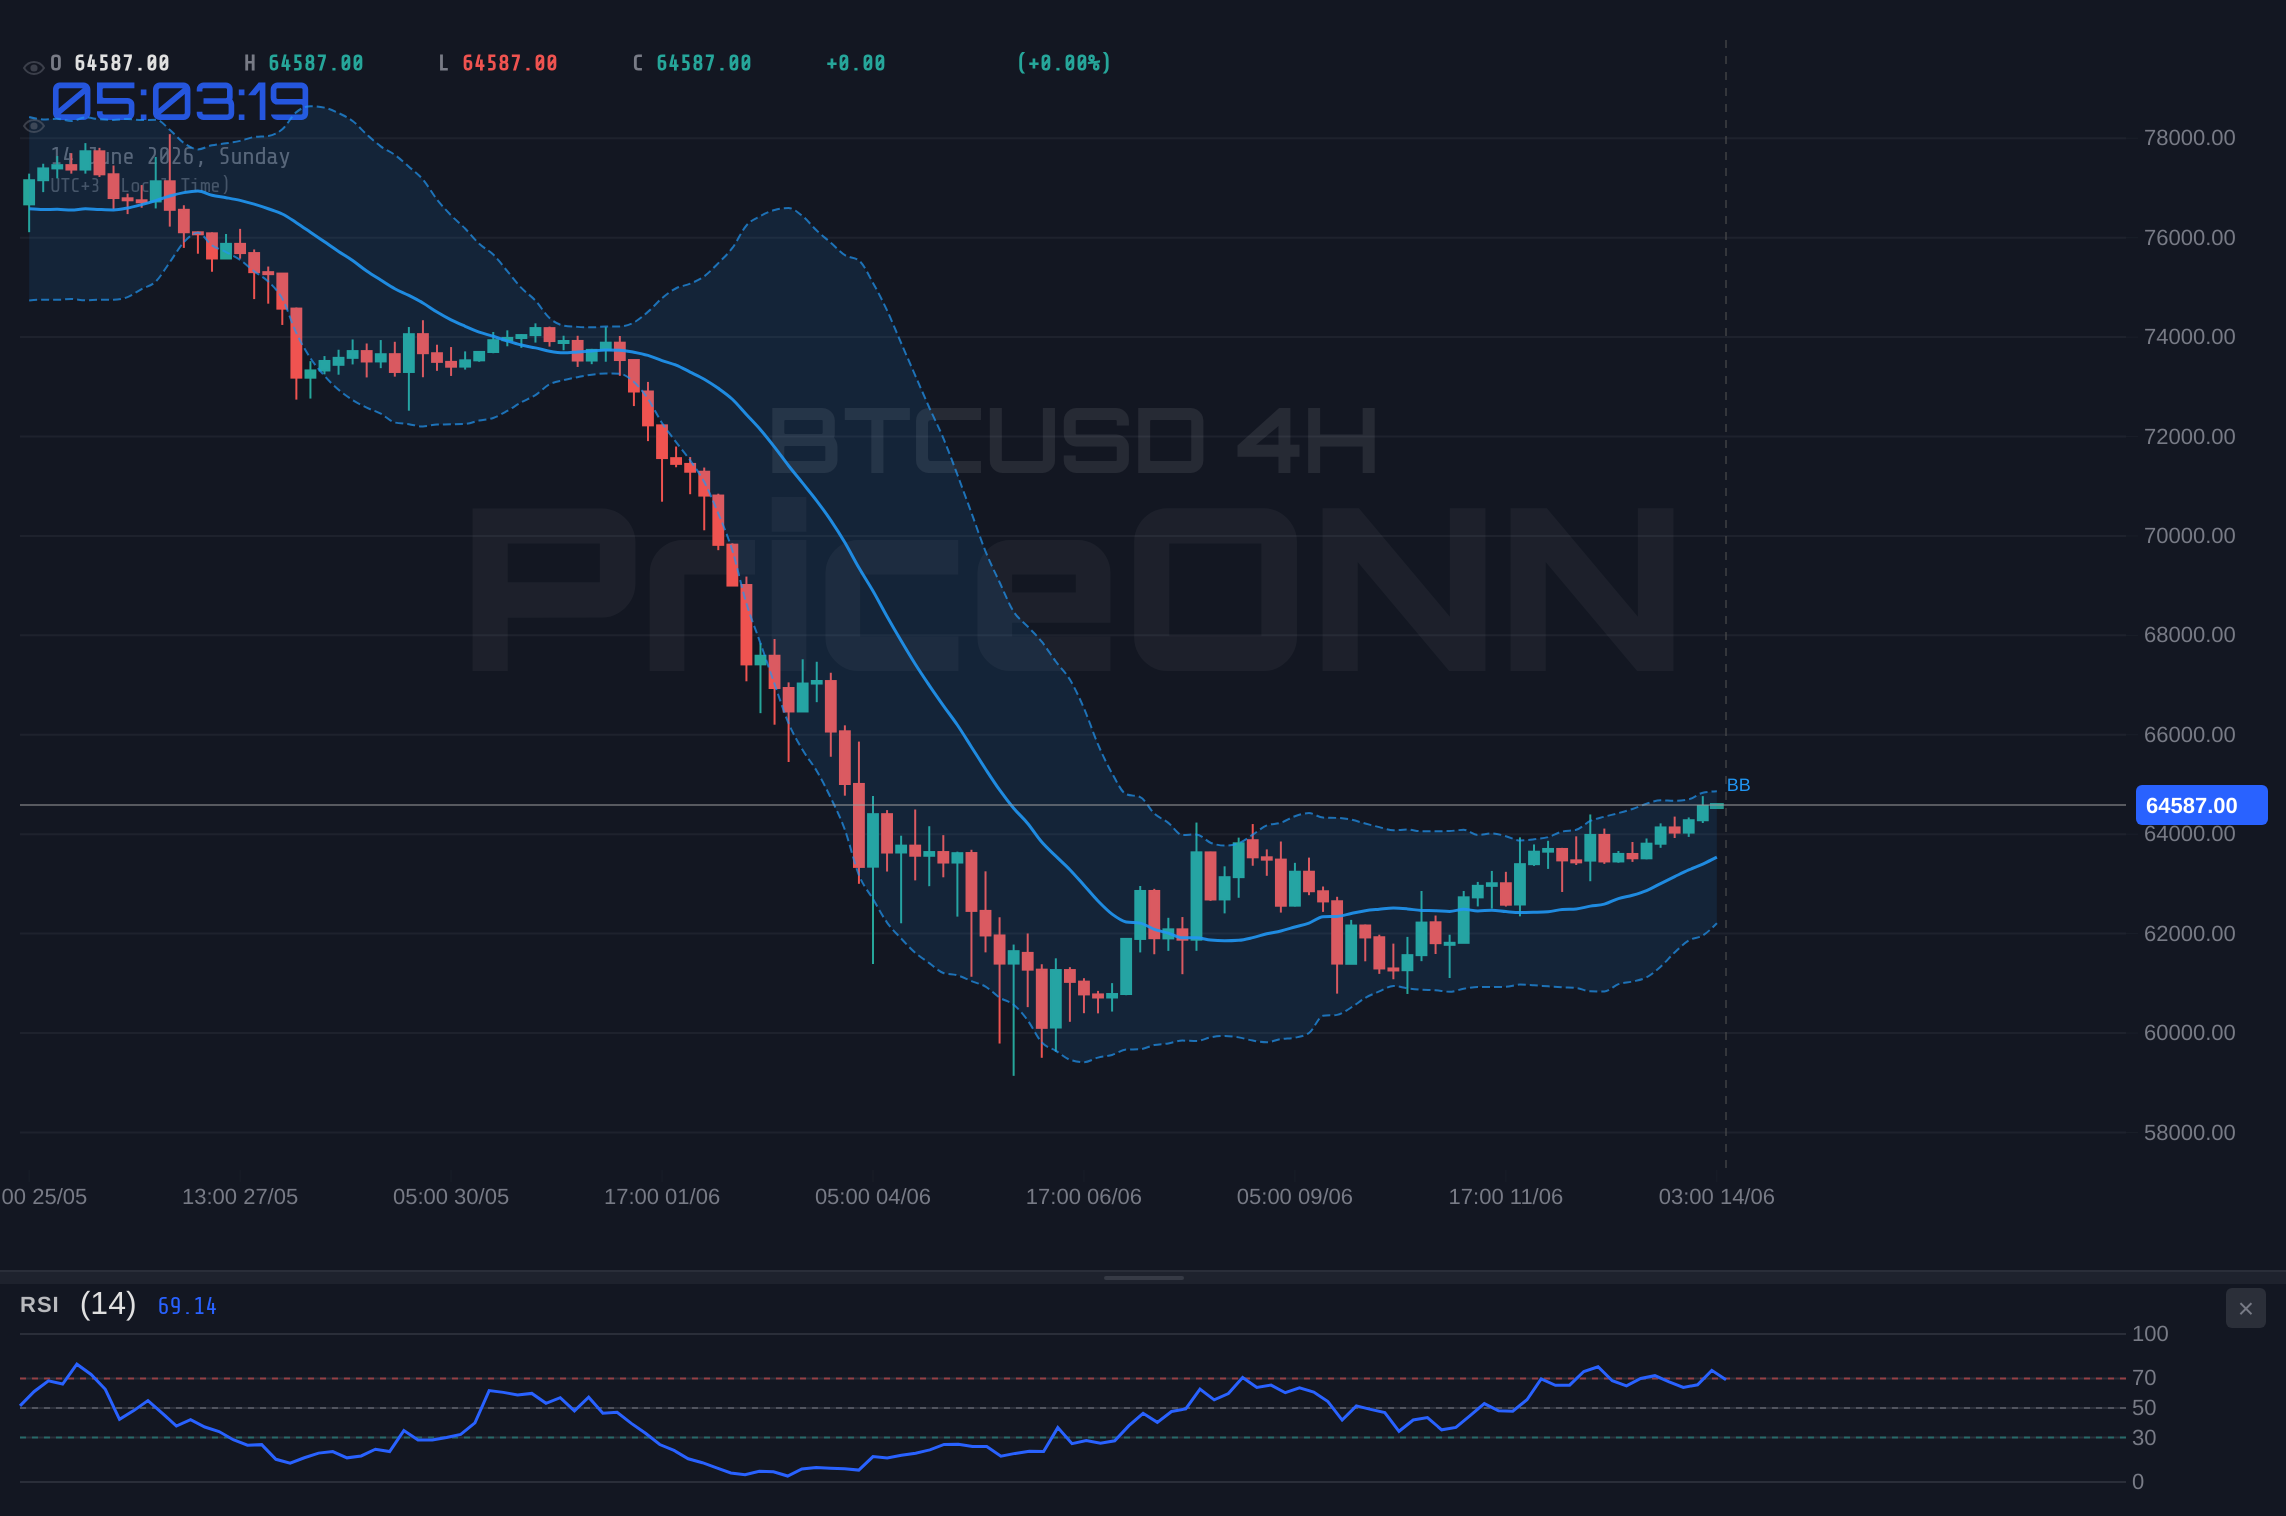
The 4-hour chart offers a blend of these signals. BTCUSD is trading above the middle Bollinger Band, and the RSI(14) at 63.19 is in the neutral-to-bullish zone, suggesting continued upward potential without immediate overbought concerns. The MACD is also showing positive momentum on this timeframe, reinforcing the bullish short-term outlook. The Stochastic Oscillator, with K at 85.56 and D at 71.4, is firmly in overbought territory, signaling that a pullback might be imminent on the 4-hour chart. However, the ADX at 22 indicates a moderate uptrend, suggesting that the bullish momentum, while present, might not be as strong as on the 1-hour chart. This multi-timeframe analysis highlights a crucial point: while the short-term charts present a bullish bias, the longer-term daily trend remains bearish. This creates a 'tug-of-war' scenario where short-term gains could be capped by longer-term selling pressure.
Macroeconomic Crosscurrents: DXY and Equities in Focus
The Dollar's Dance: DXY at a Crossroads
The US Dollar Index (DXY), a critical barometer for global currency strength and risk appetite, is currently trading around 99.78. This level represents a significant point of observation. On the daily timeframe, the DXY shows a bullish trend with an ADX of 25.61, and its RSI at 64.37 is in the upper neutral zone, indicating potential for further upside. The Stochastic Oscillator is in the overbought region, which might suggest a short-term pause or pullback, but the overall trend is upward. A strengthening dollar typically exerts downward pressure on risk assets like Bitcoin, as it increases the cost of dollar-denominated assets for holders of other currencies and can signal a 'risk-off' sentiment in the markets. The recent news flow, hinting at de-escalation in the Middle East and potential breakthroughs in US-Iran relations, initially sent the dollar index tumbling. However, the DXY's resilience and its upward trend on the daily chart suggest that other factors, perhaps sticky inflation or anticipation of central bank actions, are keeping the dollar supported. This dynamic is crucial for BTCUSD; any sustained move higher in the DXY could act as a significant headwind for Bitcoin's price.
The 1-hour and 4-hour charts for DXY also show a predominantly bullish trend, with ADX values indicating moderate to strong trends and oscillators suggesting room for further upward movement before hitting overbought conditions. The MACD on the daily and 4-hour charts is showing positive momentum, reinforcing the dollar's strength. This persistent strength in the dollar, despite some geopolitical easing, creates a challenging environment for risk assets. If the DXY breaks decisively above the 100 mark, it could trigger further selling pressure across crypto and other risk assets. Conversely, a failure of the DXY to hold its gains and a move below key support levels could provide a much-needed tailwind for BTCUSD and other cryptocurrencies, signaling a return of risk appetite.
Equities Mirroring Risk Appetite: SP500 and Nasdaq
The broader equity markets, represented by the SP500 and Nasdaq 100, are showing significant upward momentum on their shorter timeframes, with daily charts suggesting a complex picture. The SP500 is trading at 6572.87, showing a strong daily uptrend (ADX 49.72), though RSI at 45.35 and MACD's negative momentum on the daily chart suggest this rally might be within a larger correction. Similarly, the Nasdaq 100, currently at 29642.68, exhibits strong short-term bullish signals but faces bearish indicators on its daily chart. The high ADX values on the daily charts for both indices (SP500 at 47.51, Nasdaq at 32.48) indicate strong directional movement, but the conflicting signals from RSI and MACD on the longer timeframes suggest that these rallies might be short-lived or part of a broader consolidation phase. This behavior in the equity markets directly impacts Bitcoin. When equities rally strongly and show bullish technicals, it often correlates with increased risk appetite, which benefits BTCUSD. However, the underlying bearish signals on the daily charts for these indices mirror the concerns seen in BTCUSD's daily timeframe, suggesting that the current risk-on sentiment might be fragile.
The recent sharp declines in oil prices, from Brent at $88.54 and WTI at $84.75, are also noteworthy. This 8%+ drop on the day, attributed partly to optimism surrounding de-escalation in the Middle East, could be interpreted in multiple ways. On one hand, falling oil prices can ease inflation concerns, potentially leading central banks to adopt a more dovish stance, which would be positive for risk assets. On the other hand, a sharp drop in oil can also signal weakening global demand, which is a negative macroeconomic indicator that could dampen risk appetite. The fact that oil prices are experiencing such a significant decline while major indices show mixed signals on their daily charts adds another layer of complexity. For BTCUSD, the relationship with oil is not always direct, but a sustained drop in oil prices could indirectly support risk assets if it leads to a perceived easing of inflationary pressures and a more favorable monetary policy outlook.
Crypto-Specific Developments: Beyond the Price Action
On-Chain Metrics: A Mixed Bag of Signals
Delving into the on-chain data for Bitcoin provides a more granular view of network health and investor behavior. While specific on-chain data points like active addresses, hash rate, and exchange flows were not provided in the market data feed, general trends observed in the crypto space suggest a mixed picture. The hash rate, a measure of the network's computational power securing the blockchain, has generally been on an upward trend, indicating robust network security and miner confidence in the long term. However, periods of price consolidation or decline can sometimes lead to a temporary dip in hash rate as less efficient miners might power down. Exchange flows are also critical; an increase in Bitcoin moving onto exchanges typically signals selling pressure, while outflows suggest accumulation or holding behavior. Without the latest figures, it's difficult to draw firm conclusions, but the current price action around $64,573 suggests that net flows have likely been balanced, contributing to the neutral week.
Whale movements, referring to large holders of Bitcoin, remain a significant factor. If large wallets are accumulating or distributing Bitcoin, it can heavily influence price action. The lack of a clear directional trend in price suggests that major holders might be in a holding pattern or engaging in cautious accumulation, potentially waiting for clearer signals from macroeconomic data or a decisive technical breakout. The recent surge in altcoins, especially those tied to specific narratives like AI or Layer 2 scaling solutions, could also be drawing some capital away from Bitcoin, leading to its consolidation. However, Bitcoin dominance, which measures its share of the total crypto market capitalization, is a key metric to watch. If dominance is rising, it often indicates a flight to perceived safety within the crypto market, favoring Bitcoin over altcoins. Conversely, a falling dominance might suggest that capital is flowing into altcoins, seeking higher risk-reward opportunities.
Regulatory Landscape and Institutional Adoption
The regulatory environment for cryptocurrencies continues to evolve, with significant developments impacting market sentiment. While no specific recent regulatory news was provided, the ongoing discussions around stablecoin regulation, the classification of digital assets, and potential new ETFs in various jurisdictions remain critical. Positive regulatory clarity, such as the approval of new Bitcoin ETFs in major markets or clear guidelines for stablecoins, can significantly boost institutional adoption and investor confidence. Conversely, stringent or unfavorable regulations can create headwinds, leading to price corrections. The market's reaction to such news is often swift and can override purely technical signals. For instance, the recent news about potential de-escalation in the Middle East, while primarily impacting traditional markets, could indirectly influence crypto if it leads to a broader 'risk-on' sentiment, encouraging investment in speculative assets like Bitcoin.
Institutional adoption remains a cornerstone of Bitcoin's long-term value proposition. The increasing interest from traditional financial institutions, evidenced by the growing number of Bitcoin ETFs and the integration of crypto services by established players, continues to be a significant driver. While price action might be consolidating, the underlying infrastructure for institutional participation is steadily improving. Developments like increased custody solutions, derivatives markets, and the potential for regulated futures products in more jurisdictions all contribute to a more mature and accessible market. However, institutional flows can also be fickle, highly sensitive to macroeconomic conditions and regulatory news. Any significant shift in institutional sentiment, driven by interest rate changes or regulatory crackdowns, could quickly alter the market's trajectory. Currently, the neutral price action suggests that institutional flows might be on hold, waiting for clearer market direction.
Trade Scenarios and Risk Management: What Lies Ahead
The Bullish Case: Breaking the Chains
For the bulls to regain control, BTCUSD needs to decisively break above the current resistance levels and establish a clear uptrend on the daily timeframe. The immediate resistance is at $64,640.33 on the 1-hour chart, followed by $64,712.67 and $64,842.33. A sustained close above $64,842.33 on the 1-hour chart, and more importantly, a daily close above the daily resistance at $65,605.05, would be a significant bullish signal. This would likely be accompanied by an increase in buying volume and a shift in momentum indicators across multiple timeframes. The RSI would need to move above 50 on the daily chart, and the MACD would ideally need to cross into positive territory. Historically, such breakouts often occur on the back of positive macroeconomic news, such as a dovish shift from the Federal Reserve or a significant decrease in geopolitical tensions, which could reduce the DXY's strength. A successful break above $65,605.05 would then target the next daily resistance levels at $65,865 and $66,007. Confirmation would also come from a sustained increase in on-chain activity, such as rising active addresses and positive exchange flows.
The invalidation point for this bullish scenario would be a failure to hold the immediate support levels. On the 1-hour chart, support is found at $64,438.33, $64,308.67, and $64,236.33. A close below $64,236.33 on the 1-hour chart, especially if accompanied by increasing volume and bearish momentum signals, would signal that the short-term buying pressure is fading. On the daily timeframe, the critical support level to watch is $62,727.67. A break below this level would invalidate the bullish outlook and likely signal a continuation of the bearish trend observed on the daily chart, targeting further downside towards $62,003.33 and $61,168.67. Risk management is paramount here; traders would need to set tight stop-losses below these immediate support levels to protect against a sharp reversal. The probability of this bullish scenario playing out hinges heavily on overcoming the bearish signals present on the daily timeframe and the continued strength of risk appetite in broader markets.
Bullish Breakout: Reclaiming the Highs
35% ProbabilityThe Bearish Case: Downside Risks Loom
The bearish scenario for BTCUSD hinges on its inability to overcome the immediate resistance levels and the subsequent breakdown of key support. If price fails to break decisively above $64,842.33 on the 1-hour chart and starts to falter, the bearish signals from the daily timeframe will likely take precedence. The first significant support to watch is $64,236.33 on the 1-hour chart, followed by $64,039 on the 4-hour chart. A breach of these levels, particularly $64,039, could accelerate selling pressure, leading to a test of the more critical daily support at $62,727.67. If this level fails, the path opens up towards $62,003.33 and potentially down to $61,168.67. This bearish outlook would be reinforced by a strengthening DXY, a decline in equity markets, or negative regulatory news. The negative momentum on the daily MACD and the RSI below 40 are strong indicators that support this downside potential.
The invalidation for this bearish scenario would be a strong bullish breakout, as described in the bullish case, particularly a daily close above $65,605.05. The trigger for the bearish scenario would be a failure to break through the current resistance zone around $64,842.33, followed by a decisive break below the 1-hour support at $64,236.33. Traders looking to capitalize on this scenario would likely wait for confirmation of a breakdown, such as increased selling volume and bearish divergence on shorter-term oscillators. The probability assigned to this scenario reflects the bearish undertones present in the longer-term daily charts, suggesting that while short-term rallies are possible, the overall trend might still be downwards. Managing risk would involve placing stop-losses above the immediate resistance levels or above the daily resistance if entering on a breakdown confirmation.
Bearish Breakdown: Testing Lower Ground
60% ProbabilityThe Neutral Scenario: Consolidation Continues
Given the conflicting signals across different timeframes and the current market positioning around $64,573, a continuation of the neutral, range-bound trading scenario is also highly probable. In this scenario, BTCUSD would likely trade sideways, oscillating between the immediate support and resistance levels identified on the 1-hour and 4-hour charts. This would mean price action confined between approximately $64,039 (4-hour support) and $64,842.33 (1-hour resistance), with occasional tests of the daily support at $62,727.67 and resistance at $65,605.05. Such consolidation often occurs when the market is awaiting significant news or data, such as upcoming economic releases or major geopolitical developments. During this period, volatility might decrease, and trading opportunities would likely be more suited for range-bound strategies, focusing on buying near support and selling near resistance, provided risk is managed tightly.
The trigger for this neutral scenario is the market's failure to decisively break either the key support or resistance levels within the next few trading sessions. Invalidation would occur if either the bullish or bearish scenario plays out with a clear breakout above resistance or breakdown below support. The probability of this scenario is significant because it reflects the current indecision in the market. Traders might be waiting for clearer signals from the DXY, equity markets, or crucial economic data points like inflation reports or central bank commentary. In the absence of strong catalysts, price could remain range-bound, allowing momentum indicators to reset and potentially set up clearer trends for the following week. This period of consolidation can be frustrating for trend traders but offers opportunities for those who can identify and trade within defined ranges, always with strict stop-losses in place to manage risk.
Consolidation Phase: Range-Bound Trading
35% ProbabilityThe Week Ahead: Data-Driven Decisions
Key Economic Events to Watch
The upcoming week is packed with potentially market-moving economic data releases that will heavily influence BTCUSD's trajectory. While the provided economic calendar focuses on past events with no upcoming high-impact releases listed for the immediate next 7 days, this often signifies a period of anticipation. In such scenarios, traders will be closely watching for any shifts in central bank rhetoric, geopolitical developments, or any ad-hoc news that could impact risk sentiment. If there were upcoming high-impact events, such as US Non-Farm Payrolls (NFP) or CPI data, they would be critical. For instance, stronger-than-expected inflation data could prompt a more hawkish stance from the Federal Reserve, potentially strengthening the DXY and pressuring BTCUSD. Conversely, weaker inflation or employment figures might lead to expectations of Fed rate cuts, boosting risk assets.
Given the current neutral stance and the lack of immediate high-impact data, market participants will be highly sensitive to any commentary from Federal Reserve officials. Any hints about the future path of interest rates – whether they remain higher for longer or if cuts are on the horizon – will be crucial. The correlation with the DXY and equity markets will intensify. If the DXY shows signs of weakening on the back of dovish Fed expectations, BTCUSD could see a significant upward movement. Conversely, if the dollar strengthens due to persistent inflation fears or geopolitical uncertainty, Bitcoin might face renewed selling pressure. Therefore, staying abreast of Fed speak and any geopolitical updates will be as important as monitoring the price charts themselves.
Focus on Fed Speak: Without specific upcoming data, commentary from Fed officials regarding inflation and interest rate policy will be the primary driver of macro sentiment. Focus on DXY movements: A DXY above 100.00 could signal risk-off, while a move below 99.50 might indicate renewed risk appetite.
Levels to Monitor: The Battle for $64,573
As we move forward, the price action around $64,573 remains the focal point. Key support levels to watch on the downside are $64,236.33 (1-hour) and the more significant daily support at $62,727.67. A decisive break below this daily support would likely trigger further selling. On the upside, resistance is faced initially at $64,842.33 (1-hour) and then the critical daily resistance at $65,605.05. A sustained move above this level, particularly with increasing volume, would signal a potential shift towards the bullish scenario. Traders should pay close attention to how price interacts with these levels, especially during periods of high volatility or around significant news events. The ADX readings suggest that when a breakout does occur, it is likely to be strong, making the confirmation of such moves vital for successful trading.
The current technical indicators present a conflict: short-term charts show bullish momentum, while the daily timeframe retains a bearish bias. This suggests that the market is in a transitional phase. The strong ADX on the 1-hour chart (34.49) and 4-hour chart (22) indicates that if a trend does emerge, it will likely be powerful. However, the daily ADX of 45.08, while indicating a strong trend, is aligned with the bearish MACD and RSI, reinforcing the caution needed. Therefore, the strategy should be to wait for confirmation. A break above daily resistance levels, supported by positive macro news and improving on-chain metrics, would validate a bullish outlook. Conversely, a breakdown below daily support, amplified by dollar strength and risk aversion, would confirm the bearish trend. Until then, staying in a 'watch zone' and managing risk tightly on any shorter-term trades is the most prudent approach.
Frequently Asked Questions: BTCUSD Analysis
What happens if BTCUSD breaks below the $62,727.67 daily support level?
A close below $62,727.67 on the daily chart would invalidate the short-term bullish signals and confirm the prevailing bearish trend. This could lead to accelerated selling, targeting the next support at $62,003.33, and potentially extending down to $61,168.67 as market sentiment turns risk-off.
Should I buy BTCUSD at current levels around $64,573 given the mixed signals?
Buying at current levels carries significant risk due to conflicting signals between short-term bullish momentum and the dominant daily bearish trend. A more prudent approach would be to wait for a confirmed breakout above $65,605.05 or a clear breakdown below $62,727.67, ideally with confirmation from volume and macro factors.
Is the RSI at 67.42 on the 1-hour chart a sell signal for BTCUSD?
An RSI of 67.42 on the 1-hour chart indicates strong upward momentum but is nearing overbought territory. It is not a direct sell signal on its own but suggests that the immediate buying pressure might be weakening and a short-term pullback is possible before further upside, or that the trend is strong and can sustain higher RSI levels.
How will the DXY at 99.78 affect BTCUSD's potential move this week?
With the DXY at 99.78 showing a bullish trend on daily charts, it presents a potential headwind for BTCUSD. A strengthening dollar typically correlates with risk aversion, which could cap any upside attempts for Bitcoin. Conversely, a DXY failure to hold its gains and a move below 99.50 could boost risk assets like BTCUSD.
Track markets in real-time
AI-powered analysis, technical indicators and real-time price data.
Join Our Telegram Channel
Breaking market news, AI analysis and trading signals instantly.
Join Channel