The cryptocurrency market is navigating a complex landscape, with Ether (ETHUSD) currently finding itself at a crucial juncture, trading near $1,652.88. This price point is being tested as inflation fears resurface, driving demand for safe-haven assets and strengthening the US Dollar Index (DXY). The interplay between macroeconomic pressures and crypto-specific dynamics presents a challenging environment for traders and investors alike. Understanding the current market cycle, particularly the influence of broader financial market trends on digital assets, is paramount for making informed decisions. As we delve into the current data, it's clear that ETHUSD's trajectory hinges on its ability to hold key support levels amidst persistent headwinds.
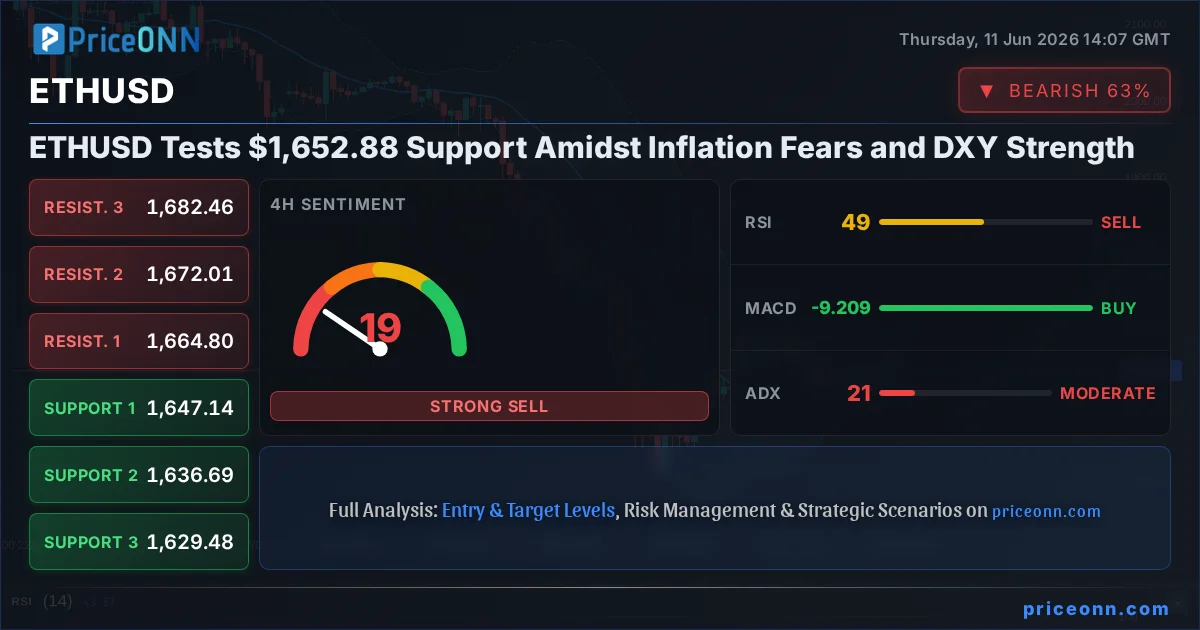
- ETHUSD is currently trading at $1,652.88, testing significant support levels.
- The Dollar Index (DXY) is strengthening, currently at 99.9, exerting downward pressure on risk assets like ETHUSD.
- Gold prices are declining, trading at $4,077.72, indicating a shift towards risk-off sentiment.
- On the 4-hour chart, ETHUSD shows a strong bearish trend (ADX: 49.83), with RSI at 20.77 signalling oversold conditions.
- Key support for ETHUSD is identified at $1,636.69, while resistance looms at $1,664.80.
The current market sentiment appears to be heavily influenced by macroeconomic factors, particularly inflation data and central bank policy expectations. The recent news highlighting a potential increase in US headline inflation to a three-year high in May, coupled with the European Central Bank's (ECB) decision to hike interest rates and revise inflation forecasts upwards, paints a picture of persistent price pressures globally. This environment typically favors a stronger dollar, as seen with the DXY currently trading around 99.9, and puts pressure on riskier assets such as cryptocurrencies and even gold, which has seen a significant daily drop of -4.26% to $4,077.72. The correlation between DXY strength and ETHUSD weakness is a pattern traders are closely watching.
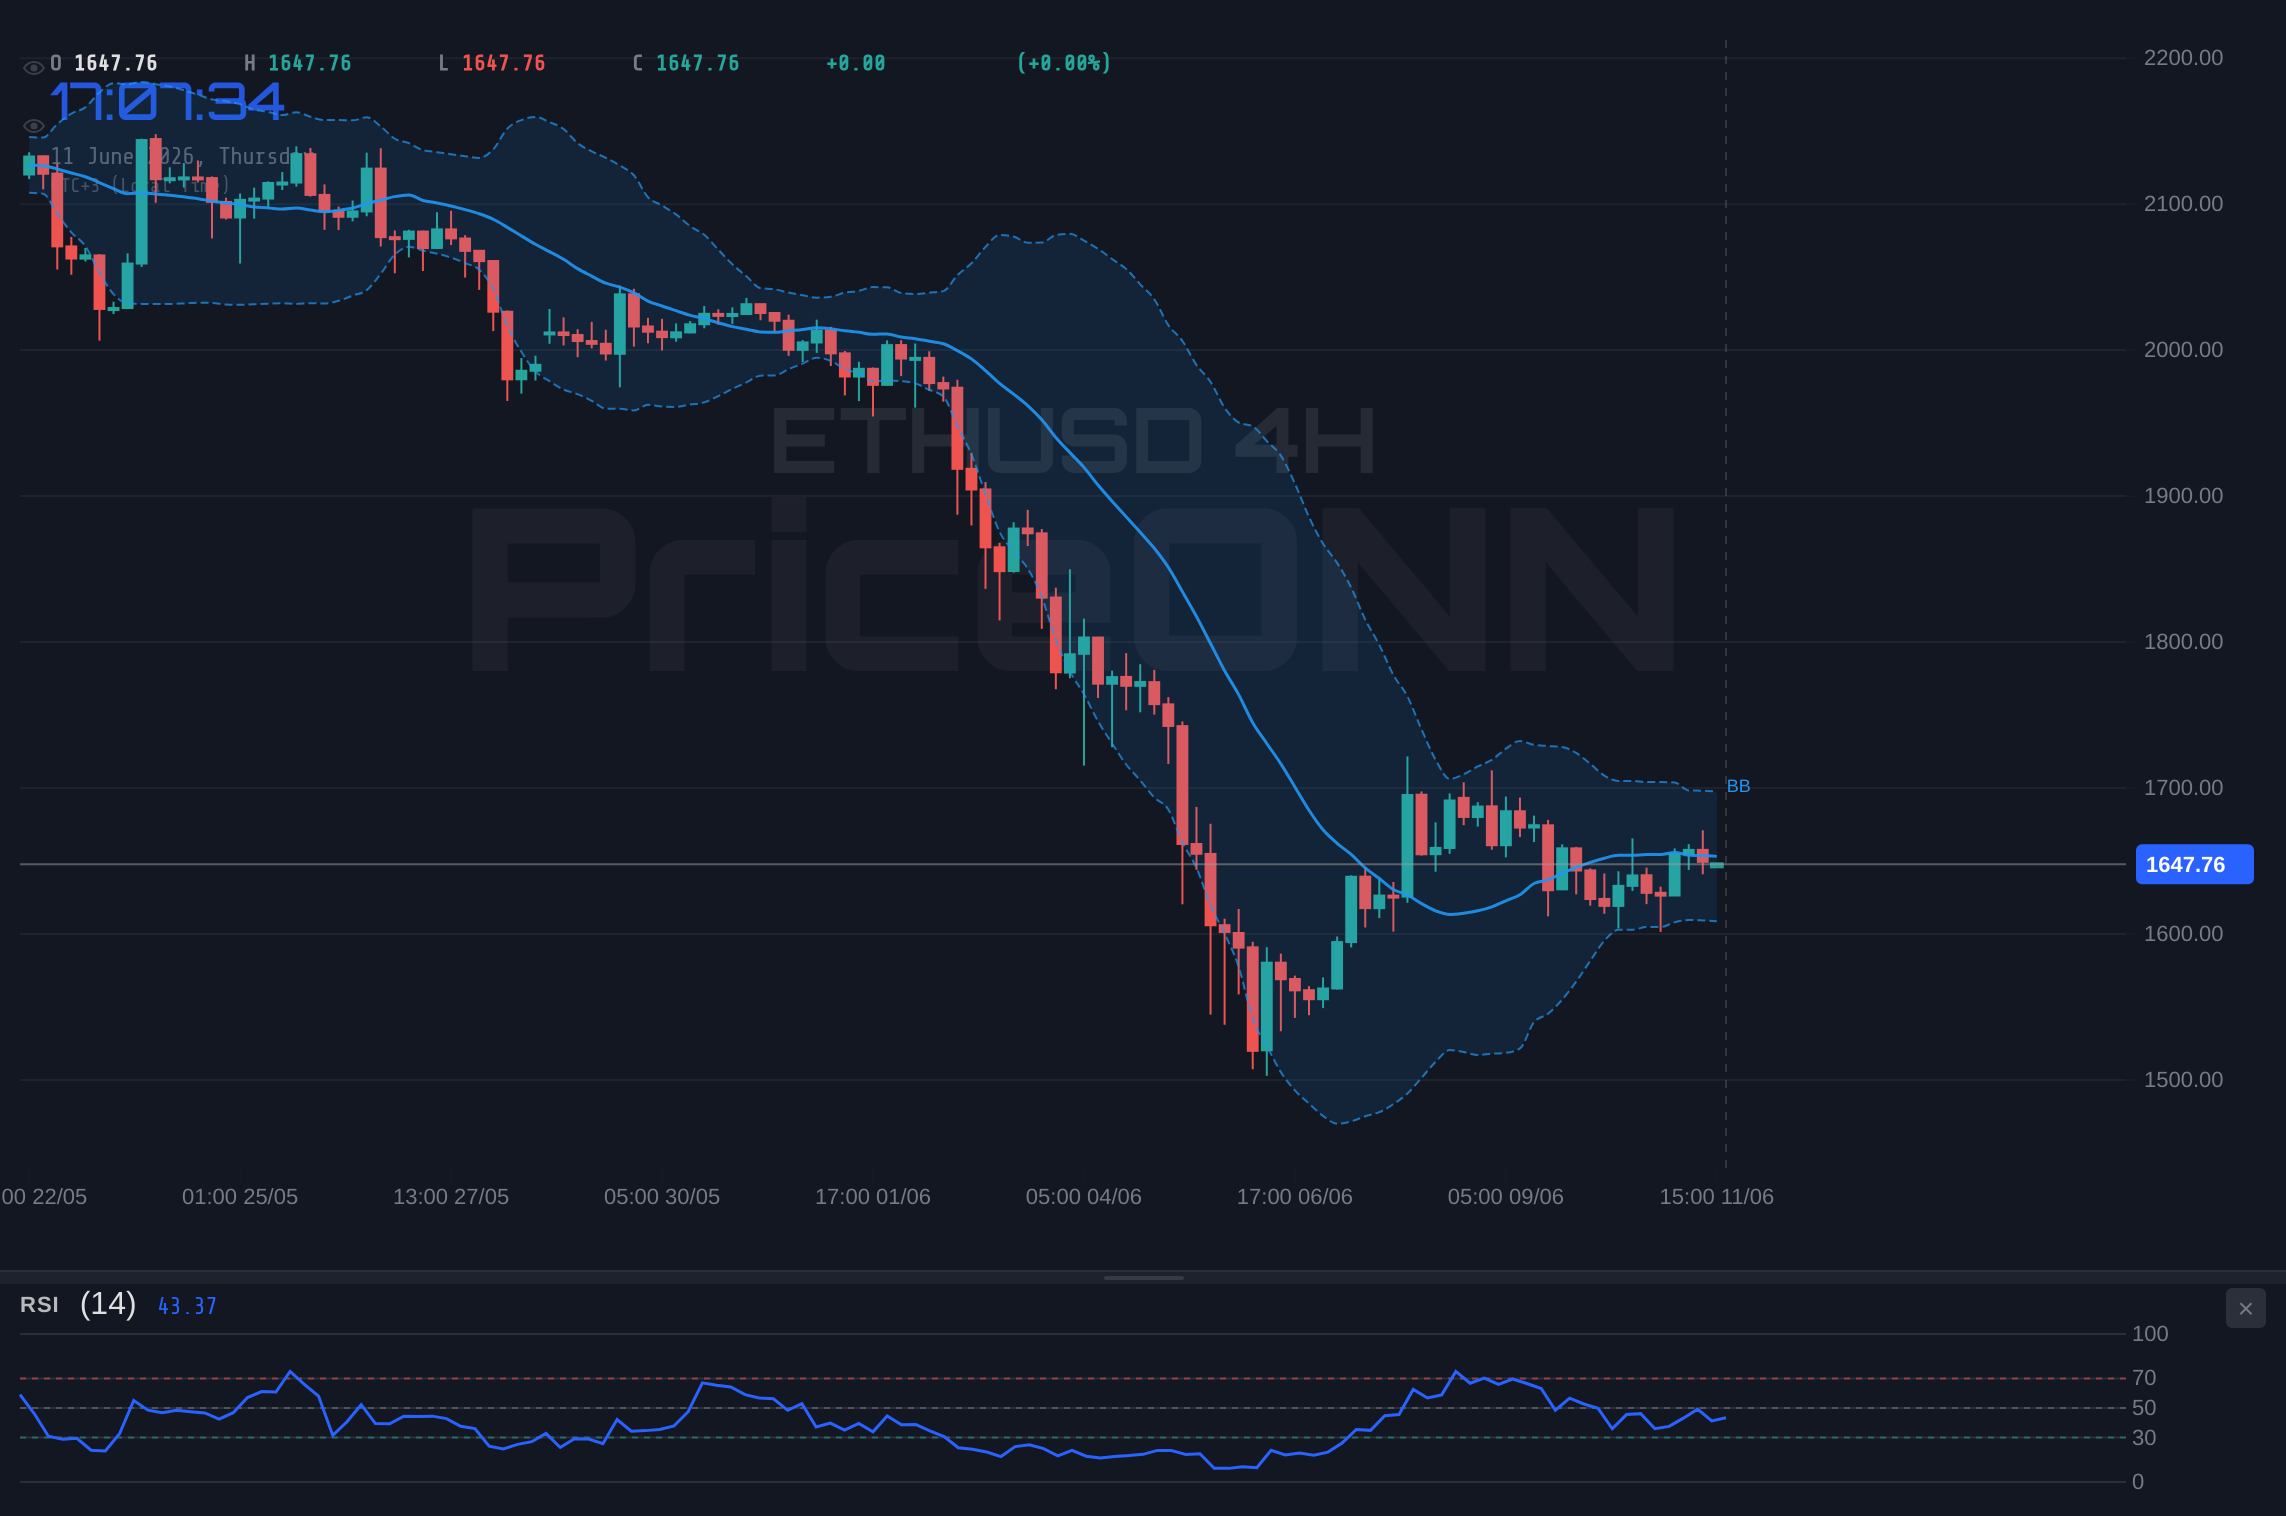
From a technical standpoint, the 4-hour chart for ETHUSD presents a predominantly bearish outlook, with the ADX indicator at a strong 49.83, signaling a robust downward trend. The Relative Strength Index (RSI) is deeply in oversold territory at 20.77, suggesting that while the selling pressure is intense, there might be a potential for a short-term bounce. However, the MACD remains below its signal line with negative momentum, reinforcing the bearish bias. Bollinger Bands are also trading below the middle band, indicating downward price action. This confluence of indicators on the 4-hour timeframe suggests that caution is warranted, and any upward movements could be met with selling pressure unless significant shifts occur.
Digging deeper into the hourly timeframe, the picture for ETHUSD is slightly less bearish but still cautionary. The trend is neutral with moderate strength (50%), and the RSI is at 39.19, comfortably within neutral territory but showing a downward inclination. The MACD shows positive momentum, with the MACD line above its signal line, which could hint at a temporary reprieve or a potential short-term upward correction. However, the Stochastic indicator is signaling a bearish move (%K
Navigating the Current Support and Resistance Levels
The Critical $1,636.69 Support Zone
On the 4-hour chart, the first significant support level for ETHUSD is identified at $1,636.69. This level has been a battleground, and its resilience is crucial for the bulls. A sustained break below this point could trigger further downside, potentially targeting the next support at $1,629.48. The daily chart also highlights substantial support zones, with the immediate one at $1,609.84. However, the strength of the current downtrend, as indicated by the ADX on the daily chart at 45.68, means that breaking these lower support levels could lead to sharper declines. Traders are watching closely to see if the oversold RSI (29.48 on daily) can provide enough impetus for a bounce from these lower price points.
The current downtrend's intensity is undeniable. The daily chart shows a strong bearish trend with an ADX of 45.68. This suggests that momentum is firmly in the hands of the sellers. The RSI at 29.48 is deeply oversold, a condition that historically has preceded bounces in ETHUSD. However, the MACD remains negative, and the Stochastic %K line is below %D, reinforcing the bearish sentiment. The Bollinger Bands are trading below the middle band, indicating a bearish bias. It's this conflict between the oversold RSI and the persistent bearish momentum that creates a tense trading environment. A break below the $1,609.84 support on the daily chart would invalidate any immediate hopes for a recovery and could signal a move towards even lower price levels, potentially targeting $1,560.98.
Resistance Above $1,664.80
On the upside, the immediate resistance for ETHUSD on the 4-hour chart is located at $1,664.80. A decisive move above this level, coupled with increasing volume and positive shifts in momentum indicators, would be the first sign of a potential trend reversal. The hourly chart presents resistance at $1,662.47, followed by $1,675.49. For a sustainable recovery, ETHUSD would need to convincingly break through these levels and hold them as support. The daily resistance is further up, starting at $1,670.98. The current market conditions, characterized by a strong DXY and inflation concerns, make breaking these resistance levels a formidable challenge for Ether.
The broader market context, including the performance of major indices like the S&P 500 and Nasdaq, also plays a role. The S&P 500 is showing mixed signals, with a strong 1H trend but a bearish daily outlook. The Nasdaq is also showing a bearish daily trend. This suggests that the general risk appetite in the market is subdued, which typically does not bode well for riskier assets like cryptocurrencies. The correlation with DXY is particularly noteworthy; as the dollar strengthens around 99.9, assets like ETHUSD often come under pressure. This dynamic reinforces the idea that breaking higher resistance levels will require not only crypto-specific positive catalysts but also a shift in the broader macroeconomic sentiment.
The Impact of Macroeconomic Factors on ETHUSD
The recent economic data releases are casting a long shadow over the markets. The reported increase in US headline inflation to a three-year high, meeting forecasts, is a significant development. This suggests that inflationary pressures are not abating as quickly as some might have hoped, potentially influencing future monetary policy decisions by the Federal Reserve. While the Fed's next move isn't immediately clear from the provided data, persistent inflation often leads to tighter monetary policy, which can be a headwind for growth assets like ETHUSD. The DXY's current level at 99.9, showing a daily increase of 0.19%, reflects this strengthening dollar sentiment, as traders price in potential hawkish responses to inflation.
The European Central Bank's (ECB) actions also add another layer of complexity. Their decision to hike interest rates and revise inflation forecasts upwards, while cutting growth outlooks, highlights a similar concern about inflation in the Eurozone. This could lead to a more hawkish stance from the ECB, potentially affecting the EURUSD pair, which is currently trading at 1.15272 and showing a daily decline. The interconnectedness of global economies means that policy decisions and inflation data from major economic blocs like the US and Eurozone have ripple effects across all asset classes, including Ether. The current chart signals for EURUSD are predominantly 'SAT', indicating weakness in the Euro against the dollar.
Gold's performance is another bellwether for market sentiment. The sharp decline in XAUUSD, trading at $4,077.72 with a daily drop of -4.26%, is a classic indicator of a risk-off environment. When inflation fears rise and the dollar strengthens, investors often flee to perceived safe-haven assets like the dollar itself, and sometimes gold, but the current data shows gold losing ground. This suggests that the flight to safety is primarily favoring the US dollar at this moment, which is a negative sign for ETHUSD. The correlation between gold's price action and ETHUSD's moves is something to monitor; a continued slide in gold could foreshadow further weakness in Ether.
Crypto-Specific Developments and Their Influence
While macroeconomic factors are currently dominating the narrative, it's essential to consider crypto-specific developments. The provided data does not include specific on-chain metrics or DeFi/NFT ecosystem news for ETHUSD. However, in a broader context, the health of the Ethereum network, including metrics like active addresses, transaction volume, and Total Value Locked (TVL) in DeFi protocols, plays a crucial role in Ether's long-term valuation. Developments in Layer 2 scaling solutions, the success of upcoming network upgrades, and shifts in staking yields can all influence investor sentiment and capital flows into the Ethereum ecosystem.
Regulatory news is another critical factor that can significantly impact cryptocurrency prices. Any news regarding regulatory clarity or crackdowns in major jurisdictions can trigger sharp price movements. For instance, shifts in the US regulatory stance towards digital assets, or developments in the approval of Ether-based financial products, could sway institutional and retail investor interest. Without specific recent news on this front, it's challenging to incorporate it directly, but it remains a background risk that can quickly alter the market's complexion. The general trend of increasing institutional adoption, while a long-term positive, can be overshadowed by short-term macro concerns.
Bitcoin's price action often serves as a leading indicator for the broader altcoin market, including Ether. Currently, BTCUSD is trading at $63,055, showing a daily increase of 1.43%. While this might seem positive, the daily chart still indicates a strong bearish trend (ADX 45.68) with oversold conditions (RSI 29.48). The divergence between Bitcoin's slight recovery and Ether's struggle at support levels warrants attention. Typically, a strong recovery in Bitcoin can lift altcoins, but if Bitcoin fails to sustain its gains or breaks its own support levels, it could drag Ether down with it. The current signals for BTCUSD on the daily are SAT, indicating bearish pressure despite the intraday move.
Trade Scenarios for ETHUSD
Bearish Scenario: Downside Continuation
65% ProbabilityNeutral Scenario: Consolidation and Range-Bound Trading
25% ProbabilityBullish Scenario: Bounce from Oversold Conditions
10% ProbabilityGiven the current technical indicators and macroeconomic pressures, the outlook for ETHUSD is predominantly bearish. While oversold conditions on longer timeframes suggest a potential for a bounce, the strong trend strength and negative momentum across multiple timeframes indicate that the risk of further downside is currently higher. A WATCH_ZONE approach is recommended. Traders should look for a clear catalyst or a confirmed break of key levels before committing to a position. Specifically, a daily close above $1,675.49 would be needed to invalidate the bearish thesis and open doors for a more significant recovery. Conversely, a break below $1,636.69 could signal a continuation of the downtrend, presenting a potential shorting opportunity with defined risk management.
Frequently Asked Questions: ETHUSD Analysis
What happens if ETHUSD breaks below the $1,636.69 support level?
A break below the $1,636.69 support on the 4-hour chart would invalidate the current consolidation and likely trigger further selling pressure. This could lead to a test of the next significant daily support at $1,609.84, given the strong bearish trend indicated by the ADX at 45.68.
Should I consider buying ETHUSD at current levels around $1,652.88 given the oversold RSI?
While the RSI at 20.77 on the 4-hour chart signals oversold conditions, the overall bearish momentum and strong trend (ADX 49.83) suggest caution. A high-probability setup would require confirmation, such as a daily close above $1,664.80 resistance, before considering a long position.
Is the MACD signal at -15.20 a strong sell indicator for ETHUSD?
A negative MACD reading, especially when below the signal line and with a histogram like -15.20, confirms bearish momentum. On the 4-hour chart, this reinforces the downtrend, suggesting that selling pressure is dominant and any upward moves might face resistance.
How will the recent inflation data and ECB rate hike affect ETHUSD this week?
The elevated inflation data and ECB rate hike contribute to a risk-off environment, strengthening the DXY to 99.9. This macro backdrop typically pressures assets like ETHUSD, potentially capping any upside attempts and increasing the likelihood of testing lower support levels around $1,636.69.
The path forward for ETHUSD remains heavily contingent on the interplay between persistent inflation concerns, central bank policies, and overall market risk appetite. While oversold conditions offer a glimmer of hope for a technical bounce, the prevailing bearish trend strength and macroeconomic headwinds suggest that significant upside may be limited in the short term. Traders are advised to maintain a disciplined approach, manage risk meticulously, and wait for clear signals before entering positions. The market always provides second chances, and patience will likely be rewarded by waiting for a more favorable risk/reward setup.
Track markets in real-time
AI-powered analysis, technical indicators and real-time price data.
Join Our Telegram Channel
Breaking market news, AI analysis and trading signals instantly.
Join Channel