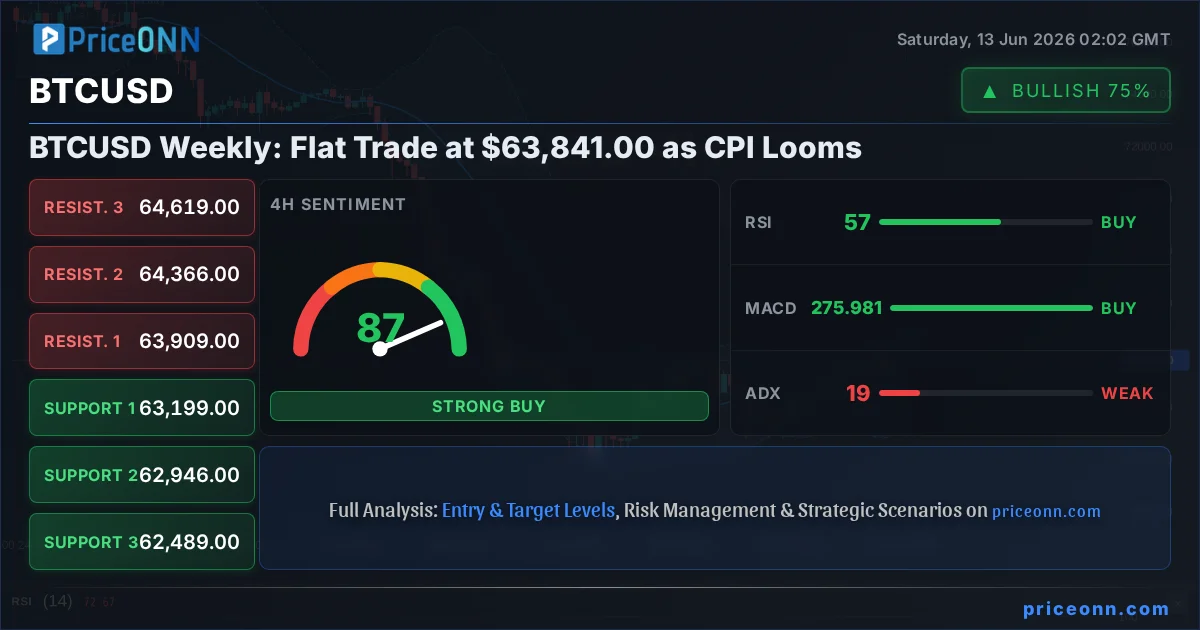
As the dust settles from another volatile week, Bitcoin finds itself in a delicate dance around the $63,841.00 mark. This isn't just another weekend consolidation; it's a tense holding pattern preceding a crucial economic data release that could dictate the next directional move. The bulls and bears are locked in a stalemate, each waiting for a catalyst to break the deadlock. With the Consumer Price Index (CPI) data on the horizon, the market sentiment is a cocktail of anticipation and caution. This week's analysis dives deep into the on-chain metrics, technical patterns, and macroeconomic undercurrents shaping the BTCUSD landscape, exploring what the $63,841.00 level truly signifies in this current market cycle.
- RSI at 33.79 on the daily chart signals significant oversold conditions, potentially indicating a bottoming phase.
- Critical support sits at $61,690.67, a level that has acted as a psychological and technical barrier multiple times.
- The MACD histogram shows negative momentum, suggesting bearish pressure is still present, despite the daily RSI readings.
- The correlation between BTCUSD and the DXY at 99.8 suggests that a strengthening dollar could continue to weigh on Bitcoin prices, while a weakening dollar might offer some relief.
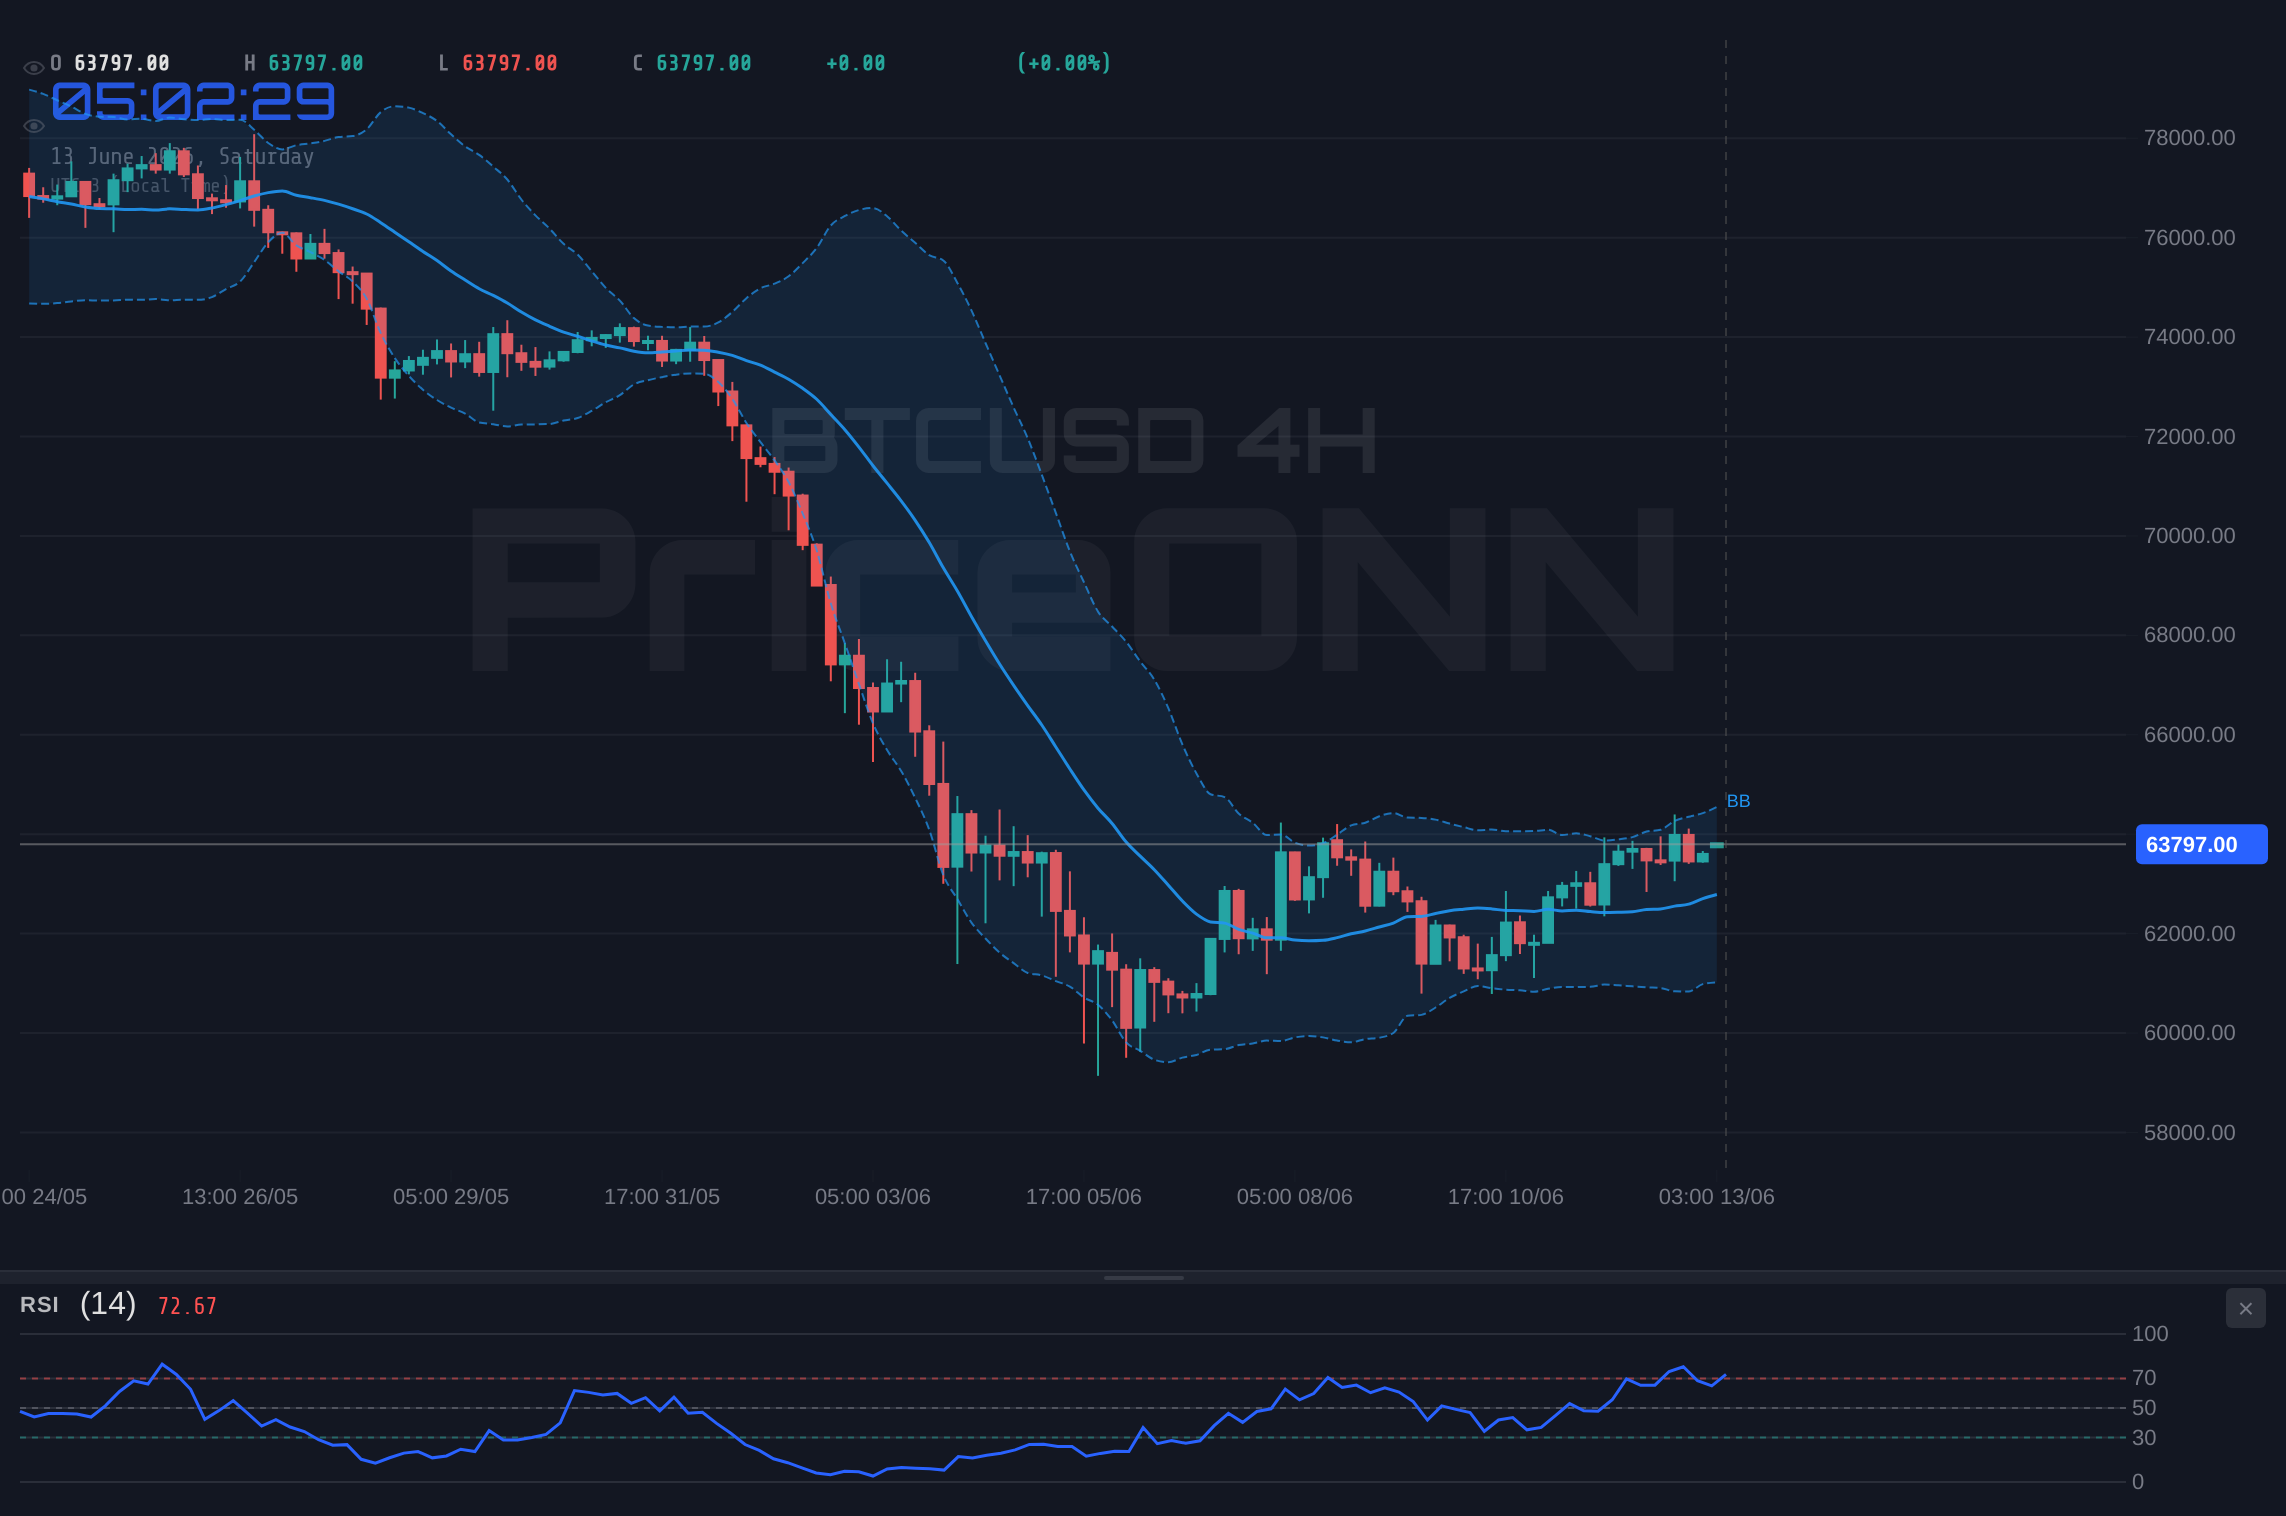
This flat trade around $63,841.00, especially heading into a weekend, often signifies indecision. On the daily chart, Bitcoin's Relative Strength Index (RSI) at 33.79 is screaming 'oversold.' Historically, such readings have often preceded significant bounces, but they don't guarantee an immediate reversal. The bears are still lurking, as evidenced by the negative momentum on the MACD histogram, even as price action attempts to consolidate. The battleground is clearly defined: support at $61,690.67, a level that has been tested and held (or broken and retested) with significant consequences in recent memory, and resistance just above the current price, with the immediate hurdle at $64,519.67. Any move above this resistance, particularly on increasing volume, could signal a shift in sentiment, but for now, the market is holding its breath.
Navigating the Crypto Currents: On-Chain Insights
Looking beyond the immediate price action, the on-chain data paints a complex picture. Active addresses, a key metric for gauging network adoption and usage, have seen a slight dip from recent highs. This isn't necessarily a bearish sign on its own, as it can indicate a period of consolidation where fewer new participants are entering the fray. However, it's a data point to watch closely; a sustained decline in active addresses could suggest waning interest, which would eventually impact price. Exchange flows, on the other hand, have shown some intriguing patterns. While net outflows haven't been overwhelmingly strong, suggesting that large holders aren't aggressively cashing out, there have been sporadic spikes in inflows, particularly around price dips. This could indicate that whales are either rebalancing positions or, more cautiously, moving assets to exchanges in anticipation of potential selling pressure. The hash rate, a measure of the network's security and mining power, remains robust. This is a fundamental strength that underpins Bitcoin's value proposition; miners are still incentivized to secure the network, even if short-term profitability is squeezed by price stagnation or declines. This resilience in the hash rate is a crucial 'X-factor' that provides a floor for long-term confidence, even when short-term technicals appear murky.
Whale movements, those large wallet holders, are particularly noteworthy. While we haven't seen the massive, coordinated dumping events of previous bear markets, there have been subtle shifts in accumulation and distribution patterns. Smaller whale addresses (those holding 10-100 BTC) have shown a tendency to accumulate on dips below $62,000, suggesting a belief in recovery at these lower price points. Conversely, the largest whale addresses (1000+ BTC) have been more conservative, neither aggressively accumulating nor distributing. This 'wait-and-see' approach from the biggest players often mirrors the broader market's indecision. It means that significant upside or downside catalysts are needed to prompt decisive action from these entities. The lack of large-scale selling pressure from these whales is a positive sign, preventing a sharp collapse, but the absence of aggressive buying prevents a strong rally. It’s a standoff that perfectly encapsulates the current $63,841.00 price action.
The health of the broader DeFi and NFT ecosystems also provides context, albeit indirectly. While the current market conditions aren't conducive to explosive growth in these sectors, the underlying infrastructure and Total Value Locked (TVL) in DeFi protocols remain significant. A prolonged crypto winter could see these metrics decline, but the current data suggests resilience. The NFT market, while far from its bull market peaks, is showing signs of life in specific niches, indicating that speculative interest hasn't entirely evaporated. These ecosystems, though not directly driving BTCUSD price action in the short term, are vital for the long-term health and adoption of the cryptocurrency space. Their continued development, even in a muted market, suggests that the innovation cycle is still alive, which is a fundamental positive for Bitcoin's future prospects.
The RSI divergence on the daily chart is a key warning sign. While the price has been consolidating, the RSI has been making lower highs. This suggests weakening momentum behind the current price action. A break below the $61,690.67 support level could accelerate this bearish divergence, potentially leading to a sharper downturn.
The Bull Case: Why $63,841.00 Could Be a Springboard
The bulls are clinging to several key arguments, primarily anchored by the daily RSI's oversold reading of 33.79. This indicator, when it dips below 30, is considered deeply oversold, and while 33.79 isn't quite there, it's close enough to suggest that the selling pressure might be exhausted. Historically, Bitcoin has often found significant buying interest when the daily RSI enters this low territory. The argument is that the market has overreacted to recent macroeconomic concerns, and the fundamental strength of Bitcoin - its scarcity, its role as a potential inflation hedge, and its growing institutional adoption - remains intact. The fact that price is currently hovering just above the critical $61,690.67 support level is seen as a testament to underlying demand. This level has proven its worth multiple times, acting as a psychological anchor. A failure to break this support, followed by a move back towards the immediate resistance at $64,519.67, would be the first sign that the bears are losing their grip.
Furthermore, the DXY (Dollar Index) is trading around 99.8, and its recent movements have been somewhat muted. A stable or slightly weakening dollar is generally supportive of risk assets like Bitcoin. If the dollar fails to regain significant upward momentum, it removes a major headwind for BTCUSD. We also need to consider the broader market sentiment. While equities like the S&P 500 (6572.87) and Nasdaq (29644.55) have shown strength, indicating a general risk-on appetite, the correlation between these indices and Bitcoin can be fluid. If the stock market continues its ascent, it could drag Bitcoin higher. The bulls are hoping for a scenario where the upcoming CPI data comes in softer than expected, or at least in line with forecasts, leading to a dovish pivot or pause from central banks. Such an event would likely boost risk appetite across the board, benefiting Bitcoin significantly. The ADX on the daily chart at 45.46, while indicating a strong *downward* trend, also suggests that if a reversal were to occur, it could be sharp and decisive, fueled by capitulation from short-sellers.
Institutional adoption continues to be a long-term bullish thesis, even if short-term flows are choppy. The narrative around Bitcoin ETFs, while perhaps less explosive than in the initial launch phase, remains a steady undercurrent of demand. Any positive news regarding institutional inflows or regulatory clarity could act as a significant tailwind. The simple fact that Bitcoin has maintained its market capitalization in the face of broader economic uncertainty is, in itself, a bullish signal for many. It demonstrates a growing resilience and a flight-to-quality narrative that is slowly gaining traction. The argument is that $63,841.00 is a strong price point to build from, especially if macroeconomic fears begin to recede. The Stochastic Oscillator on the daily chart, with K at 46.61 and D at 26.01, shows a bullish crossover and is moving out of oversold territory, further supporting the idea that the current price might be a turning point.
For the bullish case to gain traction:
- A daily close above $64,519.67 is needed to signal immediate strength.
- Volume must increase on upward price movements to confirm buying conviction.
- The daily RSI needs to break above 40, ideally moving towards 50, to confirm waning bearish momentum.
- A sustained break above $65,000 would be a significant psychological win for the bulls.
The Bear Case: Why $63,841.00 Could Be a Trap
On the flip side, the bears have a compelling narrative, primarily driven by the persistent negative momentum indicated by the MACD on the daily chart and the sheer strength of the ADX at 45.46, which points to a firmly established downtrend. They argue that the oversold RSI reading is a red herring, a temporary condition that doesn't negate the underlying bearish structure. The fact that Bitcoin has struggled to decisively break above $64,519.67 and remains below key resistance levels suggests that sellers are still in control. The recent sharp drops in oil prices (Brent at $88.63, WTI at $84.85) due to easing geopolitical tensions might seem positive, but they also signal a potential cooling of inflation, which could embolden central banks to maintain a tighter monetary policy for longer. This, in turn, would likely continue to suppress risk assets like Bitcoin.
The correlation with the DXY, currently at 99.8, is another point of concern for the bulls. If the dollar strengthens further - perhaps due to unexpected inflation data or geopolitical jitters resurfacing - it would exert downward pressure on BTCUSD. The broader equity markets, while showing some recent strength (S&P 500 at 6572.87, Nasdaq at 29644.55), are themselves showing signs of topping out on shorter timeframes. The 1-hour RSI for the S&P 500 is already in overbought territory at 70.95, and the Stochastic is showing a bearish crossover. This suggests that any broader market rally might be losing steam, potentially leading to a risk-off sentiment that would spill over into Bitcoin. The bears are betting that the current consolidation is merely a pause before the next leg down, with the $61,690.67 support level being a likely target for a significant breakdown. A close below this level, especially on high volume, would confirm their thesis and could trigger a cascade of stop-loss orders, pushing prices much lower.
Furthermore, the lack of significant positive news flow and the subdued on-chain activity (as discussed earlier) suggest that the fundamental demand drivers for Bitcoin are currently weak. The speculative fervor that fueled previous rallies seems to have subsided, replaced by a more cautious, data-dependent approach. The upcoming CPI data is a major wildcard. If inflation proves to be stickier than expected, it could force central banks to remain hawkish, increasing the pressure on risk assets. Even if CPI is benign, the market might have already priced in that scenario, leading to a 'sell the news' event. The bears are pointing to the fact that Bitcoin is still trading significantly below its all-time highs, and with macroeconomic headwinds persisting, there's ample room for further downside. The Stochastic Oscillator's bearish crossover on the 4-hour chart, with K at 68.88 and D at 80.03, further reinforces the short-term bearish outlook.
For the bearish case to be confirmed:
- A decisive daily close below $61,690.67 is paramount.
- Volume should spike on downward price movements, indicating panic selling.
- The daily RSI needs to break below 30 to confirm extreme oversold conditions and potential capitulation.
- Resistance levels around $64,519.67 must hold firmly, rejecting any upward price attempts.
The Verdict: A Tense Equilibrium Near $63,841.00
The market sentiment surrounding BTCUSD at $63,841.00 is a classic tug-of-war. The daily chart's oversold RSI at 33.79 offers a glimmer of hope for the bulls, suggesting that the recent selling pressure might be nearing exhaustion. Historically, such low RSI readings have often been followed by a price recovery. The robust hash rate also provides a fundamental pillar of support, indicating the network's underlying health and security. However, the persistent negative momentum shown by the MACD histogram and the strong ADX reading of 45.46 on the daily timeframe cannot be ignored by the bears. These indicators point to an established downtrend that is far from over. The battle hinges on key levels: $61,690.67 as the critical support and $64,519.67 as the immediate resistance. A break decisively above the latter, confirmed by rising volume and a move in the RSI towards 50, would favor the bulls. Conversely, a breakdown below $61,690.67, especially on significant volume, would validate the bearish thesis and likely trigger further downside.
The looming CPI data release is the ultimate wildcard. A significantly higher-than-expected inflation print could spook risk assets, leading to a dollar rally (DXY at 99.8) and a sell-off in Bitcoin. Conversely, a cooler inflation report might provide the relief rally the bulls are desperately seeking, potentially triggering a move towards $65,000 and beyond. The correlation with equities also plays a role; if the S&P 500 (6572.87) and Nasdaq (29644.55) show further strength, it could provide a tailwind for BTCUSD. However, the bearish signals on the 1-hour charts for these indices warrant caution. The Stochastic Oscillator's conflicting signals across different timeframes - bullish crossover on the daily, bearish crossover on the 4-hour - underscore the current indecision. Given the confluence of a critical support level, an oversold daily RSI, and the looming CPI data, the most probable scenario in the immediate short term is continued volatility and range-bound trading. The market is waiting for direction. Patience is key; waiting for a clear break of either the support or resistance levels, coupled with confirmation from volume and other indicators, will be crucial for defining the next significant trade setup.
The strategy, therefore, is one of observation and risk management. Aggressive traders might look for short-term opportunities around the $61,690.67 support or $64,519.67 resistance, but with tight stop-losses. For most, waiting for a confirmed breakout or breakdown is the prudent approach. The weekly close will be telling; a close significantly above $64,519.67 would start to build a bullish case, while a close below $61,690.67 would solidify the bearish outlook. Until then, expect choppy, range-bound action around the current $63,841.00 level, as the market digests the technical picture and anticipates the economic data that could provide the necessary spark.
Bearish Scenario: Downside Pressure Mounts
65% ProbabilityNeutral Scenario: Range-Bound Consolidation
25% ProbabilityBullish Scenario: Recovery Gains Traction
10% ProbabilityFrequently Asked Questions: BTCUSD Analysis
What happens if BTCUSD breaks below the $61,690.67 support level?
A daily close below $61,690.67 would confirm the bearish thesis, potentially triggering a move towards $59,984.33. This scenario is invalidated if price recovers above $64,519.67.
Is the current RSI reading of 33.79 a buy signal for BTCUSD at $63,841.00?
While the daily RSI at 33.79 indicates oversold conditions, it doesn't guarantee an immediate rally. Bears still hold influence, and confirmation above $64,519.67 is needed for a strong bullish signal.
What does the negative MACD histogram suggest for BTCUSD trend analysis?
The negative MACD histogram indicates bearish momentum is still present, despite the oversold RSI. This suggests that while a bounce is possible, the underlying trend remains under pressure until this momentum shifts.
How will the upcoming CPI data affect BTCUSD this week?
A higher-than-expected CPI could pressure BTCUSD due to potential dollar strength and risk-off sentiment. Conversely, a cooler print might fuel a relief rally, especially if it leads to dovish central bank expectations.
Track markets in real-time
AI-powered analysis, technical indicators and real-time price data.
Join Our Telegram Channel
Breaking market news, AI analysis and trading signals instantly.
Join Channel