The global markets are navigating a complex nexus of easing geopolitical tensions and shifting macroeconomic indicators. While oil prices have experienced a sharp downturn on renewed optimism surrounding de-escalation in the Middle East, and the US Dollar Index (DXY) shows signs of wavering from its recent highs, the cryptocurrency market, particularly Ethereum (ETHUSD), is at a critical juncture. The current price action for ETHUSD, hovering around $1,663.26, reflects a delicate balance between broader market sentiment and the unique fundamentals driving the digital asset space. This analysis delves into the current technical landscape, the influence of macro trends, and the specific on-chain metrics that will dictate Ethereum's next significant move.
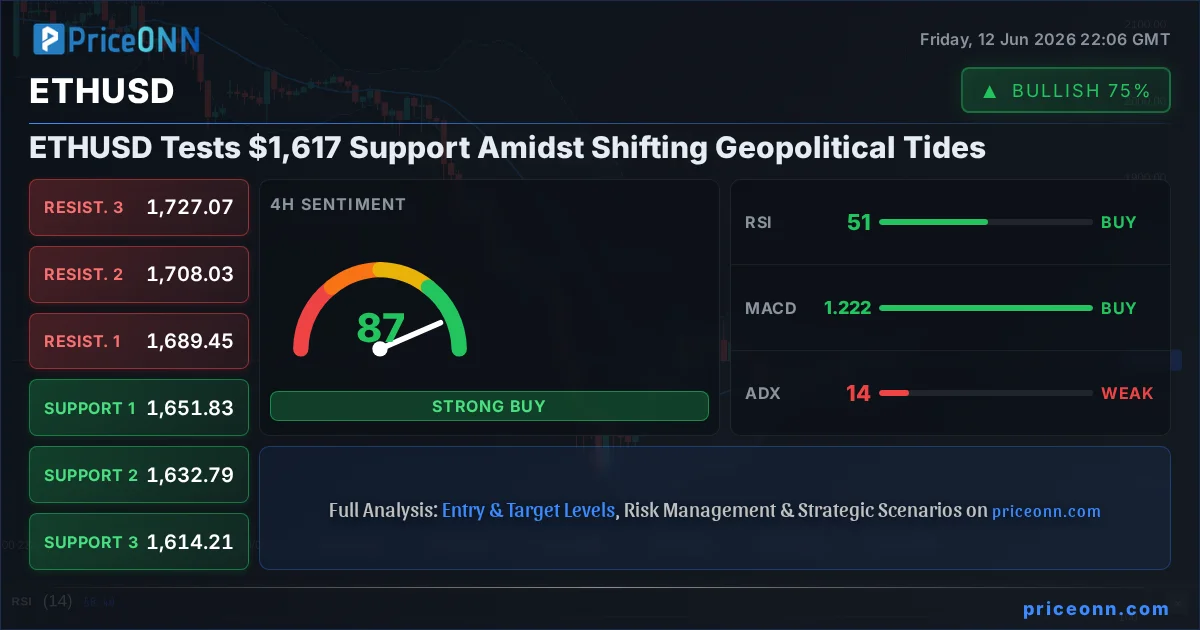
- ETHUSD is currently testing the $1,617 support level, a critical zone watched by traders.
- With RSI at 49.25 on the 1H chart, momentum is neutral but leaning towards bearish, suggesting caution.
- The DXY at 99.8 and a slight pullback in SP500 at 6572.87 indicate a complex risk appetite environment.
- Easing geopolitical concerns have historically pressured safe-haven assets, potentially impacting crypto's risk-on correlation.
The narrative shift in global risk appetite, driven by perceived de-escalation in Middle Eastern conflicts, is creating ripples across all asset classes. Oil prices have seen a significant sell-off, a direct consequence of diminished geopolitical premiums. This reduction in perceived risk typically benefits riskier assets, but the immediate reaction in cryptocurrencies, including ETHUSD, has been more subdued, even showing weakness as it approaches key support levels. The DXY, a barometer of dollar strength, is currently trading around 99.8, showing mixed signals as it attempts to consolidate after recent movements. This interplay between a potentially softening dollar and a fluctuating risk sentiment creates a challenging environment for assets like Ethereum, which often exhibit a complex correlation with both traditional markets and currency movements. The critical question is whether the easing geopolitical backdrop will translate into renewed risk appetite that lifts ETHUSD, or if lingering macroeconomic concerns will keep a lid on any potential rallies.
The technical picture for ETHUSD is currently painting a picture of indecision, particularly across shorter timeframes. On the 1-hour chart, ETHUSD is trading at $1,663.26, but the immediate challenge lies in holding above the $1,617 support. The RSI(14) at 49.25 indicates a neutral stance, but with a slight bearish eğilim, suggesting that bulls are not yet in firm control. The MACD histogram, currently negative and below its signal line, reinforces this cautious sentiment, pointing to a prevailing bearish momentum in the very short term. However, the Stochastic Oscillator's K line at 31.64, below its D line at 39.42, signals a potential for a bounce, though it's still in oversold territory, indicating that selling pressure might be waning. The ADX at 14.73 signifies a weak trend, characteristic of consolidation or choppy price action, meaning that any move could be susceptible to reversals. This conflicting set of signals across the 1-hour timeframe underscores the immediate need for ETHUSD to establish a clear direction, with the $1,617 support acting as a crucial line in the sand.
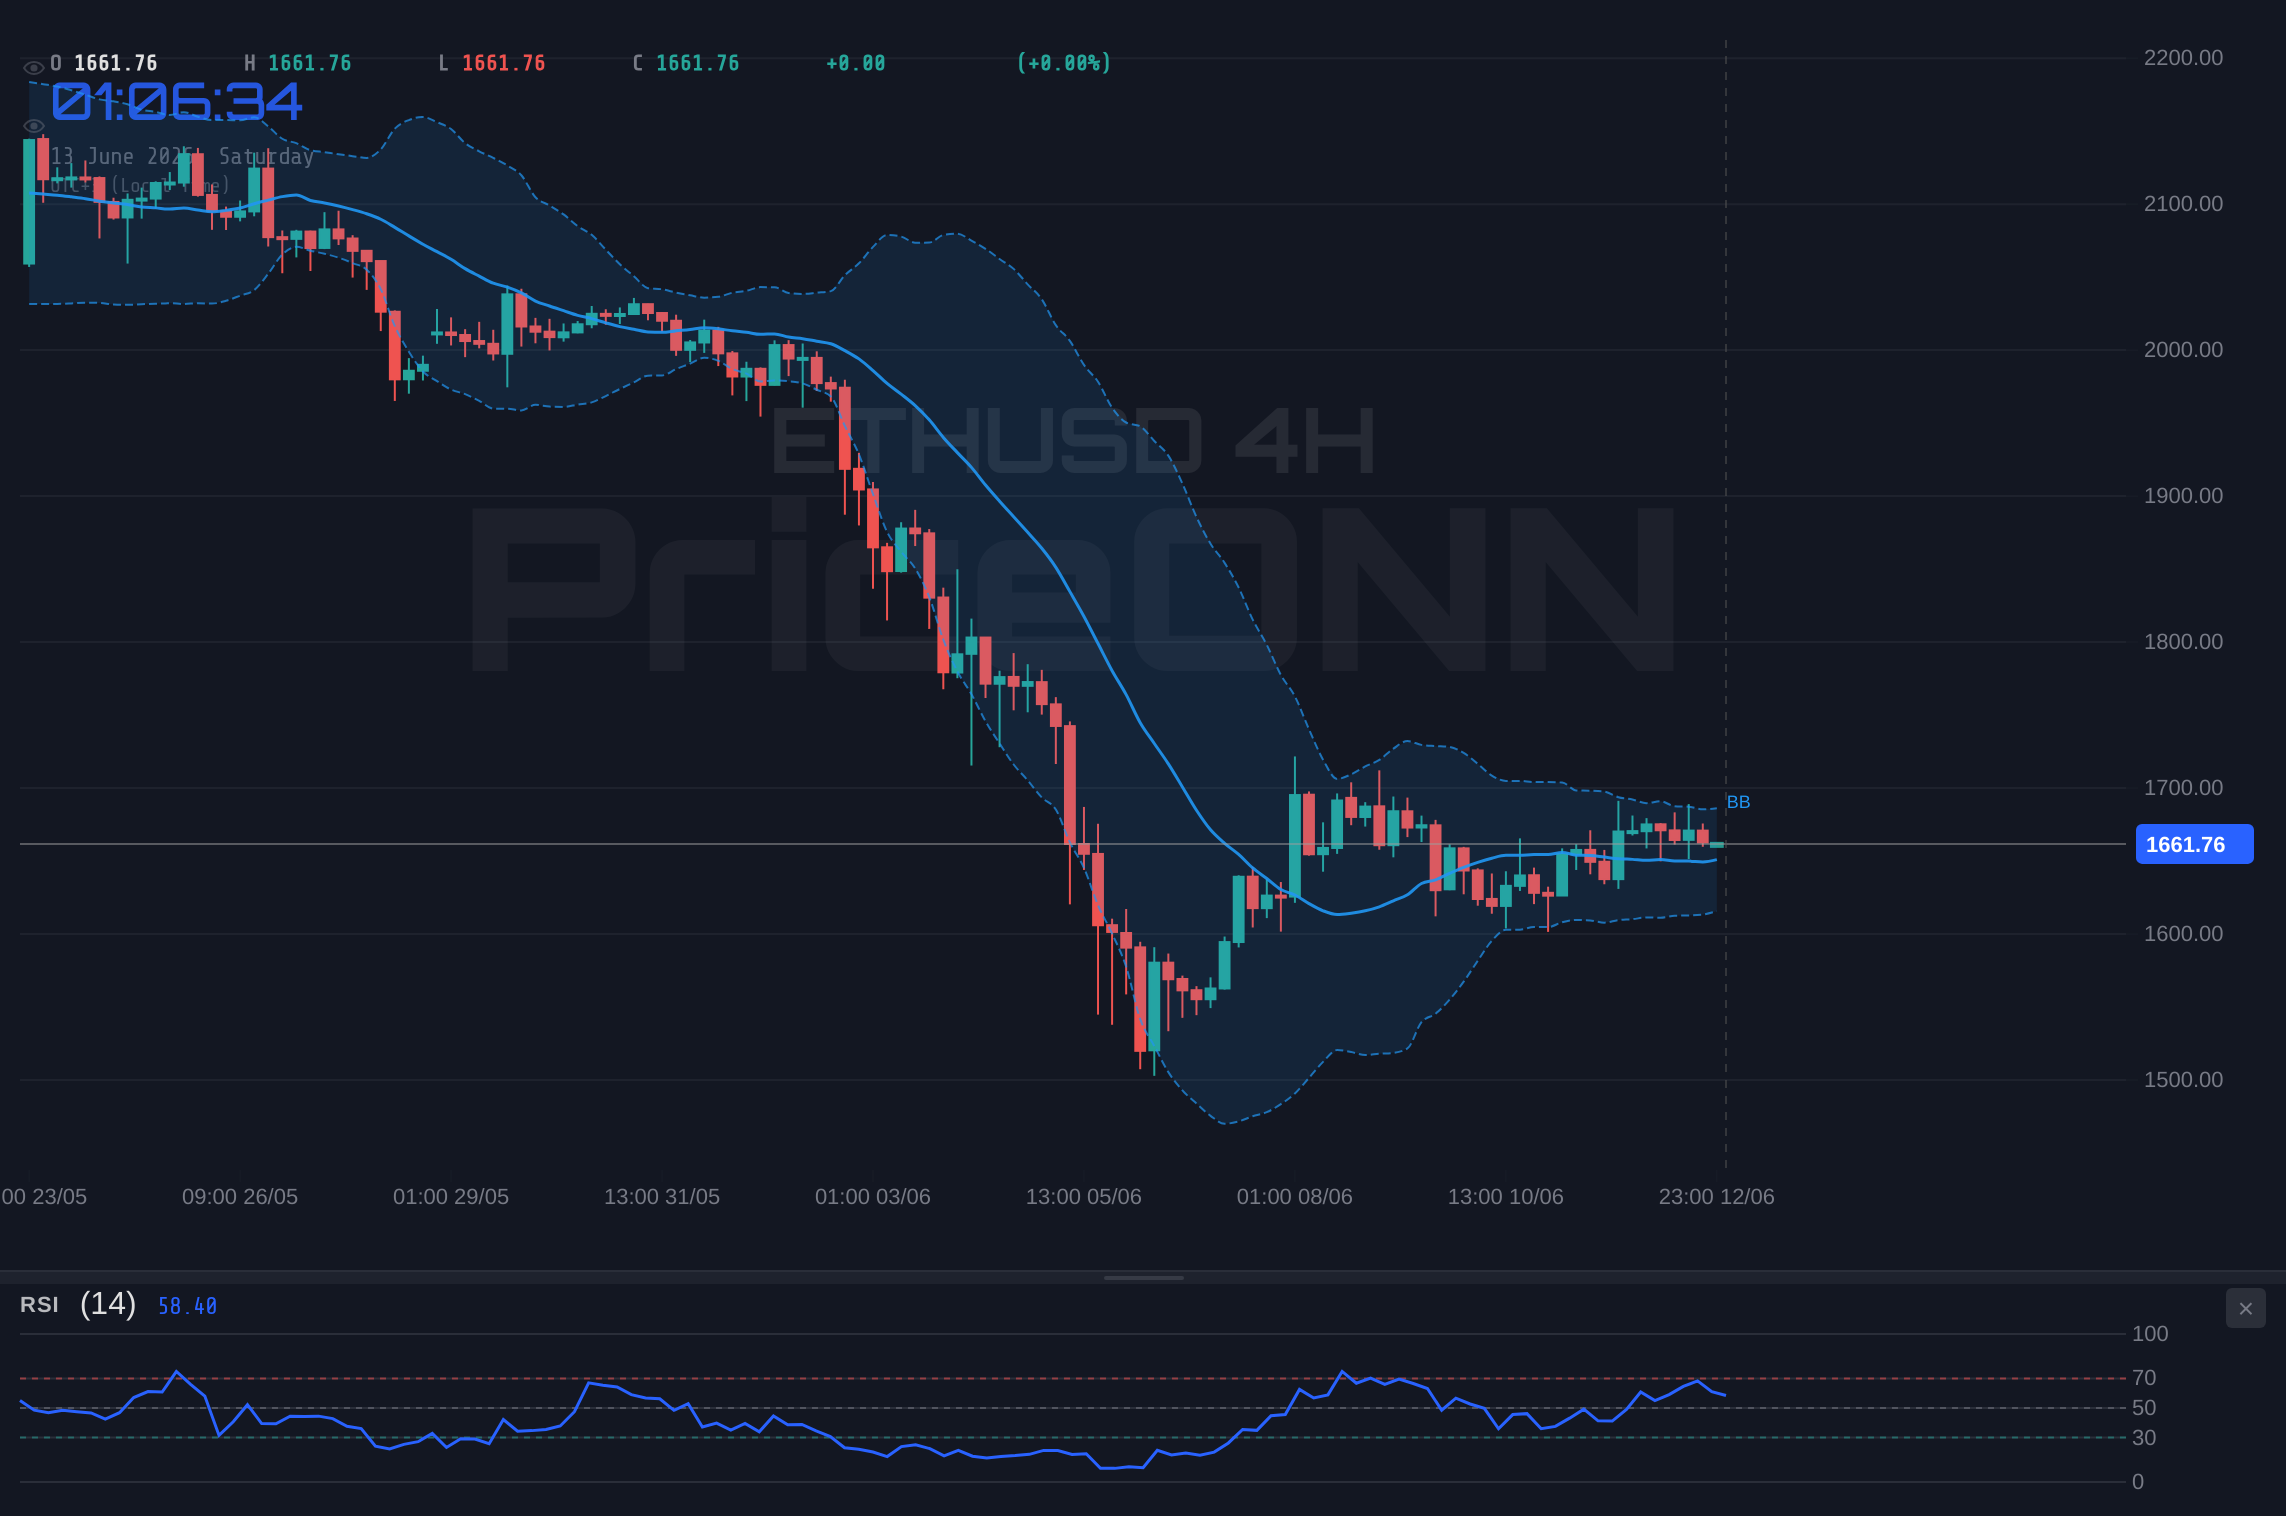
Shifting to the 4-hour timeframe, the technical indicators offer a slightly more constructive, albeit still cautious, outlook for ETHUSD. The price is currently trading above the middle Bollinger Band, suggesting a nascent upward momentum. The RSI(14) at 50.9 hovers around the neutral zone, indicating a balance between buyers and sellers. Crucially, the MACD is showing positive momentum with its histogram above the signal line, a sign that buying pressure might be re-emerging on this timeframe. The Stochastic Oscillator, however, presents a mixed signal: K=59.5 and D=70.91 shows the K line below the D line, suggesting a potential bearish pull, yet both lines are in overbought territory, hinting at potential exhaustion for sellers. The ADX value of 13.79 continues to point towards a weak trend, underscoring the difficulty in establishing sustained directional conviction. Despite these mixed signals, the overall 'AL' (Buy) signal on this timeframe, derived from the composite of indicators, suggests that the 4-hour chart might be leaning towards a more optimistic scenario, provided key resistance levels can be overcome.
On the daily timeframe, the technical indicators for ETHUSD present a decidedly bearish outlook, which contrasts with the slightly more optimistic short-term signals. The current price of $1,663.26 is well below the middle Bollinger Band, indicating a prevailing downward trend. The RSI(14) is at 31.2, firmly in oversold territory, suggesting that while selling pressure has been intense, there might be room for a bounce. However, the MACD remains deeply negative, with the histogram below the signal line, confirming sustained bearish momentum. The Stochastic Oscillator offers a glimmer of hope, with the K line at 37.41 crossing above the D line at 27.66, indicating a potential bullish divergence and a possible bottoming formation. Yet, the ADX at a formidable 53.59 is the most telling figure, signifying an extremely strong downward trend. This high ADX reading suggests that any short-term bounces might be mere corrections within a larger downtrend, and significant upside momentum will require substantial conviction to overcome.
The Macroeconomic Undercurrents Shaping ETHUSD
The recent easing of geopolitical tensions in the Middle East is a significant development that cannot be overlooked when analyzing ETHUSD. Historically, periods of heightened geopolitical risk have often correlated with a flight to safety, benefiting traditional safe-haven assets like gold and sometimes even the US Dollar. Conversely, a reduction in these risks tends to foster greater risk appetite, potentially leading investors to seek higher returns in assets like equities and, by extension, cryptocurrencies. The sharp decline in oil prices, a direct barometer of geopolitical risk premiums, underscores this shift. If this trend towards de-escalation continues, we could see a sustained increase in risk appetite, which would theoretically provide a tailwind for ETHUSD. However, the crypto market's reaction has been somewhat muted, possibly due to other prevailing macroeconomic factors that are tempering enthusiasm.
Central bank policies remain a dominant force shaping market sentiment and asset prices. While the provided data does not include specific central bank meeting outcomes for the past few days, the general expectation of monetary policy paths heavily influences investor behavior. If central banks, particularly the Federal Reserve, maintain a hawkish stance or signal prolonged higher interest rates, it typically dampens enthusiasm for risk assets like ETHUSD. Higher borrowing costs make future earnings less valuable and increase the attractiveness of yield-bearing assets. Conversely, any hint of a dovish pivot, such as anticipated rate cuts or a pause in tightening cycles, can reignite interest in growth-oriented assets. The current market pricing, often reflected in Fed Fund Futures and OIS rates, provides crucial insights into these expectations. Traders are constantly weighing the probability of rate hikes versus cuts, and any deviation from the consensus can trigger significant volatility across markets, including cryptocurrencies. The current DXY at 99.8, while not at extreme highs, reflects a market still somewhat cautious about the global economic outlook and monetary policy direction.
The correlation between ETHUSD and broader risk assets, particularly equities like the SP500 and Nasdaq, is another critical factor. The SP500, currently trading around 6572.87, and the Nasdaq at 29644.55, have shown resilience, but the underlying trend and short-term signals warrant close observation. A sustained decline in major equity indices often signals a broader risk-off sentiment, which can spill over into the crypto market. ETHUSD, while increasingly seen as a distinct asset class, still exhibits significant correlation with tech stocks, especially during periods of market stress or broad liquidity shifts. For instance, if the Nasdaq experiences a sharp pullback, it's plausible that ETHUSD could follow suit, irrespective of its own fundamental developments. Understanding this dynamic is key; as equity markets move, their sentiment often dictates the flow of capital into or out of riskier assets like Bitcoin and Ethereum.
On-Chain Metrics: A Deeper Dive into Ethereum's Health
Beyond the charts and macroeconomic narratives, on-chain data provides a granular view of Ethereum's underlying network health and investor behavior. Examining metrics such as active addresses, transaction volumes, and whale movements can offer valuable insights that are not always apparent in price action alone. An increasing number of active addresses, for example, suggests growing network utility and adoption, which is a fundamentally bullish sign. Conversely, a decline in active addresses, especially when accompanied by falling transaction volumes, could indicate waning interest or reduced network activity, potentially signaling a bearish undertone.
Whale movements - large accumulations or distributions by major ETH holders - are particularly scrutinized. A significant influx of ETH onto exchanges from whale wallets can signal an intention to sell, potentially putting downward pressure on prices. Conversely, large outflows from exchanges, especially into cold storage, often suggest long-term conviction and a belief in future price appreciation. Tracking these large-scale movements provides a glimpse into the sentiment of major market participants, offering a valuable counterpoint to retail trading patterns. While specific whale data is not provided in the live API feed, analysts typically monitor these flows closely, often using blockchain explorers and specialized analytics platforms to identify significant shifts.
Exchange flows, encompassing both inflows and outflows, offer another critical perspective. High net inflows of ETH onto exchanges can indicate increased selling pressure as holders move assets to potentially liquidate them. Conversely, net outflows suggest that investors are withdrawing ETH from trading platforms, possibly for staking, holding long-term, or participating in DeFi protocols. The balance between these inflows and outflows can act as a leading indicator for price movements, reflecting the immediate supply and demand dynamics on trading venues. Furthermore, analyzing the Total Value Locked (TVL) in Ethereum's DeFi ecosystem provides insight into the demand for ETH as a foundational asset for decentralized applications. A rising TVL typically signifies growing engagement with DeFi, which can indirectly support ETH price through increased demand and utility.
Navigating the Current Market Cycle for ETHUSD
The current market cycle for cryptocurrencies, and ETHUSD specifically, appears to be in a phase of consolidation and price discovery, influenced by a confluence of factors. We are not in a clear bull run phase, nor are we in a deep bear market. Instead, it feels like a period where the market is digesting recent gains, recalibrating expectations based on macroeconomic shifts, and awaiting clearer catalysts. The significant daily percentage changes seen in some assets, like XAUUSD at 3.58% and XAGUSD at 7.27%, highlight that volatility remains high across traditional markets, which can spill over into crypto.
The 'cycle context' here is crucial. After periods of significant volatility and potential accumulation phases, markets often enter a stage where they consolidate. This is where risk management becomes paramount. The ADX values across various timeframes for ETHUSD (14.73 on 1H, 13.79 on 4H, 53.59 on 1D) illustrate this complexity: weak trends on shorter timeframes suggesting sideways movement, but a very strong downtrend signal on the daily chart. This dichotomy implies that while short-term traders might find opportunities in ranging markets, the longer-term trend remains bearish, demanding caution. The market is essentially in a 'wait-and-see' mode, with investors closely monitoring inflation data, central bank commentary, and geopolitical developments for definitive directional cues.
Trade Scenarios for ETHUSD: What to Watch Next
Given the current technical indecision and the mixed macro backdrop, ETHUSD presents a landscape ripe for careful strategic planning rather than aggressive positioning. The immediate focus remains on the $1,617 support level. A break and sustained close below this level on a daily basis would likely trigger further downside, potentially targeting the next significant support at $1,564.54. This bearish scenario would be reinforced if the DXY continues to climb and risk appetite evaporates, pushing equities lower. On the flip side, a decisive move above the immediate resistance at $1,665.87, followed by a clear break above the $1,707.15 daily resistance, could signal a shift in momentum. This bullish scenario would require confirmation from improving on-chain metrics and a generally positive risk sentiment.
Bearish Scenario: Testing the Depths
65% ProbabilityNeutral Scenario: Range-Bound Consolidation
25% ProbabilityBullish Scenario: Reclaiming Momentum
10% ProbabilityFrequently Asked Questions: ETHUSD Analysis
What happens if ETHUSD breaks below the $1,617 support level?
A break below $1,617 on a daily chart would signal a continuation of the bearish trend, potentially leading to further declines. The next critical support levels to watch would be $1,564.54 and then $1,527.61, as indicated by the daily technical data.
Should I buy ETHUSD at current levels around $1,663 given the mixed signals?
Buying at current levels carries significant risk due to the bearish daily trend (ADX 53.59) and the proximity to the $1,617 support. A more prudent approach would be to wait for confirmation, such as a decisive close above $1,707.15, or a clear bounce from $1,617 with improving on-chain activity.
Is the RSI at 49.25 on the 1H chart a sell signal for ETHUSD?
An RSI of 49.25 is generally considered neutral, but its slight bearish eğilim on the 1-hour chart suggests that buyers are not yet in control. It doesn't constitute a direct sell signal on its own but indicates a lack of strong upward momentum, aligning with the cautious outlook.
How might the easing geopolitical situation affect ETHUSD this week?
Easing geopolitical tensions typically reduce safe-haven demand, potentially increasing risk appetite for assets like ETHUSD. However, this effect might be tempered by ongoing concerns about interest rates and inflation. A sustained increase in risk appetite could see ETHUSD target resistance levels around $1,707 and beyond, but it's contingent on broader market sentiment.
The path forward for ETHUSD hinges on its ability to defend the $1,617 support level. While shorter timeframes show some signs of potential stabilization, the overarching daily trend remains bearish, reinforced by a high ADX reading of 53.59. Investors and traders should remain vigilant, paying close attention to how price action unfolds around these key levels. The interplay between macroeconomic factors, such as central bank policy expectations and the US Dollar Index's trajectory, alongside on-chain activity, will be crucial in determining whether ETHUSD can stage a sustainable recovery or if further downside is imminent. Patience and disciplined risk management are paramount as the market seeks clarity.
Track markets in real-time
AI-powered analysis, technical indicators and real-time price data.
Join Our Telegram Channel
Breaking market news, AI analysis and trading signals instantly.
Join Channel