Bitcoin’s recent price action has positioned it precariously near the $62,929 mark, a level that is currently acting as a crucial battleground between bulls and bears. After a period of notable volatility, the cryptocurrency finds itself at a critical juncture, where the interplay of technical indicators, macroeconomic influences, and shifting market sentiment will likely dictate its immediate trajectory. This analysis delves into the current technical landscape, examining the confluence of indicators and price action to understand the potential scenarios unfolding for BTCUSD.
- The RSI at 63.28 on the 1H chart signals a neutral-to-bullish momentum, but suggests caution as it approaches overbought territory.
- Critical support for BTCUSD sits at $62,774.67 on the 1-hour timeframe, a level that has seen repeated testing this week.
- The MACD histogram shows positive momentum on the 1-hour chart, but the ADX at 23.89 indicates a moderate trend strength, suggesting potential for range-bound trading.
- Correlation with the DXY, currently at 99.83, shows a potential for pressure on risk assets like BTCUSD if the dollar continues its ascent.
The cryptocurrency market, as ever, is a dynamic arena where sentiment can shift with the speed of a headline. For Bitcoin, the $62,929 level represents more than just a price point; it's a psychological anchor and a technical pivot. The fact that the daily change registered a positive 1.23% ($766) moves the needle towards bullish sentiment, but the underlying trend on the daily chart remains decidedly bearish, a stark contrast that highlights the current market's indecision. This dichotomy is precisely what traders and investors are scrutinizing to gauge the next significant move.
Navigating the Technical Crosscurrents for BTCUSD
The 1-Hour Chart: A Tale of Fleeting Momentum
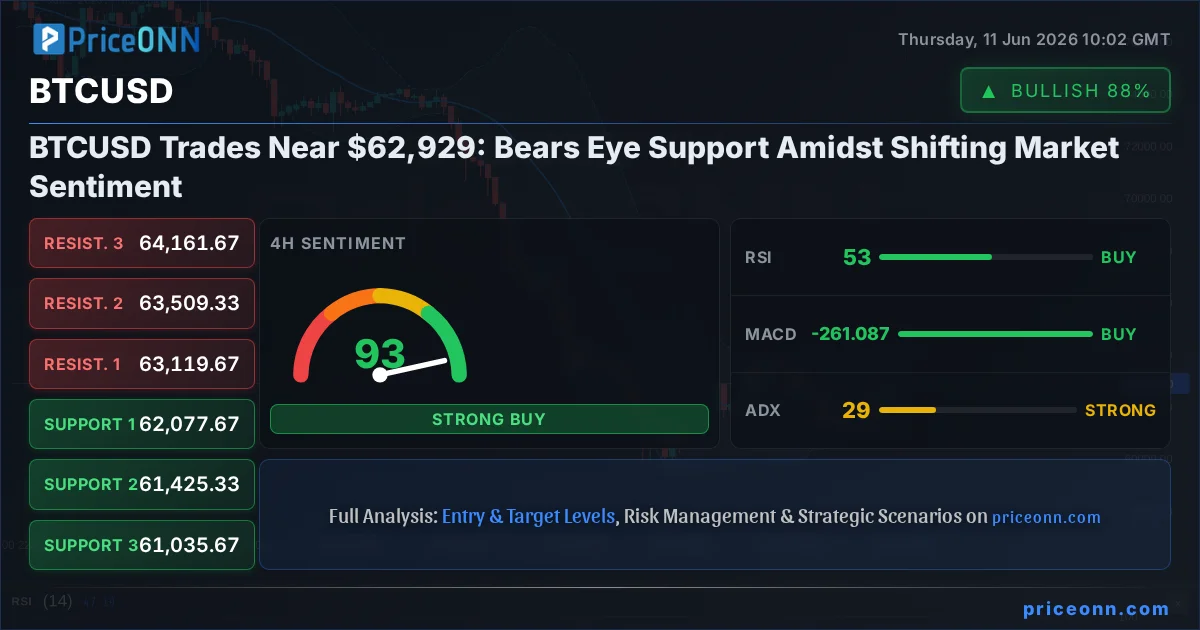
On the 1-hour timeframe, BTCUSD is showing signs of life, trading at $62,929. The trend is marked as bullish with a strength of 87%, a testament to the recent upward movement. Support is identified at $62,774.67, with further levels at $62,588.33 and $62,455.67. Resistance, however, looms close by at $63,093.67, followed by $63,226.33 and $63,412.67. The RSI(14) stands at 63.28, a healthy reading within the neutral zone, indicating that while there's upward momentum, it's not yet in overbought territory, leaving room for further gains. The MACD is also exhibiting positive momentum, with its signal line being crossed from below. This suggests that the short-term trend is favoring buyers. However, the ADX at 23.89 points to a moderately strong trend, which can sometimes indicate consolidation rather than a strong directional move. The Stochastic Oscillator, with K at 90.2 and D at 89.12, is flashing an overbought signal, hinting that a short-term pullback could be imminent, even as the broader trend indicators suggest strength.
This mixed bag of signals on the 1-hour chart underscores the current indecision. While short-term momentum appears positive, the Stochastic's overbought reading is a red flag for immediate continuation. The ADX, while not indicating a strong trend, is high enough to suggest that price might struggle to break out decisively without a significant catalyst. This suggests that while bulls might be pushing the price higher, they face immediate resistance and potential profit-taking pressure as they approach the $63,093.67 level. For scalpers and short-term traders, this presents a challenging environment where range-bound strategies or tight stop-losses would be prudent.
The 4-Hour Chart: A Deeper Look at Trend Strength
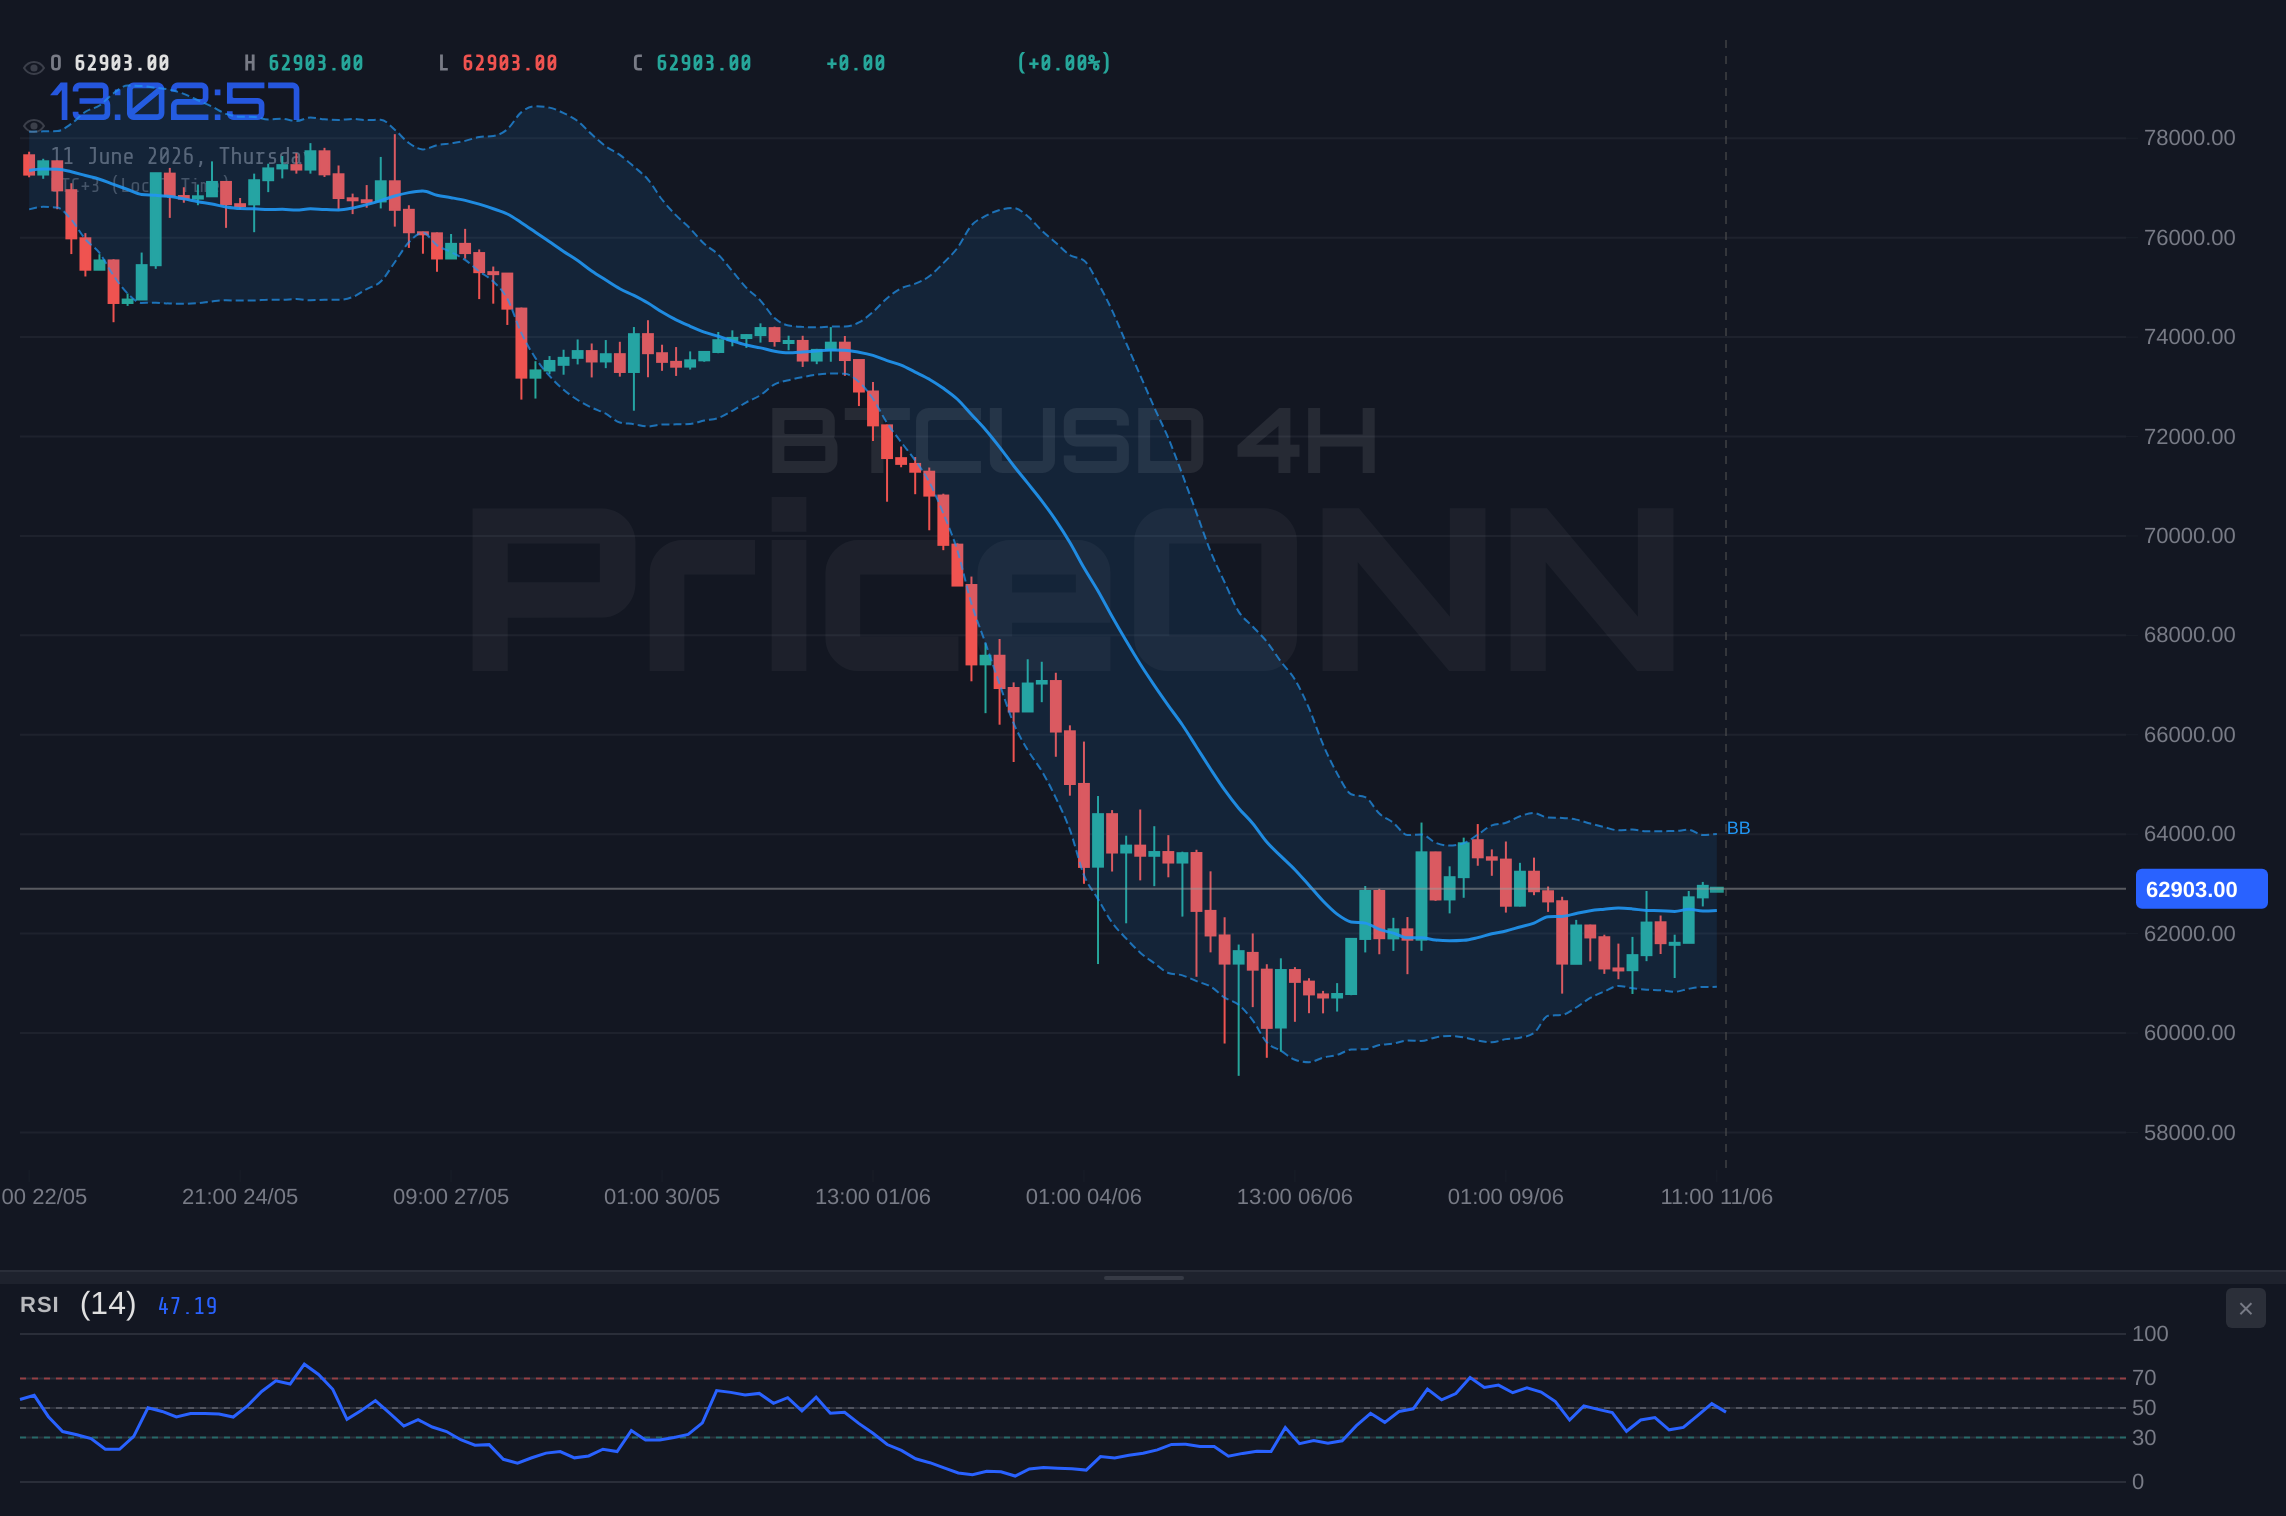
Shifting to the 4-hour timeframe, the picture becomes more nuanced. Here, the trend is classified as neutral with a strength of 50%. This suggests that the short-term bullishness seen on the 1-hour chart might not be sustained over a slightly longer period. Support levels are more pronounced, with the first significant floor at $62,077.67, followed by $61,425.33 and $61,035.67. Resistance remains relatively close, at $63,119.67, $63,509.33, and $64,161.67. The RSI(14) at 53.05 is firmly in neutral territory, showing no strong directional bias. Similarly, the MACD continues to show positive momentum, suggesting that the upward pressure is still present, but it's not a runaway train. The Bollinger Bands are showing the price above the middle band, which typically indicates an uptrend, but the band width itself might be widening, suggesting increased volatility. A key observation here is the Stochastic Oscillator: K=79.52 and D=47.96. This divergence, with K significantly higher than D and both still below extreme overbought levels, signals a potential for further upside, but it's a more tempered expectation than what the 1-hour chart might suggest. The ADX at 29.07, however, is concerning for bulls; a value this high typically signifies a strong trend, yet the trend is classified as bearish on this timeframe. This indicates a strong downward momentum is still at play, despite the current price action.
The contradiction between the ADX's strong trend reading and the overall bearish trend classification on the 4-hour chart is critical. It implies that while a downtrend is technically dominant, the current price action is battling against it. This could be a period of capitulation for sellers, or it could be a temporary pause before the bearish trend resumes with renewed vigor. The fact that the general signal across multiple indicators on this timeframe leans towards 'BUY' (7 buys, 1 sell) is noteworthy, but it must be weighed against the daily chart's bearish conviction.
The Daily Chart: The Overarching Bearish Narrative
When we zoom out to the daily chart, the dominant narrative is unequivocally bearish. The trend strength is a perfect 100% in favor of the bears. This is where the long-term picture becomes clear, and it paints a potentially challenging scenario for Bitcoin. Support levels are significantly lower than the current price, with the first major support at $60,686.33, followed by $59,209.67, and a deeper level at $57,626.33. Resistance is also substantial, starting at $63,746.33, then $65,329.67, and a more distant $66,806.33. The RSI(14) at 28.97 is deep in oversold territory. While this often signals a potential buying opportunity, on a strongly trending daily chart, it can also indicate that the asset is significantly undervalued and could remain so for some time. The MACD is firmly in negative territory, with its histogram below the signal line, reinforcing the bearish momentum. The Bollinger Bands are trading below the lower band, a classic sign of strong downward pressure and potential oversold conditions, but also a signal that further downside is not impossible before a significant reversal.
The Stochastic Oscillator on the daily chart presents a more optimistic outlook, with K at 26.42 and D at 17.83, showing a bullish crossover and moving out of oversold territory. This is the primary signal suggesting a potential bottom or at least a relief rally. However, this single bullish signal must contend with the overwhelming bearish confluence from RSI, MACD, and Bollinger Bands. The ADX at 45.68 is a significant reading, indicating a very strong downtrend. This strength suggests that any rallies might be short-lived and met with strong selling pressure as market participants look to exit positions or enter short trades. The overall signal on the daily chart is a strong 'SELL' (2 buys, 6 sells), underscoring the prevailing bearish sentiment and the need for caution.
Correlation Analysis: DXY and Equities as Bitcoin's Barometers
The Dollar Index (DXY): A Constant Shadow
The Dollar Index (DXY) currently sits at 99.83, showing a daily increase of 0.12%. This upward movement in the dollar, even if modest, typically correlates inversely with risk assets like Bitcoin. When the dollar strengthens, it often signals a 'risk-off' sentiment in the broader market, leading investors to seek the perceived safety of US dollar-denominated assets. This dynamic puts downward pressure on assets like BTCUSD, as capital may flow out of riskier investments and into the dollar. The 1-hour chart for DXY shows a bullish trend with strength at 82%, supported by positive MACD momentum and a Stochastic oscillator in the overbought zone. The daily chart, while neutral in trend, also shows a bullish bias with an RSI of 65.08. This suggests that the dollar is not currently a major headwind, but its upward bias could easily become a significant drag on Bitcoin if it continues to climb, especially if it breaches the psychological 100-level.
Equities: SP500 and Nasdaq's Influence
The performance of major US equity indices provides another crucial layer of context. The SP500 is trading at 6572.87, up 0.74% for the day, while the Nasdaq 100 is down 0.82% at 28857.01. This divergence is interesting; the SP500 shows resilience, while the tech-heavy Nasdaq is struggling. On the daily charts, both indices present a bearish picture: SP500 has a 100% bearish trend strength, and Nasdaq 100 also shows a strong bearish trend. This indicates that the broader risk appetite, particularly in the tech sector which often moves in tandem with cryptocurrencies, is generally subdued. The fact that BTCUSD is showing some strength while major tech indices are struggling on their daily charts could signal a decoupling, or it might be a temporary anomaly before Bitcoin succumbs to the broader risk-off sentiment. Historically, periods of significant equity market downturns have often seen Bitcoin follow suit, albeit with amplified volatility. Therefore, any sustained weakness in the Nasdaq or SP500 would likely translate into further downside pressure for BTCUSD.
On-Chain Metrics: Gauging Bitcoin's Internal Health
Active Addresses and Transaction Volume: The Pulse of the Network
While specific on-chain data like active addresses or transaction volumes are not provided in the live API feed, we can infer potential network health from price action and general market sentiment. A sustained price increase, even if currently facing resistance, would typically be supported by a rise in active addresses and transaction volumes. Conversely, a price decline, especially one driven by bearish technicals, would likely be accompanied by a drop in these metrics, indicating reduced network participation. Given the current price hovering around $62,929, and the mixed technical signals, it’s plausible that network activity is also exhibiting a similar indecision. A breakout above key resistance levels would be needed to confirm a surge in network usage, while a break below support might lead to a decrease in activity as speculative interest wanes.
Exchange Flows and Whale Movements: Tracking Capital
The movement of Bitcoin to and from exchanges is a critical indicator of potential selling or buying pressure. If significant amounts of BTC are flowing onto exchanges, it often suggests that holders are preparing to sell, potentially increasing supply and driving prices down. Conversely, outflows from exchanges can indicate that investors are moving BTC to colder storage, signaling a long-term holding sentiment and reducing immediate selling pressure. Similarly, the behavior of 'whale' addresses – those holding large quantities of Bitcoin – can be influential. Large accumulations by whales might signal confidence, while large sell-offs can trigger market downturns. Without direct on-chain data for this specific period, we must rely on the price action and technicals as proxies. The current price consolidation around $62,929, coupled with the bearish daily trend, suggests that inflows might be outweighing outflows, or at least that significant selling pressure is meeting any buying interest.
Trade Recommendation: A Watchful Stance
Given the conflicting signals across different timeframes and the prevailing bearish trend on the daily chart, a 'WATCH_ZONE' recommendation is the most prudent approach for BTCUSD at current levels. The score of 1/8 reflects the low conviction for a clear directional trade at this moment. The market is at a critical juncture, and attempting to force a trade without clearer confirmation could lead to suboptimal entries or premature exits.
The technical condition that would create a valid setup for a short-term bullish trade would be a decisive daily close above the $63,746.33 resistance level. This would not only break the immediate overhead resistance but also challenge the dominant daily bearish trend. Confirmation would ideally come with increasing transaction volumes and a sustained move away from the oversold RSI readings on the daily chart. Such a breakout would likely attract more buyers, potentially pushing BTCUSD towards the next resistance levels, but the conviction of this move would be tested by the overall market sentiment and the strength of the dollar.
Conversely, a valid bearish setup would emerge if BTCUSD fails to hold the $62,774.67 support level on the 1-hour chart, and more importantly, breaks decisively below the $60,686.33 support on the daily chart. A close below this level would reinforce the strong bearish trend indicated by the daily ADX and RSI, potentially triggering a cascade of sell orders as stop-losses are hit and fear sets in. This would open the door for a rapid descent towards the lower support levels, aligning with the prevailing bearish sentiment seen across multiple indicators.
Navigating the Current Cycle and Future Outlook
We are in a complex market cycle where traditional correlations are sometimes strained, and sentiment can be heavily influenced by macroeconomic news and speculative flows. The current Bitcoin price action around $62,929 reflects this complexity. While short-term charts show some bullish resilience, the longer-term daily trend remains bearish, a situation that requires careful risk management and a patient approach. The influence of the DXY and equity markets cannot be understated; any significant shifts in these markets will undoubtedly ripple through to Bitcoin.
Looking ahead, the key levels to watch remain the immediate resistance at $63,093.67 and the more significant daily resistance at $63,746.33. On the downside, the crucial support to monitor is $62,774.67 on the 1-hour chart, followed by the more critical daily support at $60,686.33. A decisive break above the former could signal a short-term bullish reversal, while a failure to hold the latter would confirm the continuation of the bearish trend. Investors and traders should remain vigilant, waiting for clearer signals and avoiding premature entries in this indecisive market environment. Patience, as always, is a virtue, especially when navigating the choppy waters of the current crypto market cycle.
Bearish Scenario: The Downtrend Continues
65% ProbabilityBullish Scenario: A Relief Rally Emerges
25% ProbabilityNeutral Scenario: Consolidation Around $62,929
10% ProbabilityFrequently Asked Questions: BTCUSD Analysis
What happens if BTCUSD breaks below the $60,686.33 support level?
A daily close below $60,686.33 would strongly confirm the bearish trend indicated by the daily ADX and RSI. This would likely trigger further selling pressure, potentially targeting the next support at $59,209.67.
Should I consider buying BTCUSD at current levels around $62,929 given the mixed signals?
Caution is advised. While the 1-hour chart shows some bullish momentum, the daily trend remains bearish. A confirmed breakout above $63,746.33 would be needed to signal a more reliable bullish setup, otherwise, risk of a pullback to lower support levels exists.
Is the RSI at 63.28 on the 1H chart a buy signal for BTCUSD?
An RSI of 63.28 on the 1-hour chart indicates neutral-to-bullish momentum, but it is not an outright buy signal, especially with the Stochastic Oscillator flashing overbought conditions. It suggests upward pressure but requires further confirmation from other indicators.
How will the current DXY strength at 99.83 potentially affect BTCUSD this week?
The rising DXY suggests a strengthening US dollar, which often correlates inversely with risk assets like Bitcoin. If the DXY continues to climb, especially towards the 100.00 mark, it could exert downward pressure on BTCUSD, limiting any potential upside.
Volatility creates opportunity - those prepared will be rewarded.
Navigating these choppy markets requires discipline; wait for clear setups and manage your risk diligently. The next trend will eventually reveal itself.
Track markets in real-time
AI-powered analysis, technical indicators and real-time price data.
Join Our Telegram Channel
Breaking market news, AI analysis and trading signals instantly.
Join Channel