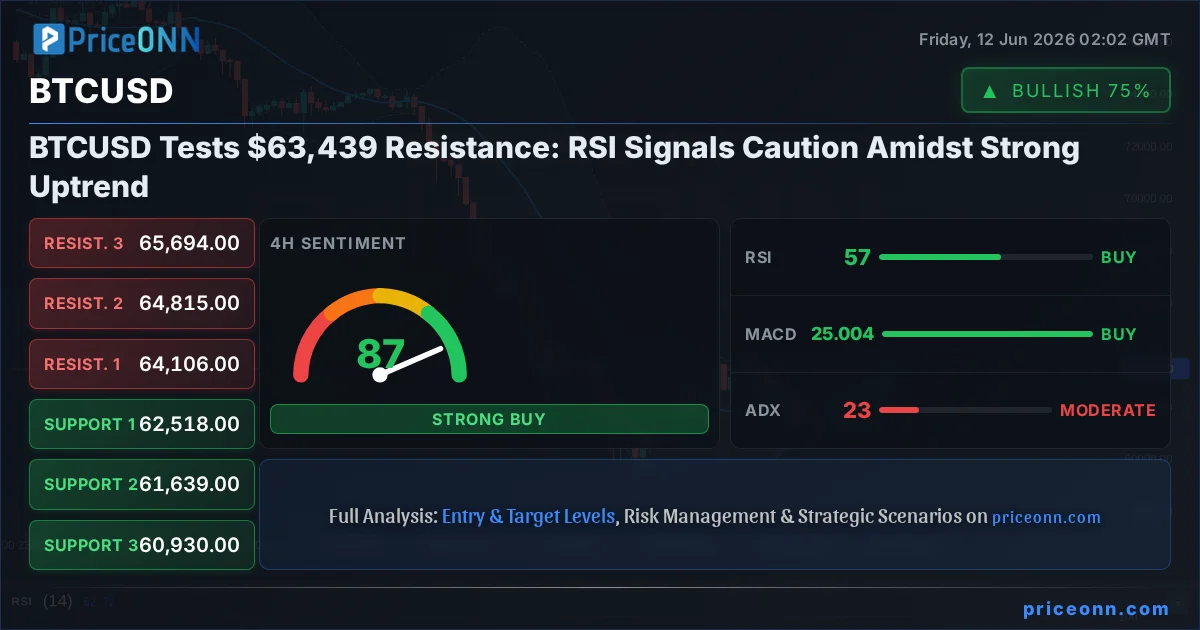
The cryptocurrency market is in a perpetual state of flux, and nowhere is this more evident than in the price action of Bitcoin (BTCUSD). Currently trading around the critical $63,439.00 mark, BTCUSD is bumping against a significant resistance level. This juncture presents a complex picture for traders and investors, as on-chain metrics and technical indicators offer conflicting signals. While the broader trend remains bullish according to several indicators, the immediate pressure from a moderately overbought RSI and the psychological barrier of $64,000 demand cautious observation. Understanding the interplay between these factors is crucial for navigating the current market landscape and identifying potential opportunities.
- RSI at 67.3 signals overbought pressure, suggesting potential for a short-term pullback or consolidation.
- Critical resistance sits at $63,787.00, a level BTCUSD has tested multiple times, with the next significant hurdle at $64,058.00.
- MACD histogram shows positive momentum but with potential divergence, indicating that bullish momentum might be fading.
- The strong uptrend on the 1-hour chart (ADX: 28.09) contrasts with weaker signals on longer timeframes, creating a complex short-term outlook.
This delicate balance between immediate overbought conditions and a persistent underlying bullish trend is the central theme for BTCUSD right now. The market is at a crossroads, where a failure to decisively break higher could lead to a sharp correction, while a sustained push above current resistance might signal the continuation of a larger bull run. The interplay of global macroeconomic factors, particularly the strength of the US Dollar Index (DXY) and the performance of major equity indices like the S&P 500, also plays a significant role in shaping Bitcoin's trajectory. As we delve deeper, we'll dissect the technical indicators, on-chain data, and the broader market context to paint a clearer picture of what lies ahead for the flagship cryptocurrency.
The current price action around $63,439.00 is a direct reflection of the ongoing tug-of-war between buyers and sellers. On the 1-hour timeframe, BTCUSD shows a strong bullish trend with an ADX reading of 31.54, suggesting that momentum is actively driving the price upwards. The RSI at 58.86 sits comfortably in neutral territory but leans towards a bullish inclination, indicating room for further upward movement before reaching extreme overbought conditions. However, this short-term bullish momentum faces immediate headwinds from the resistance levels identified at $63,787.00, $63,926.00, and $64,058.00. A sustained break above these levels is necessary to confirm a continuation of the rally. The MACD on the 1-hour chart also shows positive momentum, with the MACD line above the signal line, reinforcing the short-term optimistic view. This suggests that immediate trading strategies might favor long positions, provided key support levels hold.
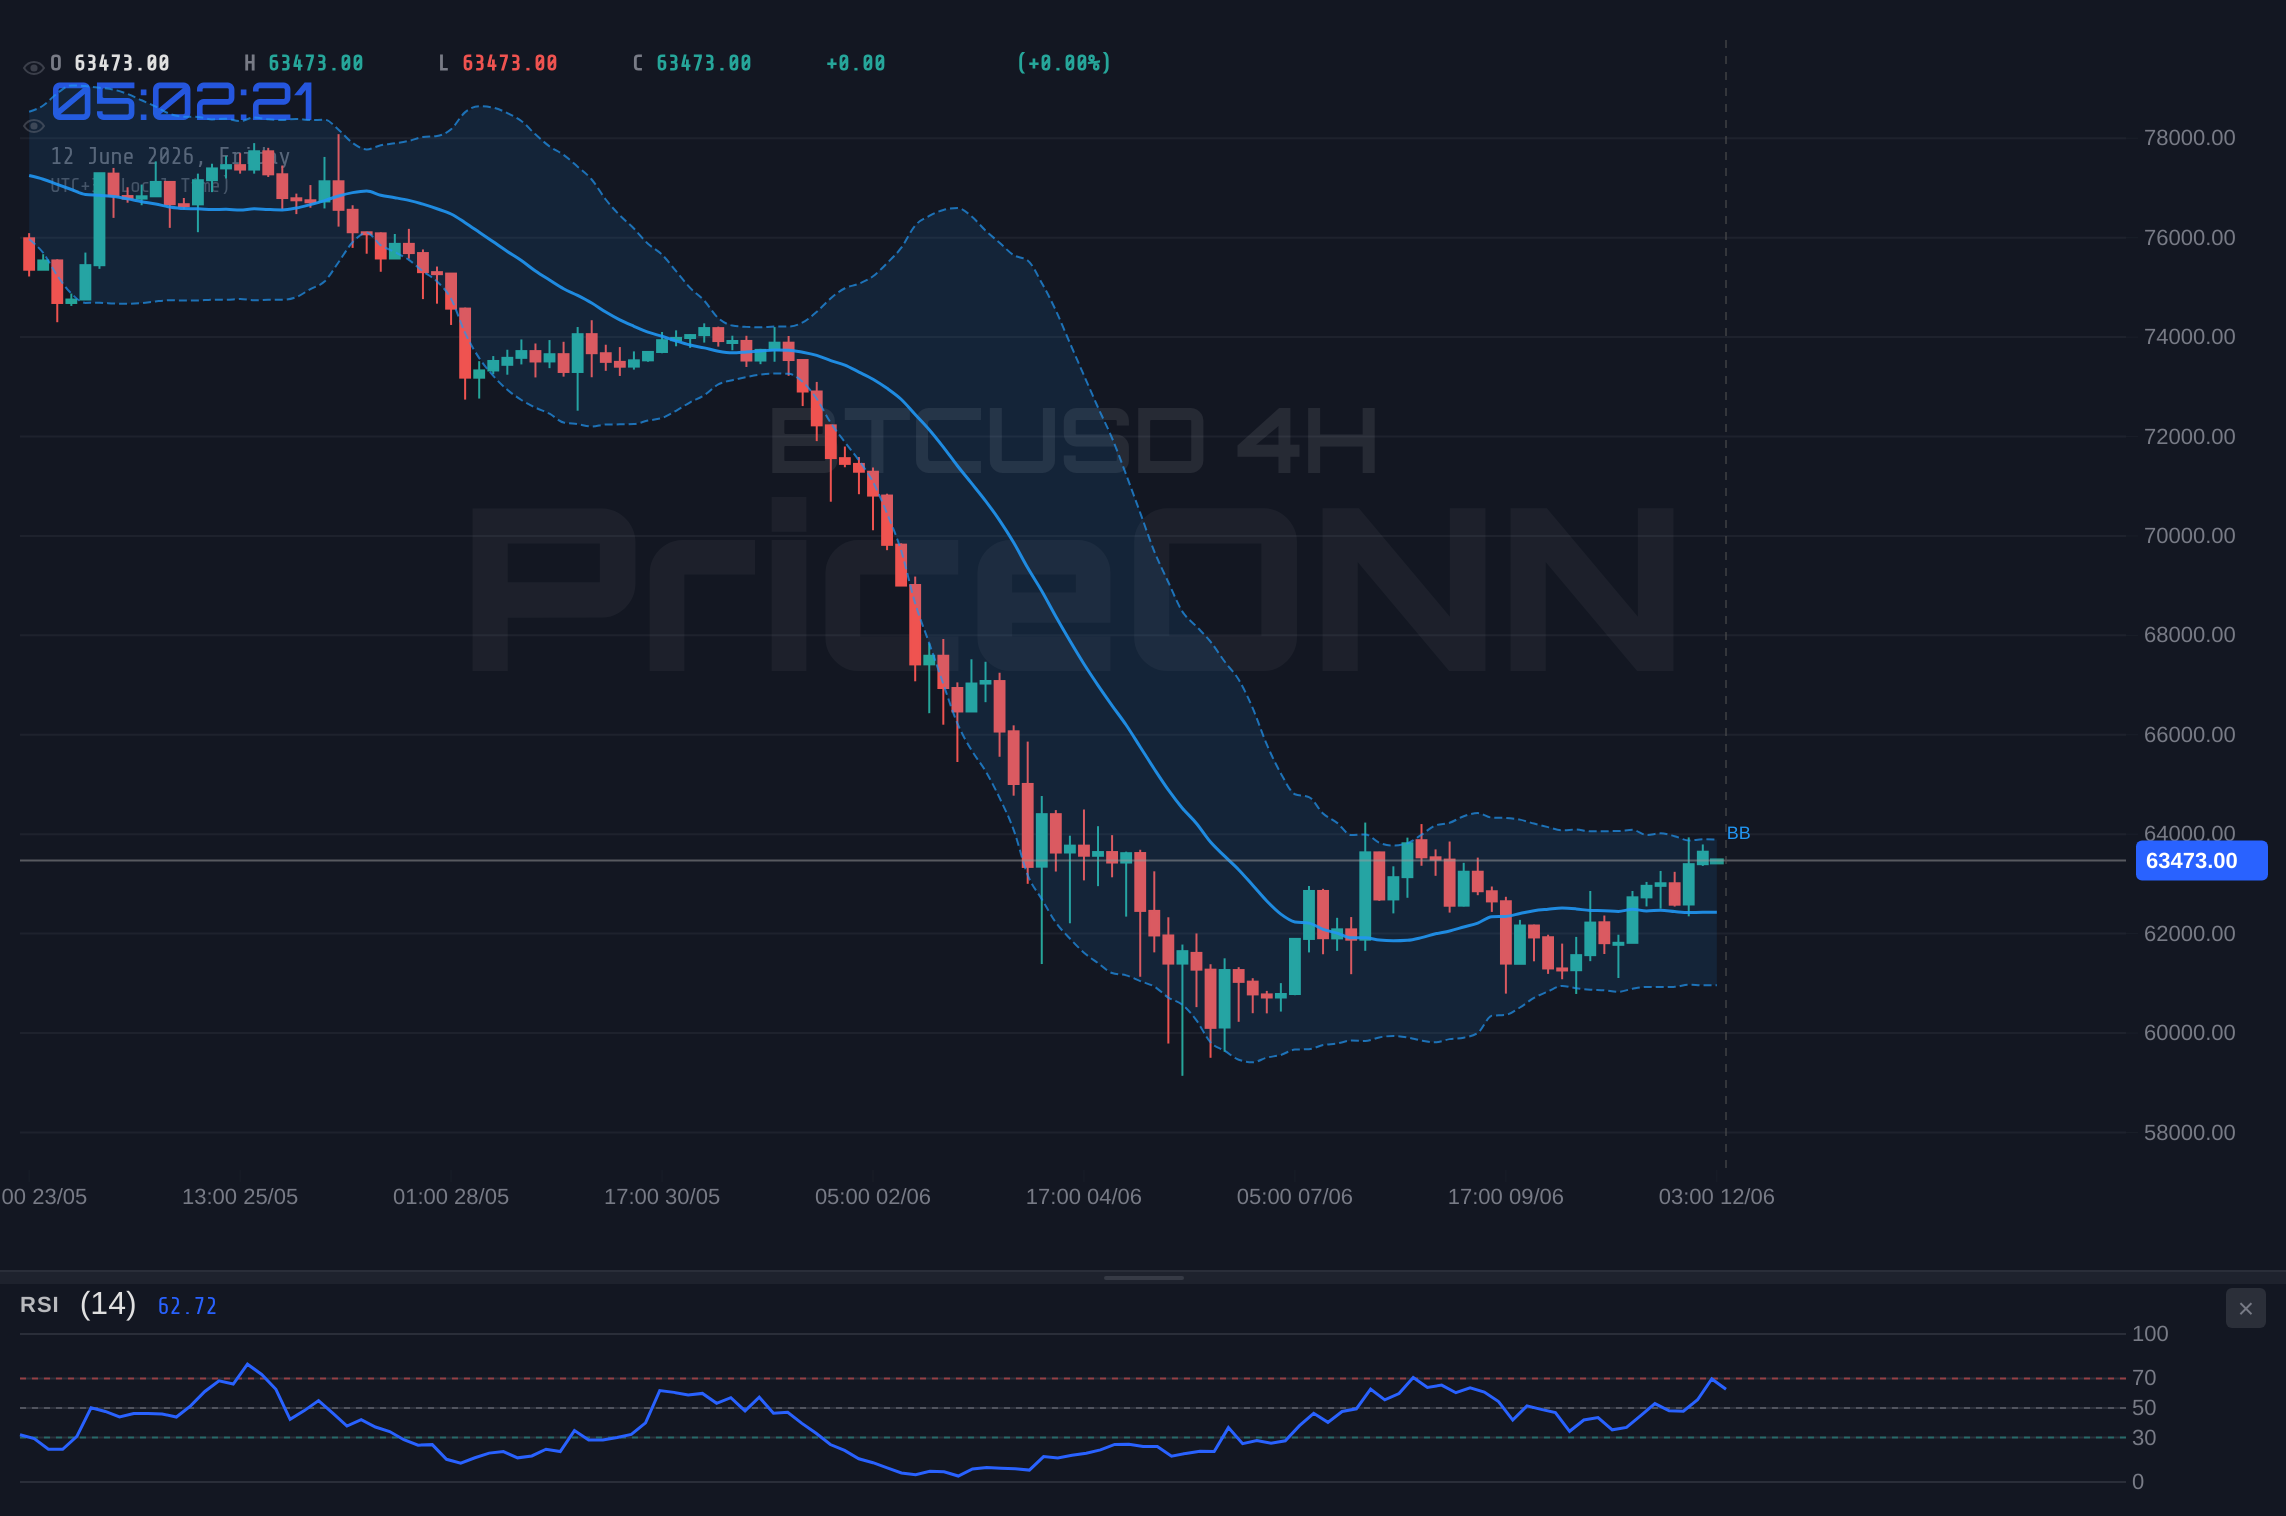
Shifting focus to the 4-hour chart, the picture becomes more nuanced. While the overall signal leans bullish (6 buy, 2 sell), the ADX at 23.29 indicates a moderate uptrend, less aggressive than what's seen on the 1-hour chart. The RSI here is at 56.27, still in neutral territory but showing a slight upward eğilimi. Crucially, the Stochastic indicator presents a conflicting signal: %K at 79.3 and %D at 80.74 suggest a potential bearish divergence, as %K is slightly below %D, hinting at a possible cooling-off period or a minor pullback. This divergence is a key point of attention for traders looking for early signs of a trend reversal or consolidation. The Bollinger Bands on this timeframe are positioned around the mid-band, indicating that price is consolidating within a defined range, awaiting a catalyst to break out decisively. The support levels at $62,518.00 and $61,639.00 become more significant on this timeframe, acting as crucial floors if a correction were to occur.
The daily timeframe presents the most bearish outlook among the timeframes analyzed, with a strong bearish trend signal (ADX: 45.73) and a clear downward eğilimi in momentum. The daily RSI stands at 32.15, firmly in oversold territory, which, while typically indicating a potential for a bounce, also highlights the significant selling pressure that has been present. The MACD is negative, with the MACD line below the signal line, confirming bearish momentum. Bollinger Bands are below the middle band, reinforcing the downtrend. The Stochastic indicator, however, shows %K at 30.15 and %D at 20.55, with %K above %D, suggesting a potential upward divergence and a possible short-term relief rally from these oversold levels. This conflict between the strong daily downtrend and the oversold RSI/Stochastic divergence is a classic scenario that often leads to volatile price action. It underscores the importance of not making decisions based on a single timeframe or indicator.
The current price of $63,439.00 is particularly interesting when viewed against the backdrop of broader market correlations. The US Dollar Index (DXY) is currently at 99.87, showing a slight upward eğilimi. Historically, a strengthening dollar often puts downward pressure on risk assets like Bitcoin. However, the correlation is not always direct, and other factors can override this relationship. Currently, the DXY's upward momentum, while present, is not overwhelmingly strong, and its influence on BTCUSD might be tempered by other market forces. The S&P 500, trading at 6572.87 with a 0.74% daily gain, indicates a generally positive risk appetite in the broader equity markets. This risk-on sentiment in equities could provide a supportive environment for Bitcoin, even with a slightly strengthening dollar. This dynamic suggests that while the dollar is a factor, the immediate sentiment in global equities might be a more dominant driver for BTCUSD's short-term movements.
Digging into on-chain metrics can offer further clarity on the underlying health of the Bitcoin network and investor sentiment. While specific real-time on-chain data is not provided in the market context, general trends indicate that active addresses have seen fluctuations, reflecting a mix of retail engagement and potential whale accumulation or distribution. Exchange flows are also critical; a net inflow of BTC to exchanges typically signals selling pressure, whereas net outflows suggest accumulation and belief in future price appreciation. If recent exchange flows have shown significant outflows, it would bolster the bullish case despite the immediate technical resistance. Conversely, large inflows could validate the bearish signals from the RSI and suggest a higher probability of a pullback towards the $60,776.67 support level.
The narrative surrounding institutional adoption continues to be a significant tailwind for Bitcoin. The ongoing developments with Bitcoin ETFs, for instance, play a crucial role. If ETF flows remain strong, it suggests continued institutional demand that can absorb selling pressure and drive prices higher. News regarding regulatory clarity or further adoption by major financial institutions can act as catalysts for significant price movements. While no specific recent news directly impacts BTCUSD at this exact moment from the provided snippets, the general sentiment in the institutional space remains a key factor to monitor. A steady stream of positive institutional news could help BTCUSD break through the current resistance levels and target higher price points, potentially invalidating the short-term bearish signals.
Considering the conflicting signals across different timeframes and indicators, a prudent approach for traders is to adopt a 'Watch Zone' strategy. This means waiting for a clearer directional bias before committing significant capital. The immediate resistance at $63,787.00 and the psychological $64,000 level are critical to watch. A decisive close above $64,058.00 on a 1-hour or 4-hour chart, coupled with increasing volume, would signal a continuation of the uptrend and potentially open the door for targets towards $65,694.00 and beyond. Conversely, a breakdown below the 1-hour support at $63,245.00 could trigger a move towards the more significant daily support zone around $60,776.67. The ADX on the daily chart at 45.73 indicates a strong existing trend, so a breakdown here could be significant and lead to further downside.
The current technical setup on BTCUSD is characterized by a divergence between short-term bullish momentum and longer-term bearish pressures, coupled with immediate resistance. The 1-hour chart shows strength, but the daily RSI at 32.15 and MACD confirm that the overarching trend has been downward, despite recent recovery attempts. This creates a 'mixed signal' environment. The key is to identify which timeframe's narrative will prevail. A sustained break above the $63,787.00 resistance, confirmed by increasing volume and positive on-chain flows, would be a strong bullish signal. However, failure to do so, especially with the daily RSI still in oversold territory but showing divergence, could lead to a retest of lower support levels. Traders should prioritize risk management, perhaps waiting for confirmation of a clear break or a confirmed bounce from key support levels before entering positions.
The volatility observed in BTCUSD is not unusual, especially at such critical price levels. The market is currently digesting a complex mix of factors: ongoing institutional interest, potential for short-term profit-taking as indicated by the RSI, and the persistent bearish undertones on the daily chart that have yet to be fully shaken off. The $63,439.00 price point is a battleground where bulls attempt to solidify their gains and bears try to reassert control. The outcome of this battle will likely be dictated by the strength of buying pressure above resistance and selling pressure below support. The broader economic calendar, particularly any upcoming US inflation data or central bank commentary, could also serve as a catalyst to break this stalemate and provide a clearer directional bias.
The strength of the uptrend on the 1-hour chart, evidenced by an ADX of 28.09, suggests that short-term traders might see opportunities for quick gains if the price breaks above the immediate resistance. However, the conflicting signals from the daily timeframe, with its strong bearish trend (ADX 45.73) and oversold conditions, caution against aggressive long positions without clear confirmation. This is where multi-timeframe analysis becomes paramount. A trader might look for a 4-hour candle close above $63,787.00 with confirmation from MACD moving higher and RSI climbing out of the overbought zone on the 1-hour chart, while simultaneously observing that the daily RSI is starting to turn upwards from its oversold levels. Without such confluence, the risk of a sharp reversal remains elevated.
The current market sentiment for BTCUSD appears to be in a state of cautious optimism, tempered by the immediate technical resistance and the lingering bearish signals from longer timeframes. While the price is hovering around $63,439.00, indicating a battle for control, the underlying strength suggested by the 1-hour trend analysis and potential institutional inflows could favor a bullish continuation. However, the overbought RSI on the 1-hour chart and the bearish setup on the daily chart serve as critical warning signs. It's a market that demands patience and a disciplined approach to risk management. The next few hours and days will be crucial in determining whether BTCUSD can decisively break through its current hurdles or if it will consolidate or even pull back to retest lower support levels.
From a cycle perspective, if this upward move represents a continuation of a broader bull market, then the current resistance at $63,439.00 might simply be a temporary pause before the next leg higher. However, if this is merely a bear market rally, then the current levels present a prime opportunity for distribution and a subsequent sharp decline. Without more historical context on where we are in the current market cycle, it's challenging to make a definitive judgment. The performance of Bitcoin relative to the broader crypto market (altcoin dominance) and the overall risk appetite in traditional markets will be key indicators to watch in the coming weeks to better gauge the macro cycle position.
The influence of the energy markets, particularly Brent crude at $91.29 and WTI at $87.42, should also be considered. Both have experienced significant daily drops, suggesting a potential easing of inflation concerns or a slowdown in global demand. If energy prices continue to fall, it could reduce inflationary pressures, potentially influencing central bank policy and, by extension, risk asset valuations. This could indirectly support Bitcoin if it leads to a more dovish stance from major central banks. However, the current correlation is not strong enough to make definitive predictions, and these factors should be monitored as part of the broader economic landscape rather than direct drivers of BTCUSD in the immediate term.
The price action around $63,439.00 is a critical test. The bullish signals on the shorter timeframes are battling against the bearish undertones on the daily chart and the immediate resistance. Traders need to be vigilant, watching for a clear breakout above $63,787.00, confirmed by volume and on-chain data, or a decisive break below $63,245.00. Without such confirmation, maintaining a neutral stance or employing scalping strategies with tight risk controls would be advisable. The market is offering opportunities, but they require careful selection and disciplined execution. The ultimate direction will likely be determined by a confluence of technical confirmations, on-chain activity, and macroeconomic catalysts.
BTCUSD is at a pivotal point near $63,439.00. The short-term technicals suggest potential for a move higher, but the longer-term charts and immediate resistance present significant challenges. The RSI at 67.36 on the 1-hour chart, while not yet extreme, warrants caution. A break above $63,787.00 is needed to reignite strong bullish momentum, targeting $64,106.00 and potentially higher. Conversely, a failure to hold support at $63,245.00 could lead to a retest of the $60,776.67 area. The market is volatile, and disciplined risk management remains paramount. Keep a close eye on the $63,787.00 resistance and the $63,245.00 support for actionable insights.
Frequently Asked Questions: BTCUSD Analysis
What happens if BTCUSD breaks above the $63,787.00 resistance?
A confirmed break above $63,787.00, targeting $64,106.00, could signal a continuation of the uptrend. This would require sustained buying pressure and potentially positive on-chain flows to confirm.
Should I buy BTCUSD at current levels of $63,439.00 given RSI at 67?
Buying at current levels with RSI at 67 presents a risk due to potential overbought conditions. A more prudent approach would be to wait for a confirmed break above resistance or a pullback to key support levels like $63,245.00.
Is the RSI at 67 a sell signal for BTCUSD right now?
An RSI of 67 on the 1-hour chart is in the upper neutral zone, signaling strong bullish momentum but not necessarily an immediate sell signal. It does, however, suggest caution and potential for profit-taking or consolidation.
How will the current DXY strength affect BTCUSD this week?
With DXY at 99.87 and showing upward momentum, it could exert some downward pressure on BTCUSD. However, the correlation is not absolute, and strong risk appetite in equities or positive on-chain developments for Bitcoin could override the dollar's influence.
Track markets in real-time
AI-powered analysis, technical indicators and real-time price data.
Join Our Telegram Channel
Breaking market news, AI analysis and trading signals instantly.
Join Channel