Twenty-four. That is the BTCUSD RSI reading on the daily chart right now - a number that has not appeared in Bitcoin's technical picture in quite some time. With price sitting at $61,345 and the broader sell-off stripping nearly $2,143 off today's value alone, the question every crypto trader is asking is straightforward: is this capitulation, or just the beginning of something far uglier?
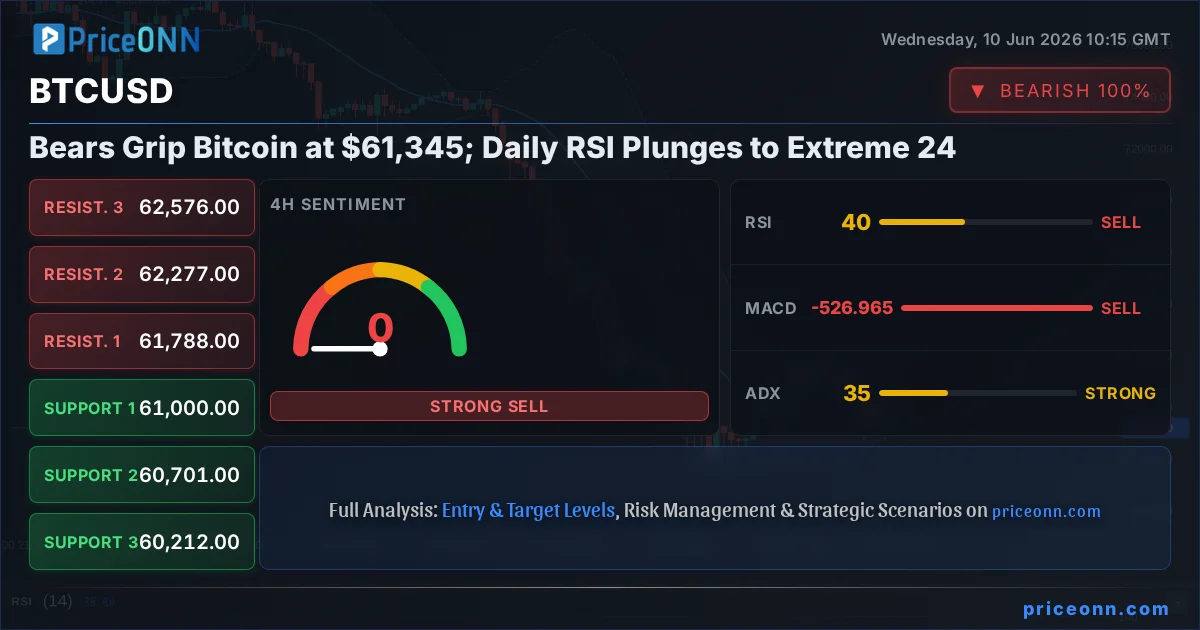
- BTCUSD is trading at $61,345, down 3.38% on the day, with daily RSI plunging to an extreme oversold reading of 24.62 - one of the lowest levels in this market cycle.
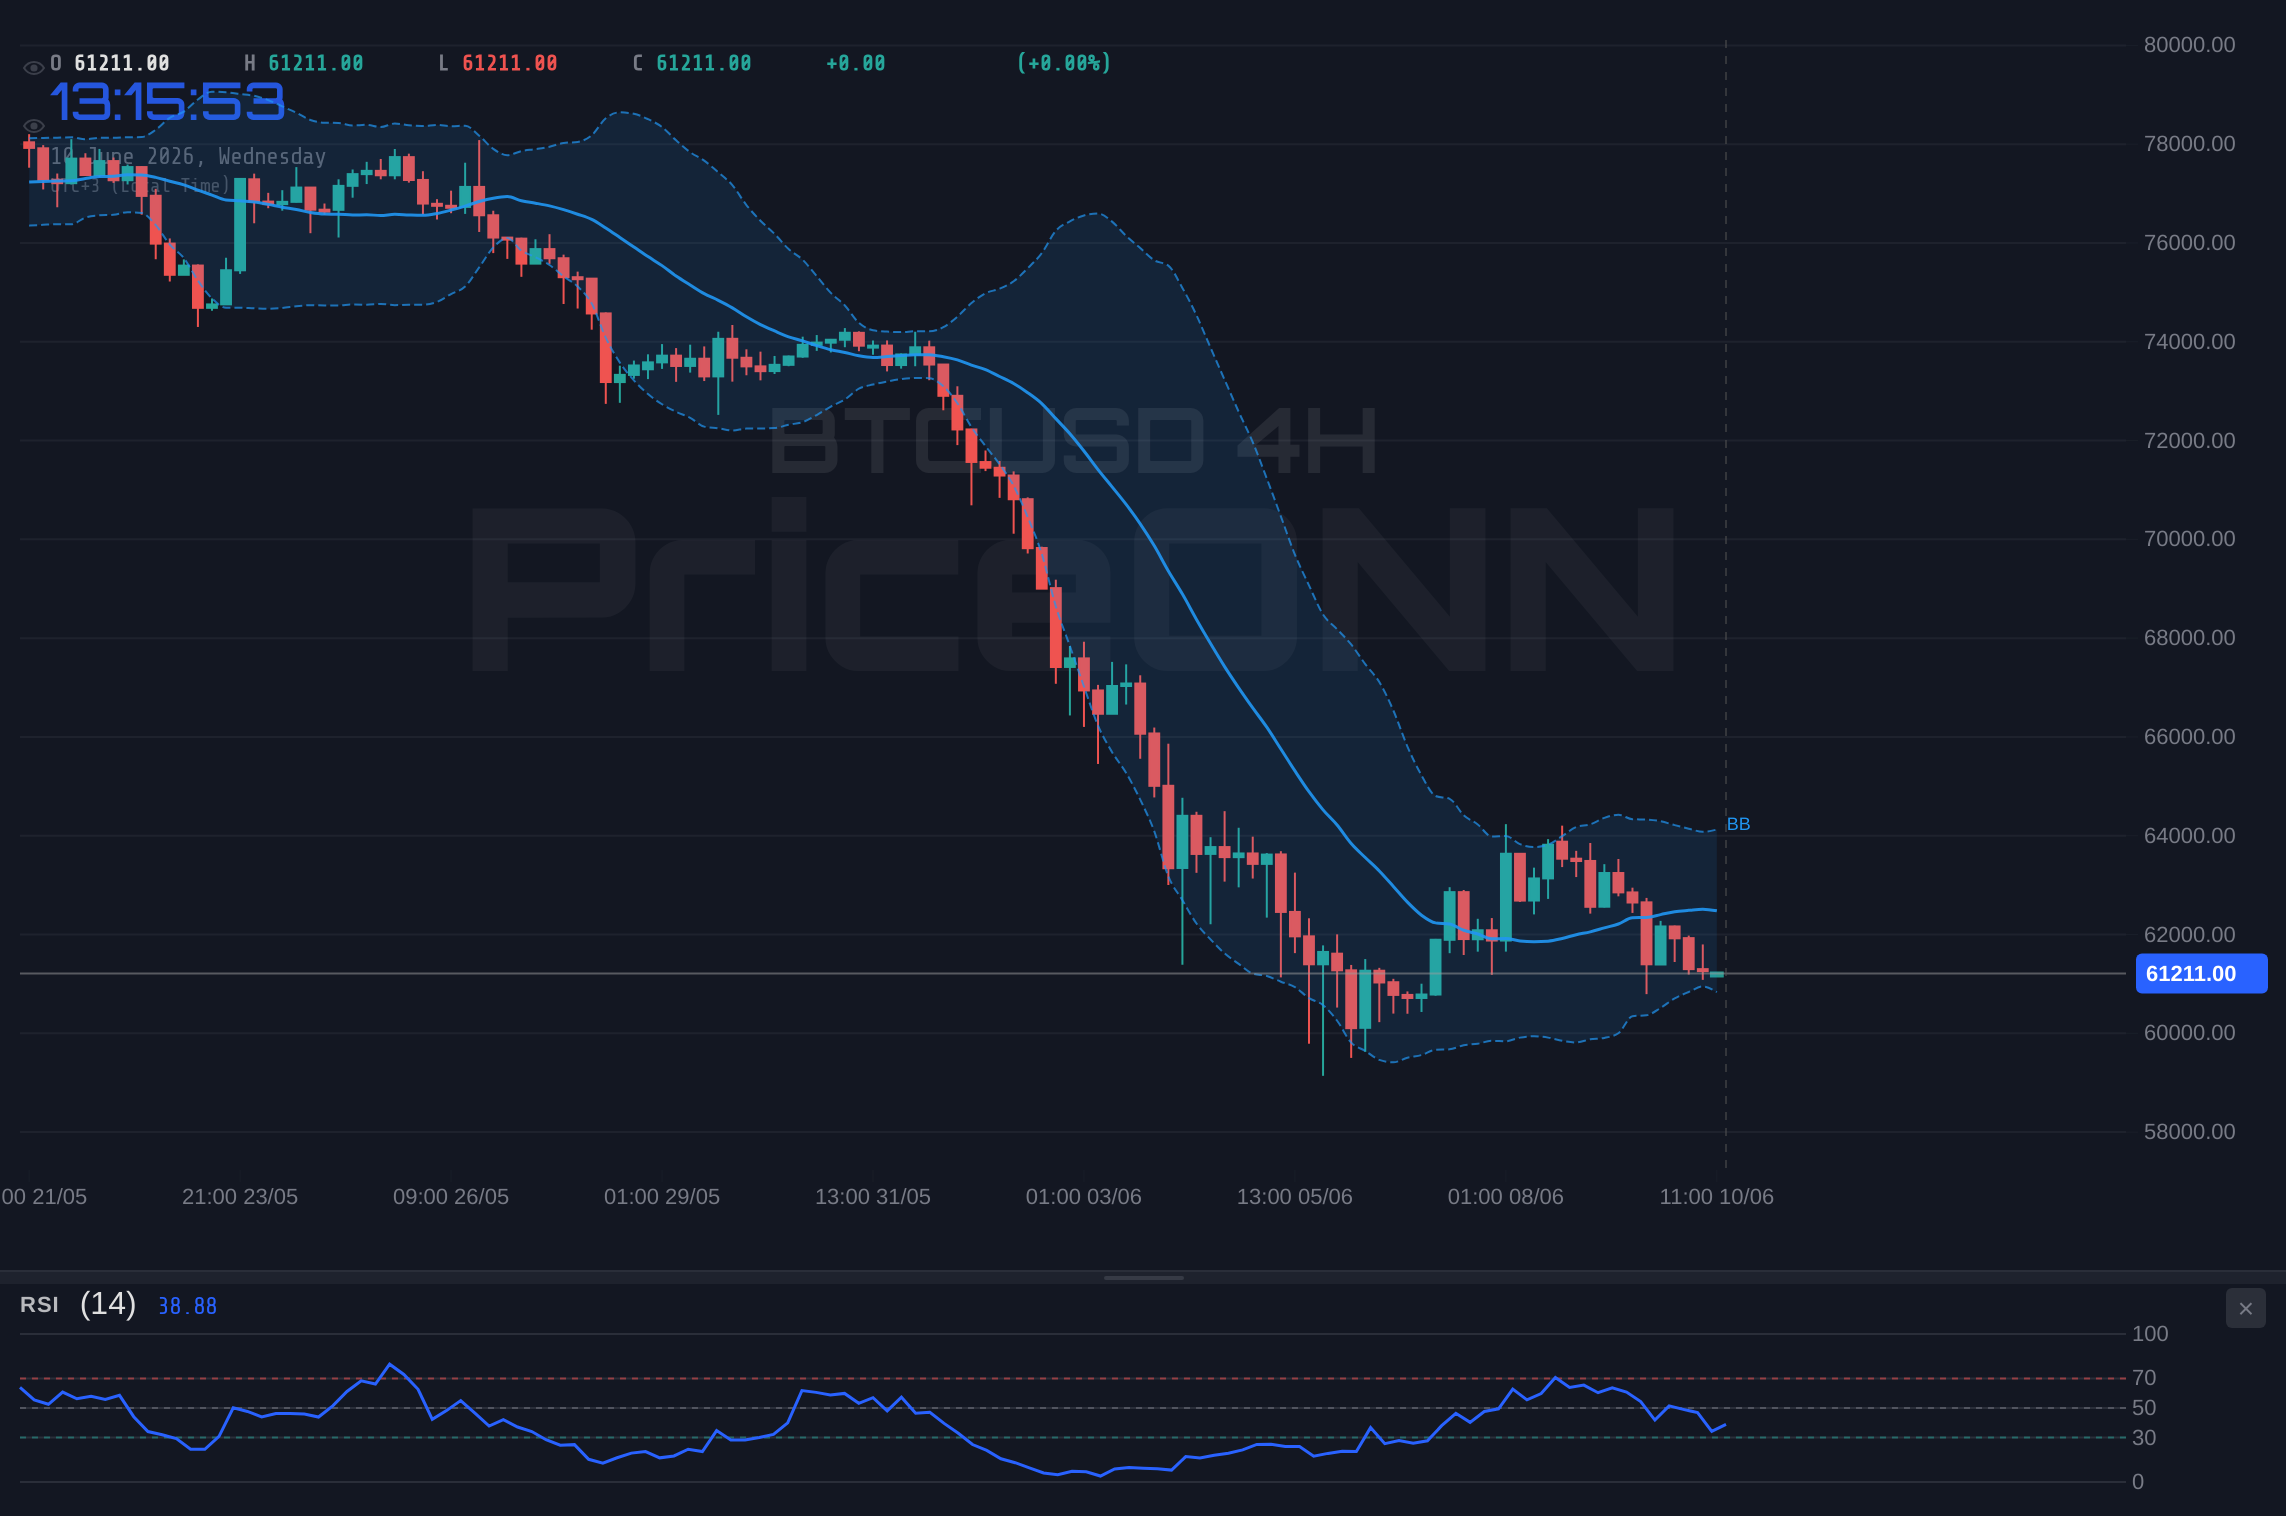
- Critical near-term support sits at $61,000 on the 4H chart; a confirmed close below this level opens the path to $60,545 and then $59,436.
- The daily ADX at 44.78 signals a very strong downtrend firmly in control - this market is not set up for reversal without a significant catalyst.
- US CPI data is the macro wildcard: a hot print accelerates the bearish case toward $60,545, while a soft reading could spark the oversold bounce implied by RSI 24.
This is exactly the kind of setup that divides the market. On one hand, RSI 24.62 on the daily is statistically extreme - historically, when Bitcoin's daily RSI dips this deep, counter-trend bounces tend to follow within days. On the other hand, the ADX at 44.78 on the daily chart signals that the bears are not finished. This is not a market gently correcting. Trend strength is formidable, momentum has turned decisively negative across all timeframes, and the 4H signal count of 0 buy versus 8 sell leaves little room for interpretation in the near term.
Time Horizon: This BTCUSD today analysis covers the intraday through the next 5-7 trading days, with primary focus on the 4H and daily charts.
Adding macro context: this BTCUSD price forecast arrives amid a broader market crosswind. The Nasdaq100 is down 2.22% to 28,737 while the SP500 manages a 0.74% gain to 6,572 - an unusual divergence suggesting capital rotation rather than wholesale risk-off selling. Ethereum is tracking Bitcoin lower at $1,623, down 3.79%, confirming this is a crypto-specific move rather than a pure macro event. Meanwhile, the DXY sits at 99.6, essentially flat, which removes the dollar strength narrative as the primary culprit. The selling here appears internally driven within the crypto market structure.
Traders are also positioning cautiously ahead of US CPI data. Reuters reported this week that markets are in a guarded stance following Friday's blowout employment report. As noted in overnight coverage, AUD/USD faces a breakdown if US core CPI tops 3% - and Bitcoin is subject to the same macro logic. A stronger-than-expected inflation print could seal the case for a prolonged Fed hold, extending pressure on risk assets. A benign print might be the catalyst the oversold RSI has been waiting for.
The $61K Ledge; What BTCUSD Multi-Timeframe Analysis Reveals
Dissecting BTCUSD support and resistance across timeframes paints a consistently bearish picture. On the 1H chart, the immediate floor sits at $61,042 - just $303 below current price. Below that, $60,821 and $60,472 represent the next lines of defence. The 4H chart adds important context: $61,000 is a clean psychological level aligned with 4H support structure, and a close below it on a 4H candle would carry significant technical weight. The daily support levels tell an even harder story - the first notable daily support at $60,545 represents approximately $800 of additional downside from current prices.
On the resistance side, recovery attempts will immediately face $61,612 on the 1H chart, followed by $61,961 and $62,182. The 4H resistance cluster begins at $61,788, with $62,277 and $62,576 forming the next barrier zone. The fact that Bitcoin needs to clear three resistance layers just to recover today's intraday losses speaks to how heavy overhead supply has become.
The indicator picture requires careful reading because it contains a genuine conflict. Daily RSI at 24.62 is technically an oversold signal - that is objective and verifiable. But the daily ADX at 44.78 tells a different story: the downtrend is intensely structured and gaining momentum rather than losing it. When these two signals collide, the ADX typically wins in the short term. Markets can remain oversold far longer than logic dictates when the trend has this kind of velocity and structure behind it.
The daily Stochastic does offer one nuance worth examining: with %K at 20.49 and %D at 14.63, the %K crossing above %D is technically a bullish hook in oversold territory. This pattern sometimes precedes bounces. But with the daily MACD firmly in negative momentum territory, confirmation of a reversal is still missing. The 1H MACD showing positive momentum creates a short-term stabilization signal, but until the 4H MACD crosses back into positive territory, this reads as temporary price stabilization rather than structural trend reversal.
The Bull's Roadmap; How $61K Becomes the Launch Pad
Let us build the optimistic case honestly. For bulls to take back control of BTCUSD market sentiment, a very specific sequence needs to play out. First, Bitcoin needs to hold the $61,000 level on a closing 4H basis. A mere intraday test is not sufficient - a clean 4H close above $61,000 is the minimum floor that would give dip buyers real confidence. Short-covering alone could produce a brief squeeze, but without that candle close, any bounce lacks technical credibility.
From there, the first critical resistance to clear is $61,612 on the 1H chart. Sustained movement above this level would be the first real indication that intraday selling pressure has exhausted itself. The 4H resistance at $61,788 sits just above, and a daily close above this zone would begin to change the near-term narrative meaningfully.
If US CPI data comes in cooler than expected, the macro catalyst for a relief rally exists. Historical BTCUSD price action shows that when the daily RSI reaches the low 20s and a macro negative-for-dollar surprise arrives simultaneously, sharp counter-trend moves of 3-5% within 48-72 hours are well-documented. Combine that with the daily Stochastic hook already forming, and the bounce setup is at least plausible - even if it is not yet probable.
A 4H close above $61,788 with expanding volume would be the first concrete confirmation that the oversold bounce has traction. A daily close above $62,277 would open the path toward the $62,576 to $64,596 recovery zone, representing a full technical reset from the current breakdown structure.
The BTCUSD breakout scenario requires patience and specific confirmation. The daily Stochastic hook needs MACD support before it qualifies as a reversal signal. Until the 4H MACD crosses back into positive territory alongside a sustained hold above $61,000, this remains a watch zone rather than an actionable long setup. A daily close above $62,277 would be the signal that changes the probability calculus meaningfully for bulls.
Where Bears Take Full Control; The Pressure Points Below $61K
The bearish case for BTCUSD is well-supported by the weight of cross-timeframe evidence. On the 4H chart, all 8 signals are sell. On the daily, 6 of 8 signals are sell. The daily ADX at 44.78 is not a trend that is fading - it is a trend that is building. Selling pressure has structural momentum behind it that oscillators alone cannot override.
A daily close below $61,000 would be the confirmation bears are waiting for. This psychological level, combined with 4H chart support structure, represents the last meaningful defence before a move toward $60,545 - the next significant daily support level. Below $60,545, the $59,436 level comes into focus, representing approximately 3.1% additional downside from current prices.
The macro context supports this scenario. Bloomberg data consistently shows that crypto assets underperform when real rate expectations shift hawkish, and with markets already pricing in a cautious Fed following last Friday's strong employment number, Bitcoin is vulnerable to any additional inflationary surprise. The DXY at 99.6 is sitting below the 100 psychological level - a push above that threshold driven by hot CPI data would create meaningful additional headwinds for risk assets including crypto.
A 4H close below $61,000 with the ADX trend continuing to accelerate above 45 would signal that oversold conditions alone cannot halt the decline. In strong trends, RSI can remain under 30 for extended periods. The $60,212 level on the 4H chart becomes the next meaningful downside target in this scenario, with $59,436 as the deeper daily support below that.
There is another dimension worth examining for the bearish scenario: the daily Bollinger Band picture. Price is currently below the middle band on all timeframes, and the daily chart shows price trading below the lower band - a pattern consistent with breakdown momentum, not base-building. Lower Bollinger Band violations in strongly trending markets often see price walk the band lower before any meaningful recovery develops. The numbers support the bears here, and the charts are consistent across every indicator framework being applied.
One more consideration: the Nasdaq100 dropping 2.22% to 28,737 on the same session - while the broader SP500 actually rises - suggests selective tech and growth asset selling. Bitcoin has historically correlated with Nasdaq during stress periods more than with the broader market. If tech selling persists and the Nasdaq continues to underperform, Bitcoin loses one of its traditional macro recovery props.
The Grinding Range Play; When RSI and ADX Cancel Each Other Out
The third scenario acknowledges the genuine tug-of-war between extreme oversold conditions and strong trend momentum. Bitcoin could grind sideways in a choppy range between $60,701 and $61,961, exhausting both bulls and bears while the market waits for the CPI catalyst to resolve the directional debate.
This is not an uncommon outcome when daily RSI reaches the low 20s within a high-ADX trend. The market becomes directionally stalled - sellers know the trend is down, buyers see statistical value at RSI 24, and the result is whipsaw price action with false breakouts in both directions. Stop hunts become more frequent, liquidity grabs above and below key levels increase, and net directional progress stalls. For traders, this scenario is arguably the most dangerous of the three because risk-reward ratios deteriorate sharply in messy consolidation phases following strong trend moves.
The CPI release would serve as the resolution mechanism for this range. Either the data gives bears the macro confirmation they need to push through $61,000, or it gives bulls the relief catalyst to attempt a recovery above $61,788. Without an external catalyst, the competing technical forces could keep Bitcoin range-bound for 24-48 hours before resolution.
BTCUSD Volatility Analysis; Which Scenario Wins and Why
Bearish Continuation: Bears Press the Advantage
60% ProbabilityBullish Reversal: The RSI 24 Counter-Move
20% ProbabilityRange-Bound Chop: Caught Between Competing Signals
20% ProbabilityThe 60% bearish probability reflects the comprehensive weight of evidence from BTCUSD trend analysis across all timeframes. When 4H signals are uniformly bearish at 0 buy versus 8 sell, daily signals are predominantly bearish at 2 buy versus 6 sell, and trend strength as measured by ADX stands at 44.78 on the daily, the path of least resistance remains lower. The 20% bullish probability acknowledges the statistical rarity of RSI 24 and the potential for a macro catalyst to ignite short-covering. An equal 20% neutral probability captures the genuine ambiguity created by competing signals at an important structural level.
What the MACD Signal Tells Us About BTCUSD Trend Analysis Right Now
The 1H MACD showing positive momentum while 4H and daily MACD remain negative is a classic multi-timeframe divergence pattern that deserves careful interpretation. The 1H positive MACD suggests the immediate selling impulse is losing intraday velocity - short-term stabilization is plausible and even likely. But until the 4H MACD crosses into positive territory, this stabilization is more likely to produce a short-lived relief bounce than a genuine trend reversal. Scalpers working 1H charts may find small tactical long opportunities with tight stops near $60,472, but swing traders should maintain bearish bias on any rally toward the $61,788 to $62,277 cluster.
The Stochastic picture on the daily adds one more layer of nuance: %K at 20.49 crossing above %D at 14.63 in deeply oversold territory is an early-stage reversal hook. This same pattern has historically been associated with Bitcoin bounces within a week when found at similar RSI extremes. But it needs MACD confirmation and a structural hold above $61,000 to qualify as an actionable signal rather than a false dawn. Price action analysis without indicator confluence gets traders caught in mean-reversion traps during high-ADX environments, and 44.78 is a high-ADX environment by any standard.
| Indicator | 1H Value | 4H Value | 1D Value | Signal |
|---|---|---|---|---|
| RSI (14) | 40.53 | 40.62 | 24.62 | Extreme Oversold (1D) |
| MACD | Positive | Negative | Negative | Bearish (4H/1D) |
| Stochastic %K/%D | 45.06 / 33.17 | 22.57 / 29.16 | 20.49 / 14.63 | Daily Bullish Hook Forming |
| ADX | 29.87 | 34.89 | 44.78 | Very Strong Downtrend |
| Overall Signal | SAT (2/6) | SAT (0/8) | SAT (2/6) | Sell Across Timeframes |
What I'm Watching; Three BTCUSD Trading Signals That Matter This Week
Three specific triggers will determine which scenario plays out in the days ahead:
- US CPI Data: This is the macro wildcard that overrides short-term technicals. A core CPI print above 3% would likely push the DXY above the 100 psychological level from its current 99.6 and remove any near-term Fed rate cut optionality, accelerating the bearish scenario toward $60,545. A reading at or below 2.8% creates the soft landing narrative that Bitcoin needs to pair the technical oversold condition with a macro catalyst for a relief rally. There is limited middle ground here - the data will decide direction more than any technical signal in isolation.
- 4H Close Below $61,000: This is the technical line in the sand. A clean close on the 4H chart below this level confirms that even the short-term support floor has given way, and the next meaningful cluster at $60,545 to $60,212 becomes an active downside target. Until this level breaks on a closing basis, the base-building thesis remains technically alive - improbable given the indicator weight, but alive.
- Daily MACD Crossover Confirmation: A confirmed bullish MACD cross on the daily chart, combined with RSI holding above 25 and Stochastic maintaining the %K above %D hook, would be the most significant reversal signal available. This has not yet occurred. When and if it does above the $61,000 level, it historically marks the beginning of the recovery phase after extreme oversold BTCUSD market sentiment conditions. That is the signal long-term positioned buyers are waiting for before committing meaningful capital.
Frequently Asked Questions: BTCUSD Analysis
Is Bitcoin's daily RSI at 24.62 a reliable buy signal for BTCUSD right now?
RSI at 24.62 on the daily chart is statistically extreme oversold territory, but it does not guarantee an immediate price reversal. The daily ADX at 44.78 indicates the downtrend carries significant structural momentum, meaning Bitcoin can remain oversold longer than expected in strong trends. Look for a daily MACD crossover and a confirmed 4H close above $61,788 before treating the RSI reading as a validated buy trigger rather than a falling knife signal.
What happens to BTCUSD price if it closes below the $61,000 support level on the 4H chart?
A confirmed 4H close below $61,000 removes the key psychological support floor and opens the path toward the next significant daily support at $60,545. A further breakdown through $60,545 would expose Bitcoin to a test of $59,436 - approximately 3.1% below current price. This bearish acceleration scenario becomes highest-probability if US CPI data comes in above expectations and reinforces the Fed's cautious stance on rate cuts, compounding the technical breakdown with macro headwinds.
Why does the 4H ADX at 34.89 matter more than RSI for BTCUSD trend analysis right now?
An ADX reading above 30 on the 4H chart confirms a strongly trending rather than ranging market environment, and at 34.89, trend-following strategies carry a statistical edge over mean-reversion entries based on oversold oscillators. Markets in strong trends routinely see RSI remain oversold for multiple days before a genuine reversal begins, making ADX the more reliable directional filter when the two conflict. Traders who enter long based purely on RSI 24 without ADX confirmation risk being caught in a continuation move rather than a reversal.
How will the upcoming US CPI data impact BTCUSD price this week?
Bitcoin's sensitivity to macro inflation data has grown substantially as institutional participation through spot ETFs has increased, creating tighter correlations with rate expectations. A US core CPI reading that surprises to the upside would likely push the DXY above 100 from its current 99.6 level, removing near-term Fed rate cut pricing and extending the crypto selloff toward $60,545. A softer-than-expected print could pair with the extreme daily RSI oversold condition to produce a sharp short-covering rally that initially targets the $61,788 resistance level.
Track markets in real-time
AI-powered analysis, technical indicators and real-time price data.
Join Our Telegram Channel
Breaking market news, AI analysis and trading signals instantly.
Join Channel