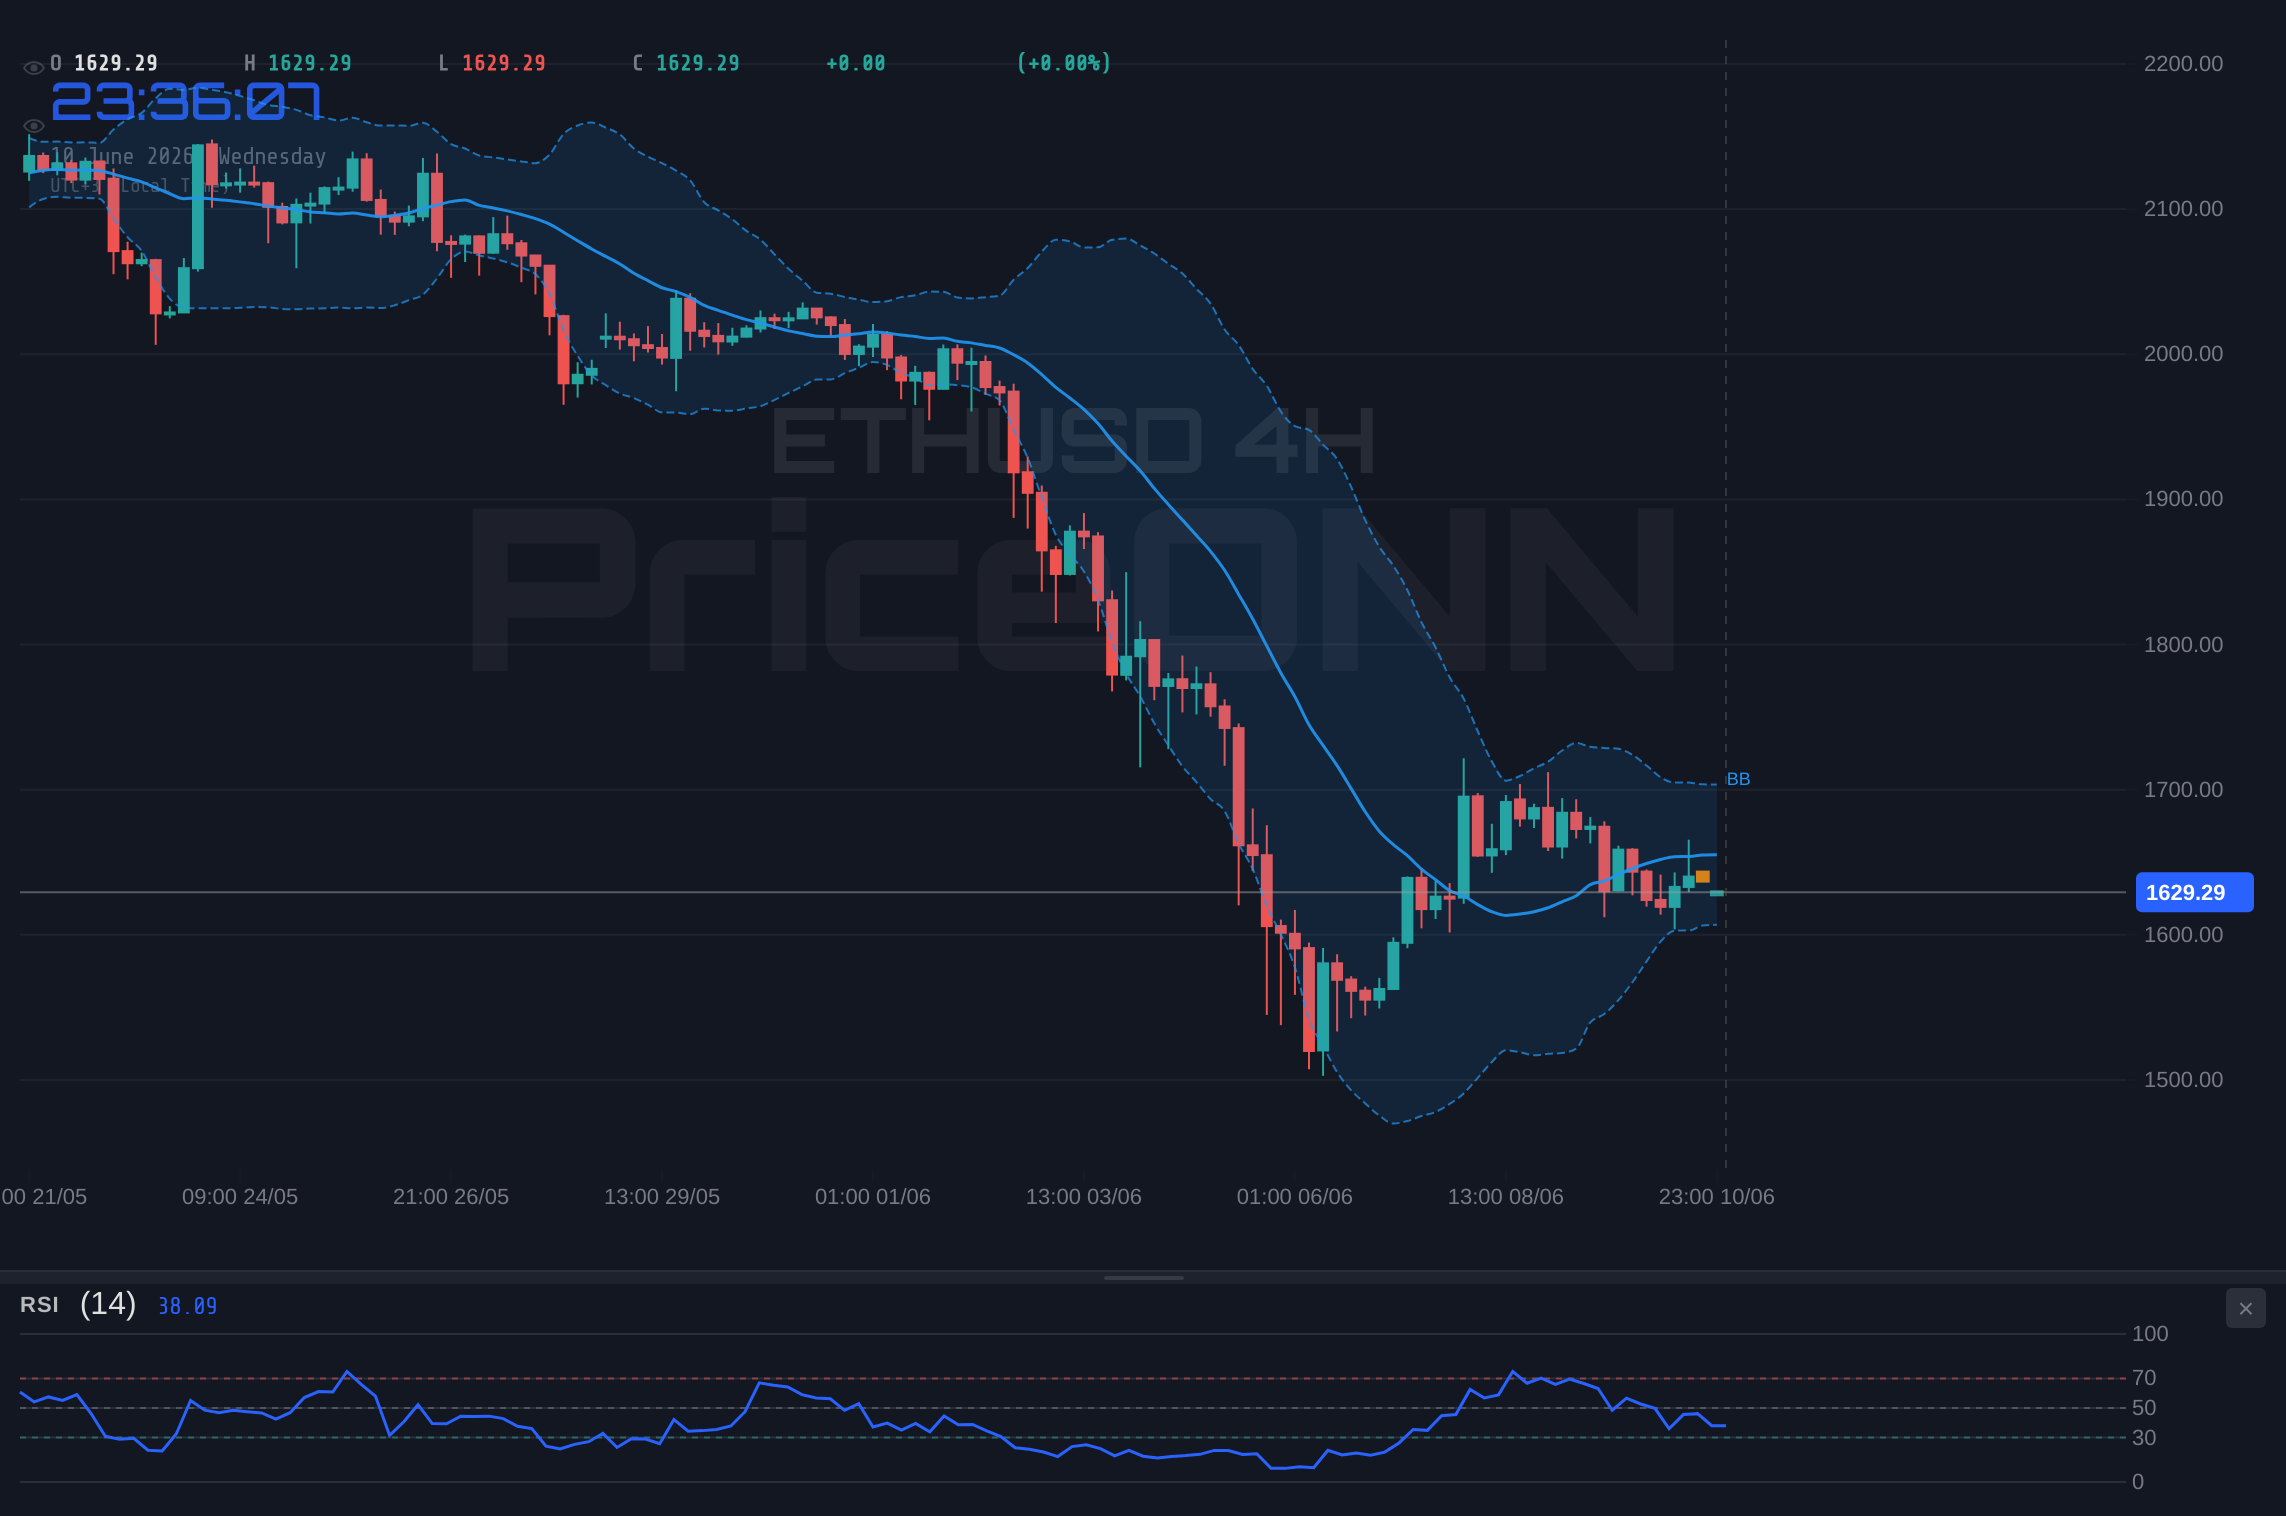
Ethereum has shed $61.72 today, a brutal 3.66% decline that dropped price to $1,625.58 - near the bottom of its $1,612.12 to $1,712.12 daily range. The daily RSI is sitting at 26.83, well inside oversold territory. Sounds like a contrarian buy setup? Here is the uncomfortable reality: an oversold RSI inside a trend where ADX registers 53.86 is not a reversal signal. It is a warning that sellers have been ferociously consistent. The question is not whether ETH is oversold - it clearly is. The question is whether this trend has enough momentum to ignore the oversold reading entirely.
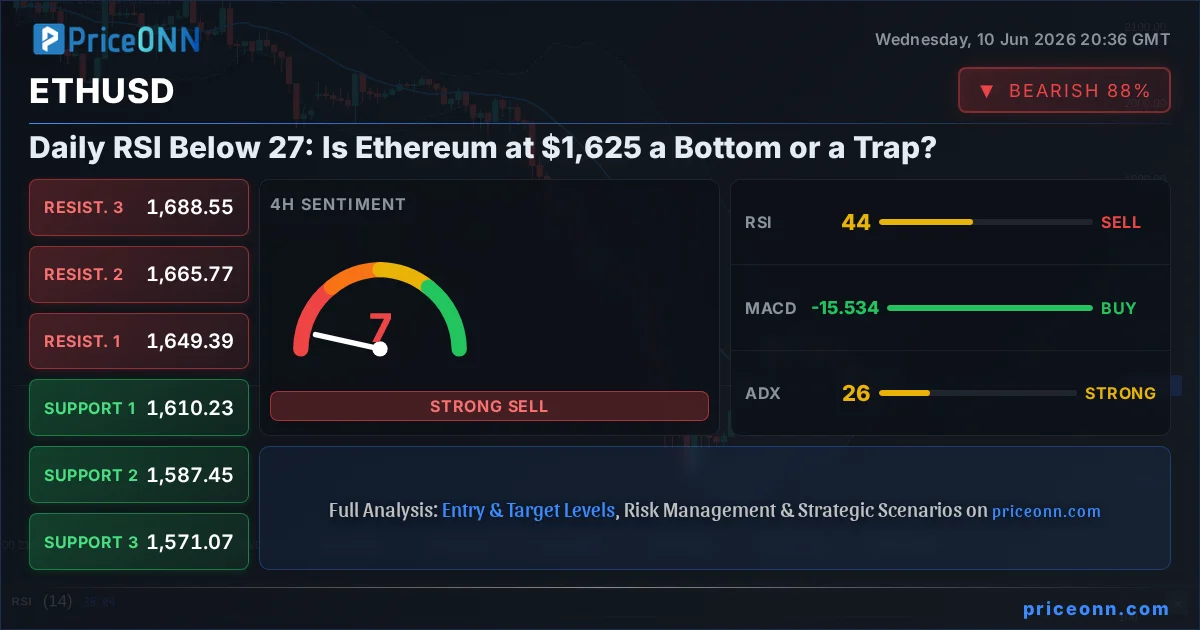
- ETHUSD today analysis: price at $1,625.58, down 3.66% ($61.72), within daily range $1,612.12 to $1,712.12
- Daily RSI at 26.83 is in oversold territory, but ADX at 53.86 signals an extremely powerful downtrend that can keep RSI suppressed for multiple sessions
- Critical 4H support at $1,610.23 is just $15 below current price; a confirmed break below opens $1,587.45 and $1,571.07 as next targets
- US CPI climbed to a three-year high in May at +0.5% m/m, compressing crypto risk appetite alongside a Nasdaq 100 decline of 3.17% to 28,458.87
The Bigger Picture: ETH Does Not Fall in a Vacuum
Today's ETH decline is not happening in isolation. Bitcoin has slipped 2.64% to $61,813 simultaneously, confirming this is a crypto-wide risk-off session rather than any Ethereum-specific catalyst. More telling is the Nasdaq 100, which dropped 3.17% to 28,458.87 - a significant single-session decline for tech-heavy equities that historically correlates tightly with crypto sentiment. When growth assets sell off this sharply in equities, crypto rarely escapes unscathed.
The macro catalyst is clear and significant. According to Bloomberg consensus reporting, the US Consumer Price Index rose 0.5% month-on-month in May, pushing headline inflation to a three-year high. That single data point does serious damage to the rate-cut thesis that had been providing a floor under speculative asset prices. Higher persistent inflation means the Federal Reserve maintains elevated interest rates longer - which raises the opportunity cost of holding non-yielding or speculative assets like Ethereum. This is not abstract macro theory. It is the direct mechanical link between interest rates and risk appetite.
The Dollar Index (DXY) at 99.78 looks deceptively quiet with only a +0.06% move on the day. But the daily technical picture for DXY is more constructive: RSI at 64.47 with stochastic K=89.39 crossing above D=76.33 signals dollar momentum is building. A strengthening dollar environment is structurally negative for ETH and the broader crypto complex. This is not a one-session headwind - it is a trend that has been developing across multiple sessions.
The SP500 is up 0.74% to 6,572.87 today, which looks like a conflicting signal. But look at the daily SP500 chart: ADX at 47.51 signals a strong downtrend on the medium-term picture. The intraday equity bounce is not changing the underlying technical structure, and crypto is reading the daily signal correctly.
Three Timeframes, One Uncomfortable Truth
The ETHUSD RSI story changes dramatically depending on which chart you examine - and that divergence is itself critical information for traders.
On the 1-hour chart, RSI sits at 43.85. That is neutral territory - not oversold, not overbought. MACD shows positive momentum on this timeframe, suggesting short-term buyers stepped in near the lows. But the stochastic tells a different story: K=35.32 sitting below D=59.87 signals the momentum crossover that would confirm a near-term reversal has not materialized. With ADX at 16.97 on the hourly, there is no committed directional trend in the very short term - just choppy, directionless price action with a downward lean. For scalpers, that weak ADX is actually a two-sided opportunity, but the daily structure creates asymmetric risk to the downside.
Step back to the 4-hour chart and the picture sharpens considerably. RSI at 43.27 mirrors the hourly picture - neutral with a bearish tilt. The MACD remains positive on the 4H, which is a small but notable divergence from the daily bearish picture. Bollinger Bands show price below the middle band. Stochastic K=21.23 sitting below D=25.64 is a bearish configuration that has not reversed. ADX at 26 on the 4H is where it gets genuinely concerning: this reading classifies as a strong downtrend on the medium-term timeframe. The bears have conviction across the 4H chart.
Now the daily. RSI at 26.83 is genuinely oversold - the first time this indicator has reached these depths in recent weeks. The daily stochastic is actually flashing a potential bullish crossover: K=27.12 has moved above D=16.03. When daily stochastic crosses from extreme oversold levels, it has historically preceded short-term bounces in ETH. However - and this cannot be overstated - the ADX at 53.86 on the daily is a flashing caution signal. That is an exceptionally powerful downtrend by any measure, and oversold readings in ultra-strong trends can persist far longer than logic suggests they should.
Why the ADX Reading Complicates the Oversold Narrative
Here is a principle that catches traders off guard repeatedly: never fade a strong-ADX trend based solely on RSI being oversold. The daily ADX at 53.86 for ETHUSD is one of the highest readings across all major markets in today's dataset. For comparison, gold's daily ADX is at 30.39, also in a downtrend. Gold's ADX is notable - but ETH's is nearly double that intensity. The Dow Jones 30 ADX on the daily sits at 21.7. Bitcoin's daily ADX is at 44.78. ETH's trend strength on the daily is the most aggressive in the group.
At ADX levels above 50, the trend carries significant institutional momentum. It is not driven by retail panic alone - it reflects sustained directional selling from participants who have the size and patience to keep pressing. When ADX is this elevated, RSI readings below 30 should be treated as a signal to manage existing positions carefully, not as a green light to initiate new longs against the trend flow. The risk-reward of buying into a 53.86 ADX downtrend is not favorable, regardless of how low RSI gets.
What needs to happen before the picture changes? Two conditions: the daily ADX needs to start declining from its 53.86 peak, and RSI needs to form a higher low on the daily chart. Neither condition has been met yet. Until both are satisfied, any bounce from current levels should be treated as a counter-trend opportunity with tight risk management - not a trend reversal call.
A 4H close below $1,610.23 would eliminate the current support structure and open a direct path toward $1,587.45 and $1,571.07. Traders with open long positions should have their risk clearly defined at this level before any new session begins.
The $1,610 Level: Where the Story Changes for ETHUSD
At $1,625.58, ETH is trading just $15.35 above its first critical 4H support at $1,610.23. That proximity is uncomfortable. It means the market is in a zone where the outcome is binary: either buyers defend this support convincingly, or the structure breaks and the next leg down begins. There is not much buffer between here and there.
If $1,610.23 holds with volume and the 4H stochastic crossover confirms, the recovery target ladder is $1,649.39, $1,665.77, and $1,688.55 on the 4H resistance levels. The $1,649.39 level carries particular weight - a confirmed 4H close above it would shift the medium-term technical structure from active distribution to potential early accumulation. That is the level swing traders should have circled on their charts right now.
If $1,610.23 breaks on a confirmed 4H close, the next support cluster at $1,587.45 becomes the primary target. Below that, $1,571.07 represents the final near-term support before ETH enters a deeper drawdown scenario. From current prices, that scenario represents approximately 3.4% of additional downside. The daily support levels sitting further out at $1,576.50 and $1,531.62 become relevant if the 4H structure fully gives way.
On the topside, the 1H resistance cluster at $1,635.11, $1,641.44, and $1,648.64 forms a compression zone that ETH needs to reclaim before any meaningful recovery narrative gains credibility. A breakout through this resistance on strong volume would be the first early signal, but until the daily trend structure changes, even a move above $1,635 should be traded with defined risk.
Ethereum's Crypto-Specific Fundamentals: Staking, Gas Fees, and the Rate Environment
Price action analysis tells only part of the story for ETH. Unlike Bitcoin, Ethereum's network economics provide additional layers of fundamental analysis that directly affect medium-term demand.
Ethereum's staking yield, typically in the 3-5% annual range depending on validator participation and MEV rewards, creates a fundamental demand floor. But in the current macro environment - US CPI at a three-year high, Federal Reserve maintaining elevated rates - those staking yields face direct competition from traditional fixed income products. A US Treasury offering 4%+ competes with ETH staking yields in ways that did not exist during the near-zero rate era of 2020-2021. This is a structural headwind that compresses the incremental demand from yield-seeking capital that had flowed into ETH staking protocols.
The DeFi ecosystem's health is directly readable through gas fee activity. Risk-off sessions like today typically see reduced on-chain activity, lower gas fees, and reduced ETH burn through the EIP-1559 mechanism. Less ETH burned means the deflationary pressure that supported ETH valuations weakens in the near term. This is not an acute crisis, but it is a compounding headwind on top of the technical selling pressure visible across all timeframes.
Institutional ETH flows through crypto ETF products are also worth monitoring. Risk-off macro events - particularly when driven by inflation surprises rather than growth concerns - tend to prompt institutional portfolio managers to reduce high-beta crypto exposure. The combination of CPI at a three-year high, Nasdaq down 3.17%, and DXY building momentum creates exactly the environment that triggers systematic crypto allocation reductions in institutional portfolios.
With DXY at 99.78 and the daily stochastic K=89.39 crossing above D=76.33, dollar momentum is accelerating. Historically, ETH shows strong inverse correlation with DXY during risk-off phases driven by inflation surprises - exactly the macro environment playing out today.
What Different Trader Types Should Focus On Right Now
The same chart can mean very different things depending on your time horizon. Today's ETHUSD structure calls for three completely different approaches depending on where you sit.
Scalpers working the 1-hour chart face a challenging but navigable environment. ADX at 16.97 signals weak near-term trend commitment - that creates two-way scalping opportunities, but the daily downtrend creates asymmetric risk to the downside. The immediate range to trade: $1,621.58 support against $1,635.11 resistance on the 1H. A breakout above $1,635.11 on strong volume could provide a scalp toward $1,641.44, but stops should be tight and position sizing conservative given the broader daily structure. Short scalps targeting $1,614.38 on a break below $1,621.58 carry the structural tailwind of the daily trend.
Swing traders on the 4H chart need patience above all else. The current setup is a textbook watch zone: the trend is strongly bearish (ADX 26, price below all moving averages, stochastic bearish at K=21.23 below D=25.64), but the daily RSI oversold creates a real risk of sharp counter-trend bounces that can stop out premature shorts. The clean swing long setup requires a confirmed 4H close above $1,649.39 with the 4H stochastic K crossing above D. That would justify a swing long targeting $1,665.77 first, then $1,688.55. Invalidation: any 4H close below $1,610.23. The clean swing short setup: a confirmed 4H break below $1,610.23 targeting $1,587.45 and $1,571.07.
Long-term ETH investors should not be making major allocation decisions based on today's single daily candle. Daily RSI at 26.83 with a stochastic crossover forming (K=27.12 now above D=16.03) historically marks zones where patient accumulation has generated strong returns over 4-8 week horizons. But the ADX at 53.86 demands respect - any accumulation should be done in small tranches with a defined maximum loss level. The critical daily level to monitor: $1,576.50. A confirmed daily close below that support changes the longer-term narrative significantly and would suggest deeper structural damage.
ETHUSD Trade Scenarios: Three Paths From Here
Bearish Scenario: Support Cracks, Bears Press Lower
65% ProbabilityBullish Scenario: Oversold Bounce Gains Traction
15% ProbabilityNeutral Scenario: Consolidation as Market Absorbs CPI Shock
20% ProbabilityFrequently Asked Questions: ETHUSD Analysis
What happens if ETHUSD breaks below the $1,610.23 support level?
A confirmed 4H close below $1,610.23 eliminates the current near-term support structure and opens a direct path to $1,587.45, followed by $1,571.07. This bearish scenario carries approximately 65% probability given the current ADX reading of 26 on the 4H and bearish stochastic configuration. Traders should have risk pre-defined at $1,610.23 to avoid being caught in an accelerated move downward.
Is buying ETH at $1,625.58 justified given the daily RSI reading of 26.83?
While the daily RSI at 26.83 is technically oversold and the stochastic shows a potential K/D crossover (K=27.12 now above D=16.03), the daily ADX at 53.86 signals one of the strongest downtrends in recent ETH history - a condition that can keep oversold readings depressed for multiple sessions. A more conservative approach is to wait for a confirmed 4H close above $1,649.39 as evidence of recovering demand before initiating new longs, with small-tranche scaling near $1,610 support as a risk-managed alternative for long-term investors.
What does the ETHUSD daily ADX of 53.86 signal about the recovery timeline?
An ADX of 53.86 on the daily chart is one of the strongest downtrend readings across all major crypto markets in today's session - nearly double gold's daily ADX of 30.39. At these levels, short-term bounces tend to be shallow and short-lived until ADX begins declining from its peak, a process that typically requires several sessions of sideways consolidation. A sustained ETHUSD recovery likely requires daily ADX to decline below 40 combined with a MACD histogram crossover back into positive territory on the daily timeframe.
How will US inflation at a three-year high affect ETHUSD this week?
The May CPI print of +0.5% m/m, pushing headline inflation to a three-year high, directly reduces the probability of near-term Federal Reserve rate cuts and keeps the cost of capital elevated for speculative assets. With DXY at 99.78 and daily stochastic K=89.39 building dollar momentum, the macro headwind is compounding the technical pressure. Any hawkish Federal Reserve communication in response to this CPI data would likely accelerate selling pressure toward the $1,571.07 support zone for ETHUSD this week.
Track markets in real-time
AI-powered analysis, technical indicators and real-time price data.
Join Our Telegram Channel
Breaking market news, AI analysis and trading signals instantly.
Join Channel