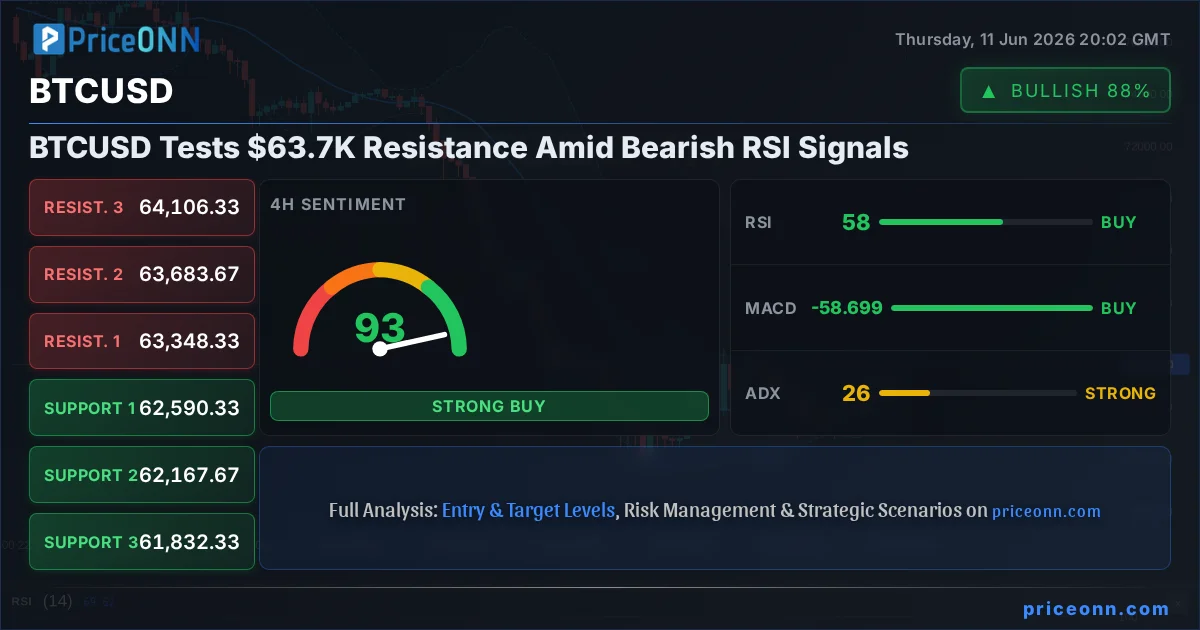
Alright traders, let's cut straight to the chase. Bitcoin, or BTCUSD as we track it, is currently sitting at a critical juncture around $63,637. We've seen a decent bounce recently, pushing towards that $63.7K resistance level. But here's the thing – the charts are flashing some cautionary signals, particularly on the RSI. This isn't a time for blind optimism; it's a moment for sharp, data-driven analysis.
- BTCUSD is testing resistance at $63,727.67, currently trading at $63,637.00.
- The 1-hour RSI at 65.43 indicates rising momentum, but the daily RSI at 31.72 suggests underlying bearish pressure.
- A bearish divergence on the daily chart, coupled with negative MACD momentum, warns of a potential pullback.
- Key support levels to watch are $63,263.67 (1H) and $60,686.33 (1D), while resistance is at $63,727.67 (1H) and $63,746.33 (1D).
The past few days have been a rollercoaster, and we're seeing Bitcoin try to regain its footing. After a dip that tested lower support levels, the bulls have managed to push the price back up. This current push towards the $63.7K mark is significant. It represents a key area where selling pressure has emerged previously. Remember, markets are cyclical, and what goes up must eventually face resistance. The question isn't *if* it will face resistance, but *how* it will react when it does. We've seen this play out countless times, and ignoring these price points is a rookie mistake. My experience tracking these cycles tells me that the reaction at these levels will define the next short-to-medium term move.
Navigating the Technical Landscape: A Multi-Timeframe View
The 1-Hour Chart: Short-Term Momentum
Looking at the 1-hour chart, the picture is somewhat constructive. The trend is showing an 88% strength, and the overall signal is 'BUY' with 8 out of 8 indicators suggesting a bullish inclination. The RSI is sitting at a healthy 65.43, comfortably in the neutral zone but trending upwards, indicating that short-term momentum is on the buy side. MACD is showing positive momentum, with the MACD line above the signal line, and the Stochastic oscillator is in overbought territory (%K at 86.14, %D at 54.27), a classic sign of strong buying pressure in the immediate term. The ADX at 26.09 also confirms a reasonably strong uptrend on this timeframe. This suggests that the recent upward move has some legs to it in the very short term. Traders looking for quick entries might find this timeframe appealing, but it's crucial to remember that this is the shortest timeframe we're analyzing.
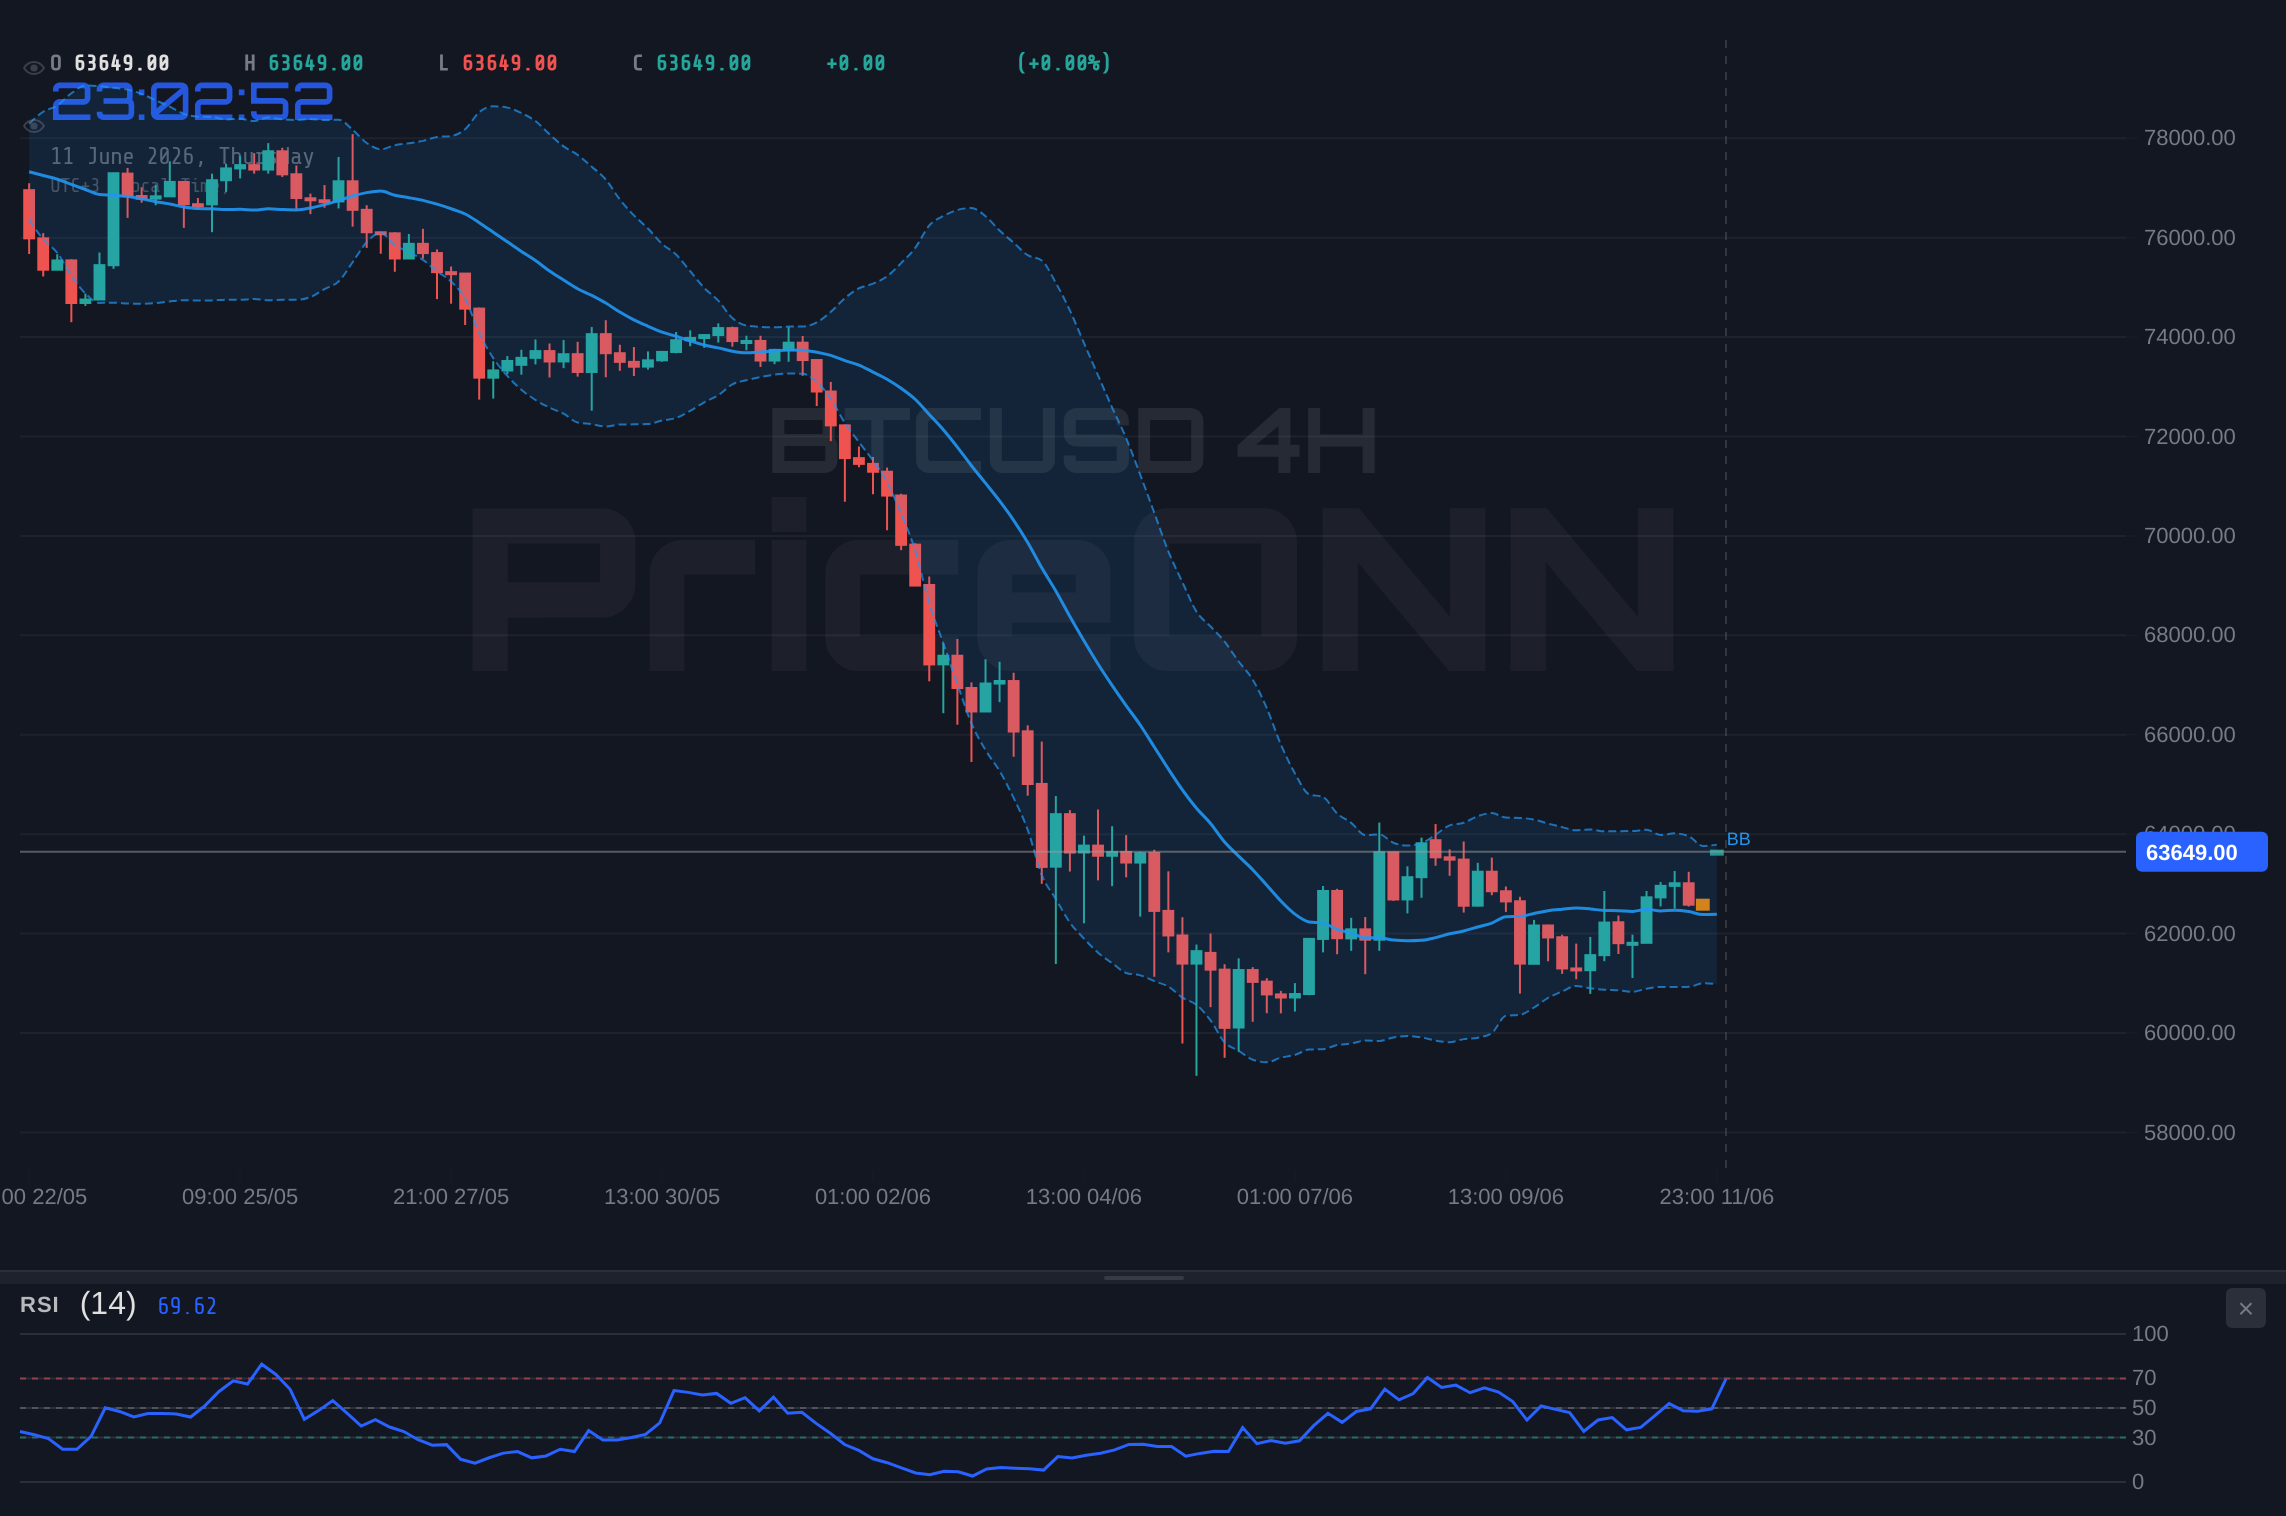
The 4-Hour Chart: A Mixed Signal
Stepping back to the 4-hour timeframe, the narrative becomes a bit more nuanced. Here, the trend strength is at 50%, indicating a neutral phase, though the overall signal is still 'BUY' (7 out of 8 indicators). The RSI is at 57.89, still in the neutral zone and indicating upward momentum, but it's not as aggressive as on the 1-hour chart. The MACD is positive, and Stochastic is in overbought territory (%K: 95.49, %D: 70.83), again pointing to strong buying pressure. However, the ADX reading of 25.53, while indicating a strong trend, is lower than the 1-hour chart's strength. This neutral trend strength on the 4-hour chart, despite the bullish signals from RSI, MACD, and Stochastic, suggests that the market might be consolidating or preparing for a potential shift. It's like a runner who has sprinted ahead but is now slowing down to catch their breath before the next leg of the race. This is where risk management becomes paramount; chasing a trade based solely on short-term signals without considering the broader context can be dangerous.
The Daily Chart: Underlying Bearish Concerns
Now, let's look at the daily chart – this is where the real caution flags are waving. The trend here is classified as 'Düşüş' (Bearish) with 100% strength, and the overall signal is 'SAT' (SELL) with 7 out of 8 indicators pointing downwards. The RSI is at a very low 31.72, deep in oversold territory. While oversold conditions can sometimes signal a buying opportunity, they can also indicate significant selling pressure that might persist. Historically, when RSI dips this low, it often precedes a bounce, but it doesn't guarantee it. The MACD is showing negative momentum, with the MACD line firmly below the signal line, reinforcing the bearish sentiment. The Stochastic oscillator, interestingly, shows %K at 28.31 and %D at 18.15, giving a 'Yükseliş' (BUY) signal as %K is above %D. This is a conflict with the overall bearish signal. The ADX, however, at 45.68, signals a very strong downtrend. This strong downtrend on the daily chart, despite the oversold RSI and the conflicting Stochastic signal, is the most significant factor to consider. It tells us that the general direction, the dominant force in the market over the last few days, has been bearish. We're seeing a price action that contradicts the short-term bullishness, and that's a powerful warning.
Correlation and Context: DXY, Equities, and Oil
To truly understand Bitcoin's current position, we need to look beyond its own charts and consider its correlation with other major markets. The Dollar Index (DXY) is currently trading around 99.41 and is showing a bearish trend on the 1-hour and 4-hour charts, though it's neutral on the daily. A weaker dollar typically supports riskier assets like Bitcoin, as it implies a potential shift away from safe-haven assets. This correlation might be contributing to the recent upward pressure on BTCUSD. However, the DXY's daily chart is neutral with a 'BUY' signal (7 out of 8 indicators), suggesting that the dollar's weakness might be temporary, or that market participants are waiting for clearer signals. This adds another layer of complexity; we can't rely solely on a weak dollar to fuel a sustained Bitcoin rally.
Equities, specifically the S&P 500 and Nasdaq 100, also play a crucial role. The S&P 500 is showing a strong bullish trend on the 1-hour and 4-hour charts, but a bearish trend on the daily. It's currently trading at 6572.87. The Nasdaq 100, meanwhile, is showing a bullish trend on the 1-hour and 4-hour charts, but a bearish trend on the daily, trading at 29421.23. This divergence between short-term strength and daily weakness in the major indices mirrors Bitcoin's own situation. A sustained downturn in equities often spills over into cryptocurrencies, as investors reduce their exposure to risk assets across the board. The fact that both indices show a bearish daily trend, despite their short-term gains, reinforces the caution warranted for BTCUSD. It's a sign that the broader market sentiment might not be as robust as the intraday moves suggest.
Oil prices, particularly Brent crude, are also worth noting. Brent is trading around $91.16 and showing a bearish trend across all timeframes, with significant price drops today. This decline in oil prices, down 3.06% today, could signal cooling inflation expectations or a slowdown in global demand. Historically, high oil prices have often been correlated with inflation concerns, which can lead central banks to adopt tighter monetary policies, potentially impacting risk assets negatively. The current drop in oil could be interpreted in a few ways: either inflation fears are subsiding, which might be positive for risk assets, or global demand is weakening, which is a negative macro signal. Given the current mixed signals from equities and the dollar, the direction of oil prices adds another variable to the complex equation driving Bitcoin's price action.
Key Levels and Potential Scenarios
These levels are not arbitrary; they represent areas where significant buying or selling pressure has historically emerged. For BTCUSD at $63,637, the immediate resistance stands at $63,727.67. A decisive break above this level, especially with increasing volume, could signal a continuation of the bullish momentum seen on the shorter timeframes. However, failure to break this resistance could lead to a retracement, with the first significant support level to watch on the 1-hour chart being $63,263.67. If this gives way, we could see a more substantial move towards $63,063.33 and potentially $62,799.67. On the daily chart, the key resistance is $63,746.33, and the significant support lies much lower, around $60,686.33. This wide gap between the current price and the major daily support highlights the potential risk if the bearish signals on the daily chart begin to dominate.
Bearish Scenario: Testing Lower Supports
65% ProbabilityNeutral Scenario: Consolidation Around Resistance
25% ProbabilityBullish Scenario: Breaking the Resistance Barrier
10% ProbabilityThis is where the rubber meets the road. The bearish scenario, with a 65% probability, hinges on the inability to break the immediate resistance and a subsequent fall below the first significant 1-hour support. If BTCUSD fails to clear $63,727.67 and then breaks below $63,263.67, we could see a swift move down towards $62,799.67 and potentially the major daily support at $60,686.33. The neutral scenario, at 25%, anticipates further choppiness, with price consolidating between the immediate support and resistance levels. This would likely occur if the market lacks conviction or is waiting for clearer signals from macro events or other correlated assets. Finally, the bullish scenario, carrying only a 10% probability based on current daily chart indicators, requires a strong, decisive breakout above $63,727.67 and then $63,991.33, ideally with increasing volume. Even then, invalidation would occur if price fails to hold these levels and falls back below $63,263.67.
Economic Calendar and Geopolitical Undercurrents
While the technical picture is complex, we cannot ignore the macroeconomic backdrop. The economic calendar shows several high-impact events related to USD, EUR, and GBP in the coming days. Although no specific dates are provided for these events in the current data snippet, their presence indicates potential for increased volatility across forex markets and, by extension, risk assets like Bitcoin. For instance, any surprising inflation data (like the US CPI which reportedly climbed to a three-year high in May, according to recent news) or central bank commentary could significantly shift market sentiment. A stronger-than-expected US inflation report, for example, might lead to renewed fears of prolonged higher interest rates, which typically puts downward pressure on growth assets like Bitcoin. Conversely, signs of cooling inflation could provide a tailwind.
Geopolitically, news about US-Iran escalation and the impact on crude oil prices is also a factor. While Brent crude is currently sliding, any sudden geopolitical flare-up could send oil prices soaring, reigniting inflation concerns. This, in turn, could influence central bank policy and market risk appetite. The correlation between oil prices and inflation expectations means that energy market movements warrant close observation for their indirect impact on Bitcoin. The fact that Gold is also facing downward pressure despite geopolitical tensions suggests that safe-haven demand might be shifting, or that broader market forces are currently overriding these specific risk factors. This is a dynamic situation, and staying informed about these macro and geopolitical currents is as vital as watching the price charts.
Frequently Asked Questions: BTCUSD Analysis
What happens if BTCUSD breaks above the $63,727.67 resistance on the 1H chart?
A strong breakout above $63,727.67, confirmed by increasing volume, could trigger a move towards the next resistance at $63,991.33. This would invalidate the immediate bearish outlook, but sustained upside would require breaking daily resistance at $63,746.33.
Should I consider buying BTCUSD at current levels around $63,637 given the daily RSI is 31.72?
Buying solely based on the daily oversold RSI at 31.72 is risky, especially with the strong daily downtrend (ADX 45.68). A confirmation signal, like a break above immediate resistance or a positive divergence on the daily chart, would be needed. Until then, caution is advised.
Is the bearish divergence on the daily chart a strong sell signal for BTCUSD?
A bearish divergence, where price makes higher highs (or attempts to) while an indicator makes lower highs, coupled with a strong daily downtrend (ADX 45.68) and negative MACD momentum, presents a significant risk of a pullback. It's a warning sign, not a guaranteed sell signal on its own.
How might upcoming US economic data impact BTCUSD if the DXY remains weak?
If upcoming US data shows signs of inflation cooling or a weaker economy, it could keep the DXY weak, potentially supporting BTCUSD. However, if data surprises to the upside, it could strengthen the dollar and trigger a sell-off in Bitcoin, despite short-term bullish technicals.
The current setup for BTCUSD is a classic case of conflicting signals across timeframes. The short-term charts show bullish momentum pushing towards resistance, while the daily chart paints a more cautious, even bearish, picture with strong downtrend indicators and bearish divergence warnings. This divergence between intraday strength and the overarching daily trend is precisely where opportunities and risks lie. It's crucial to manage risk tightly, especially if considering any positions. Waiting for clearer confirmation – either a decisive break above resistance with follow-through, or a breakdown below key support levels – will be key. Remember, patience is a trader's best friend, and the market always provides another setup.
Technical Outlook Summary
| Indicator | Value | Signal | Interpretation |
|---|---|---|---|
| RSI (14) | 65.43 | Neutral | Rising momentum on 1H, but daily RSI at 31.72 signals oversold. |
| MACD Histogram | +0.72 (1H) | Bullish | Positive momentum on 1H, but negative on Daily. |
| Stochastic | K:86.14, D:54.27 (1H) | Bullish | Overbought on 1H, but daily Stochastic signals a rise from oversold. |
| ADX | 26.09 (1H) | Bullish | Strong trend on 1H, but Daily ADX at 45.68 indicates a very strong downtrend. |
| Bollinger | Upper Band | Watch | Price testing upper band on 1H; below middle band on Daily. |
Key Levels
Support Levels
Resistance Levels
Track markets in real-time
AI-powered analysis, technical indicators and real-time price data.
Join Our Telegram Channel
Breaking market news, AI analysis and trading signals instantly.
Join Channel