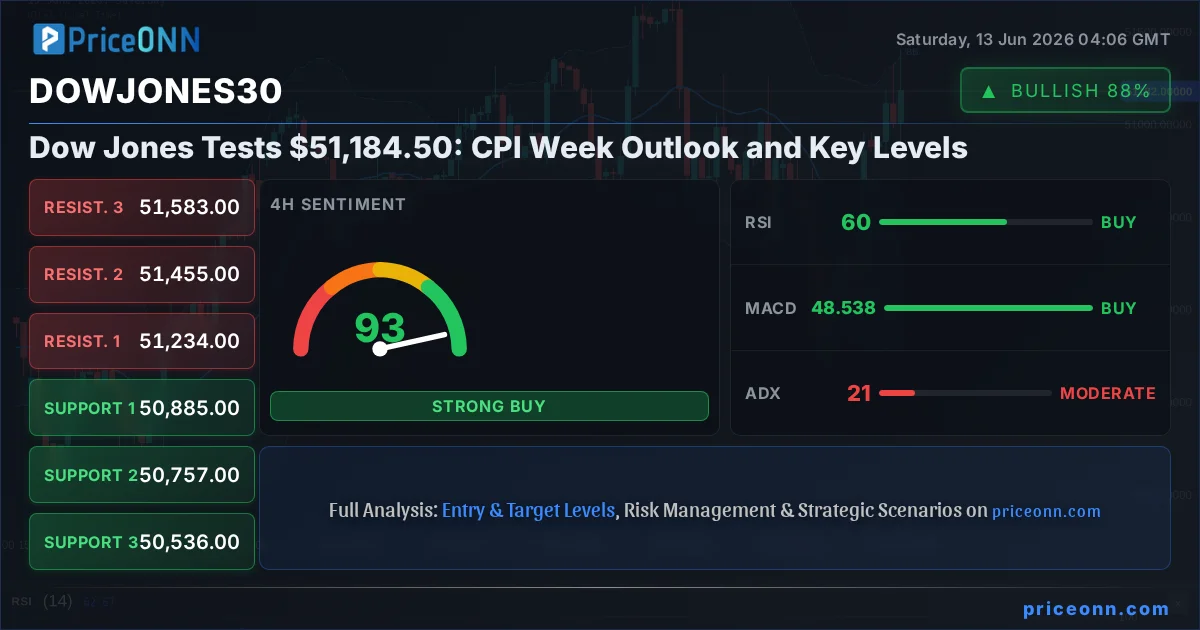
This past week saw the Dow Jones Industrial Average navigate a complex landscape, closing Friday at $51,184.50 after a significant rally from its weekly lows. The index's journey through the trading week was marked by a notable 2.65% gain, underscoring the market's resilience amidst evolving economic narratives. As we head into the crucial Consumer Price Index (CPI) week, the technical indicators present a nuanced view, demanding careful observation of key support and resistance levels. The ADX at 20.87 suggests a moderate trend is in play, while the alignment of RSI and MACD histogram signals a potential directional move, though Stochastic readings remain in a tradable, not extreme, zone. This analysis aims to dissect these technical signals, correlate them with broader market movements, and provide a clear roadmap for the week ahead.
- RSI at 57.21 on the daily chart signals a neutral to slightly bullish momentum, indicating room for further upside before overbought conditions emerge.
- Critical support for the Dow Jones sits at $50,885, a level that has shown resilience in the 4-hour timeframe, while resistance is eyed around $51,234.
- The MACD histogram on the daily chart shows negative momentum, suggesting underlying selling pressure despite recent gains, requiring confirmation from price action.
- Correlation analysis indicates that the Dow Jones's performance is influenced by the DXY's movement, which is currently trading around 99.7 - a strengthening dollar could pose headwinds.
Navigating the Week's Rally: A Technical Deep-Dive
The $51,184.50 Pivot Point
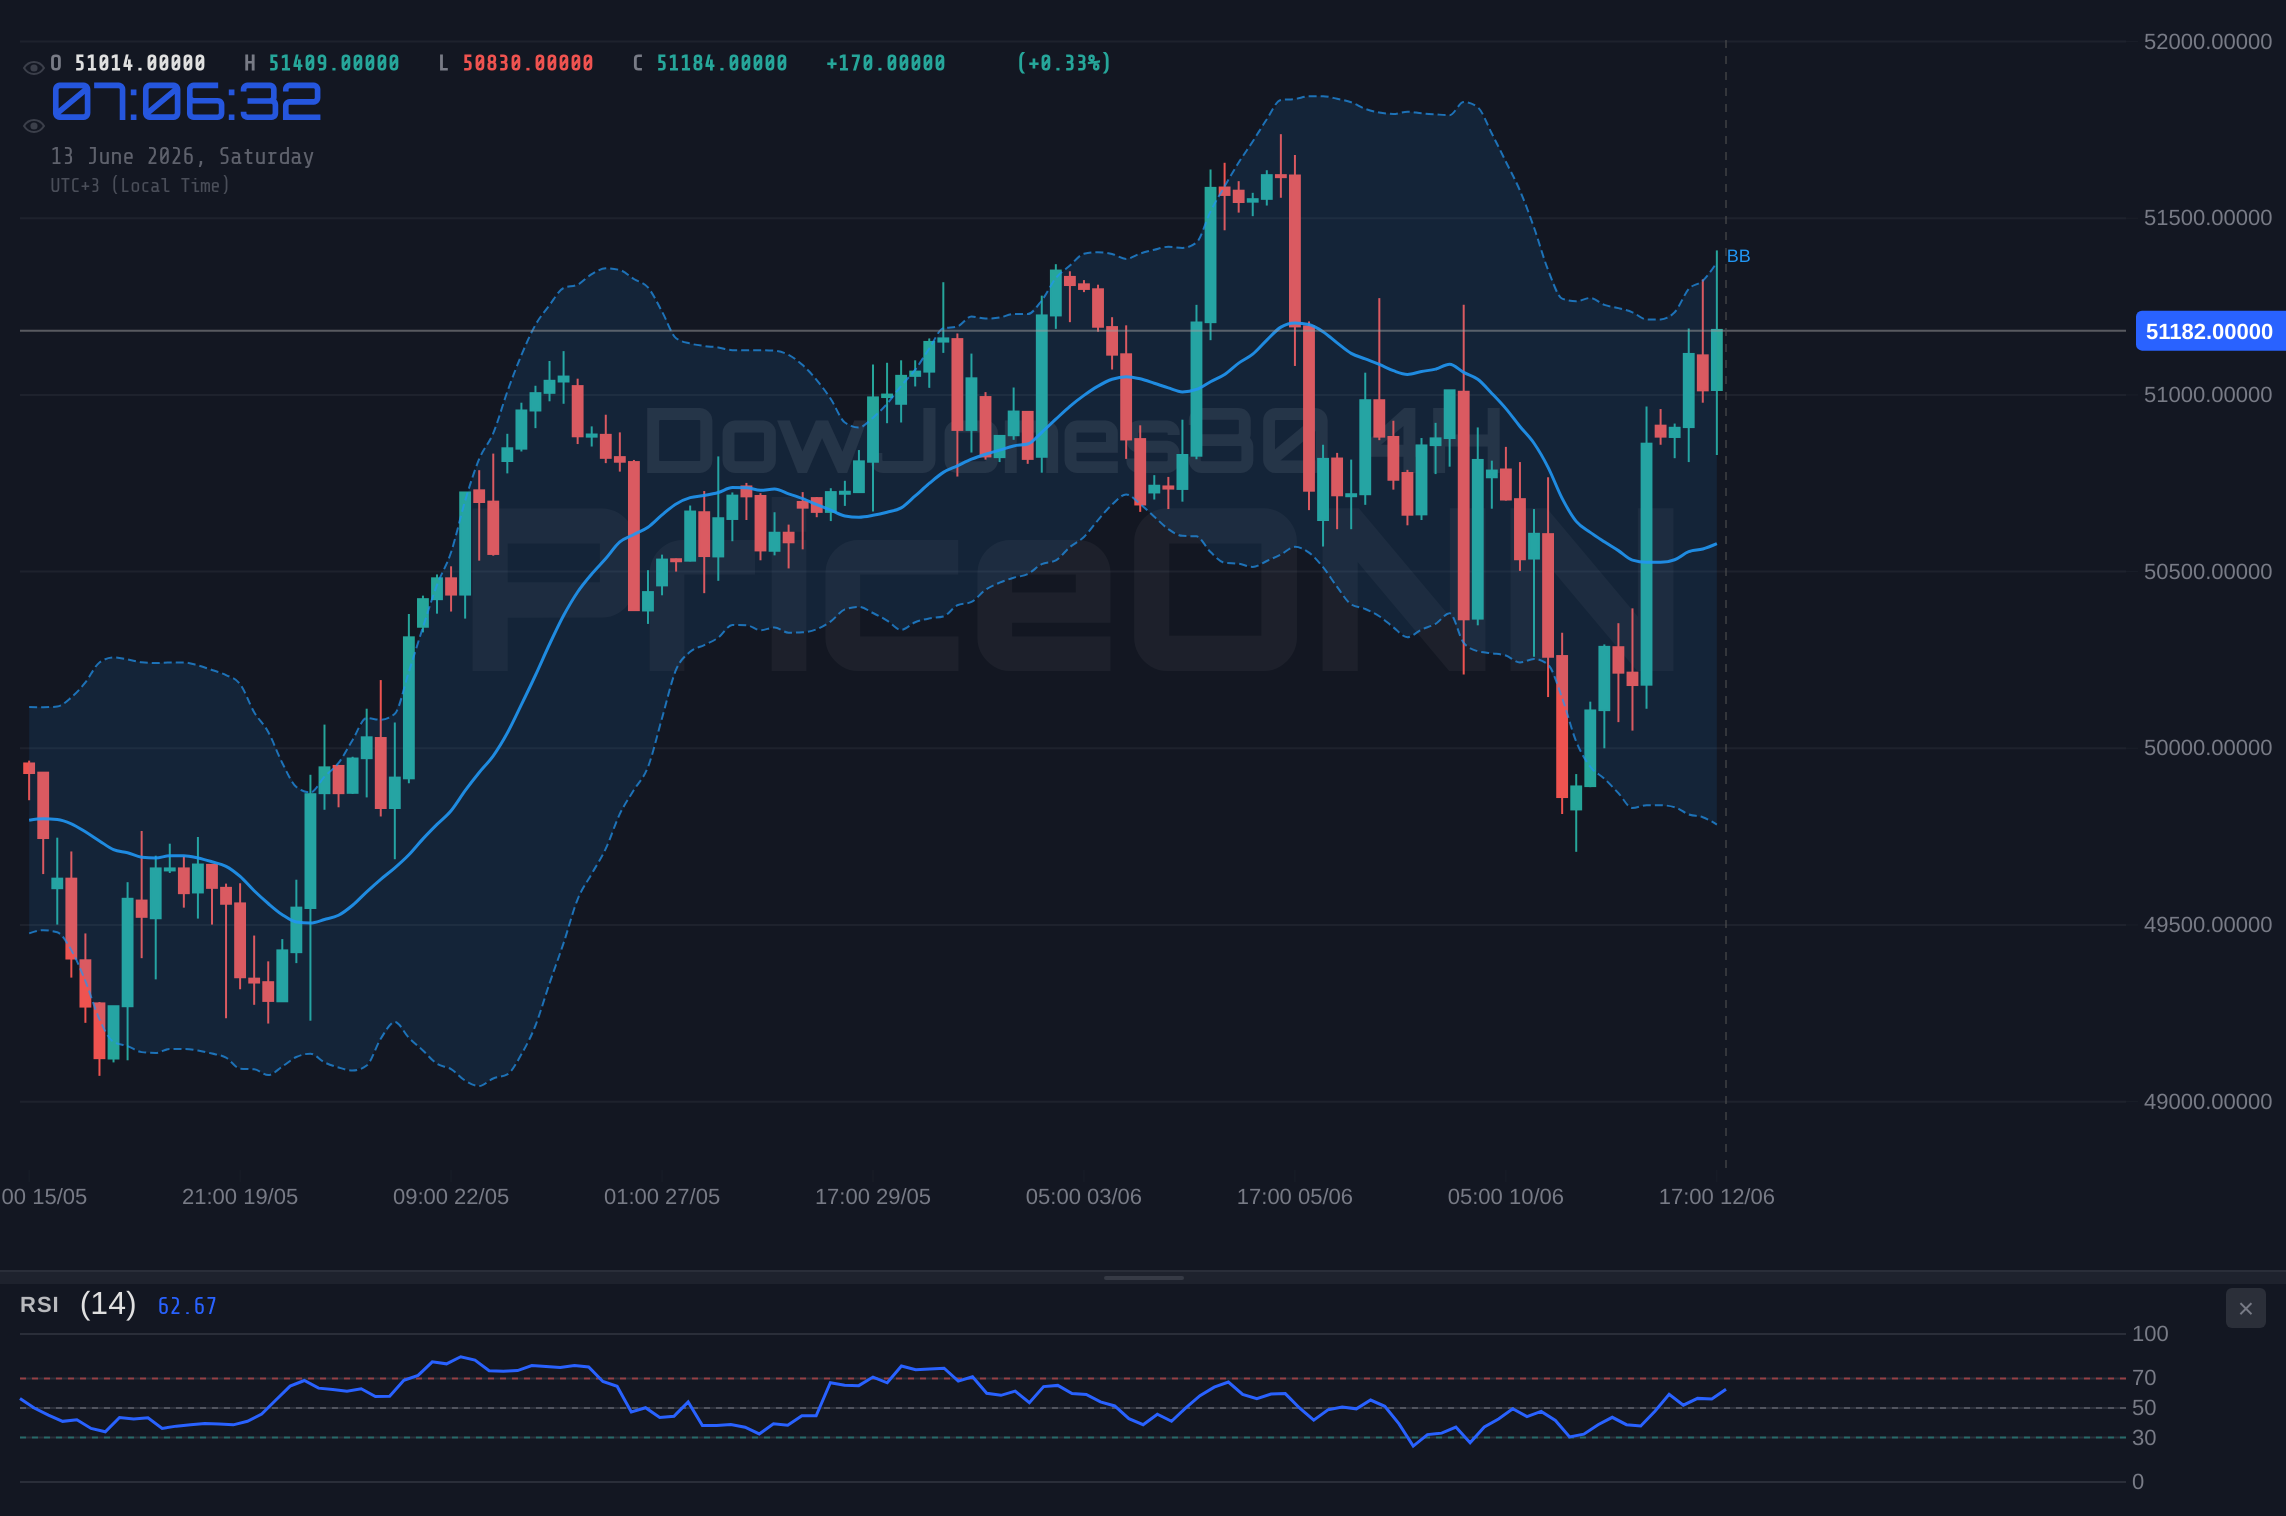
The Dow Jones Industrial Average concluded the trading week at a pivotal $51,184.50, a level that encapsulates the market's recent push higher. This closing price wasn't just a number; it represented a hard-fought battle, especially after the index's substantial 2.65% surge, adding $1,322.50 to its value over the week. This upward momentum, while positive, needs to be viewed through the lens of the broader technical indicators. On the 1-hour chart, the trend is neutral with a power score of 50%, suggesting a lack of strong conviction. However, the ADX reading of 26.73 on this timeframe indicates a strong upward trend, creating a slight divergence in signals. This duality is precisely where price action analysis becomes paramount; is the underlying trend strong enough to sustain the price above $51,184.50, or are we looking at a temporary reprieve before a potential pullback?
The 4-hour timeframe offers a similar mixed bag. Here, the trend is also neutral (50% power), yet the ADX stands at 20.87, pointing towards a moderate trend. This aligns more closely with the overall sentiment that while there's upward movement, it's not yet a runaway train. The Stochastic Oscillator, with K at 85.78 and D at 83.12, signals an overbought condition, a classic warning sign that a correction might be on the horizon. Yet, the RSI at 60.23 remains in neutral territory, suggesting there's still room for prices to climb before hitting extreme overbought levels. This technical tug-of-war is what traders live for – identifying the point where one side gains dominance.
On the daily chart, the picture becomes clearer, albeit with its own complexities. The trend is technically neutral (50% power), but the ADX at 20.13 suggests a moderate trend strength. The RSI at 57.21 is comfortably in the neutral zone, leaning towards bullish, which is a positive sign for continuation. However, the MACD histogram is showing negative momentum, with the MACD line below the signal line. This is a bearish signal that warrants attention, especially as it contrasts with the bullish leanings of the RSI. Such discrepancies highlight the importance of not relying on a single indicator but looking for confluence across multiple timeframes and tools.
Decoding the Indicators: A Trader's Perspective
Let's dive deeper into what these indicators are telling us. The RSI, a measure of the magnitude of recent price changes to evaluate overbought or oversold conditions, hovers around 57.21 on the daily chart. This isn't an extreme reading; it suggests that while there's upward momentum, the market isn't yet overheated. Traders often look for RSI to move above 70 for overbought conditions and below 30 for oversold signals. Currently, the Dow Jones has room to run before hitting those zones, which could be interpreted as a bullish sign for the immediate future, especially if other indicators support it.
The MACD (Moving Average Convergence Divergence) provides a different perspective. On the daily chart, the MACD histogram is negative, and the MACD line is below the signal line. This indicates that the short-term moving average is below the long-term moving average, a bearish sign that selling pressure might be building. This is a critical point of divergence; while RSI suggests room to grow, MACD hints at underlying weakness. The key for traders here is to watch for any crossover on the MACD or a change in the histogram's direction. A MACD line crossing above its signal line would be a bullish confirmation, while a continued negative histogram suggests the recent rally might be losing steam.
Stochastic Oscillator readings add another layer to this analysis. On the 4-hour chart, K at 85.78 and D at 83.12 are firmly in overbought territory. This suggests that the recent upward move has been strong, potentially too strong, and a pullback or consolidation is likely. However, on the daily chart, Stochastic shows K at 38.31 and D at 45.83, which is in the lower half of the range, signaling potential for further upside or a bounce from current levels. This divergence between timeframes means that short-term traders might anticipate a pullback, while longer-term investors might see current levels as a potential entry point before a larger move.
The ADX (Average Directional Index) is crucial for understanding trend strength. Across the 1-hour, 4-hour, and daily charts, the ADX readings are 26.73, 20.87, and 20.13 respectively. These values indicate a moderate to strong trend, which is generally positive for any existing directional move. However, the slight decrease from the 1-hour to the daily chart suggests that the trend's conviction might be waning as we look at longer timeframes. A strong trend indicated by ADX above 25 is usually a sign that the current move has momentum, but the readings here suggest caution; the trend is present but not overwhelmingly dominant across all timeframes.
The Crucial Support and Resistance Levels
Understanding the key price levels is paramount for navigating the Dow Jones. On the 4-hour chart, the immediate support is identified at $50,885, followed by $50,757 and $50,536. These levels represent areas where buying interest has historically emerged, potentially halting or reversing downward price movements. If the index were to fall, holding above $50,885 would be crucial for maintaining a bullish outlook. A break below this level could signal a deeper correction, with traders then watching the subsequent support zones.
Conversely, resistance levels are stacked above the current price. The first significant resistance is at $51,234, followed by $51,455 and $51,583. These are the hurdles the index must clear to continue its upward trajectory. A decisive move and close above $51,234, especially on increased volume, could signal a breakout and pave the way for testing higher resistance levels. The battle between buyers and sellers at these critical junctures will likely dictate the short-to-medium term direction of the Dow Jones.
On the daily chart, the support levels are slightly further down, with $49,499.67, $49,137.33, and $48,460.67. These are more significant levels, representing areas where substantial buying pressure could be expected if a larger correction were to occur. The resistance levels on the daily chart are $50,538.67, $51,215.33, and $51,577.67. Notice the overlap with the 4-hour resistance levels, particularly around $51,215.33 and $51,577.67. This confluence of resistance on multiple timeframes makes these levels particularly important to watch.
Correlations and Macroeconomic Context
The Dow Jones doesn't trade in a vacuum. Its movements are often correlated with broader market sentiment, the strength of the US dollar, and macroeconomic data. The DXY (Dollar Index) is currently trading around 99.7. A strengthening dollar, indicated by a rising DXY, often puts pressure on US equities, including the Dow Jones, as it makes dollar-denominated assets more expensive for foreign investors. Conversely, a weakening dollar can sometimes coincide with rallies in the stock market. With the DXY showing some upward momentum on the 1-hour and 4-hour charts, this could be a subtle headwind for the index if it continues.
Global equity markets also provide context. The SP500 is trading at $6,572.87, showing a strong 0.74% daily gain, and the Nasdaq 100 is up 4.27% at $29,644.55. These positive moves in major US indices suggest a generally risk-on sentiment, which typically benefits the Dow Jones. However, the daily chart for SP500 shows a bearish trend with ADX at 47.51, indicating strong downward momentum, despite the current price action. This creates a conflicting picture: short-term optimism in the Dow Jones and Nasdaq, but a bearish undertone in the broader S&P 500's daily trend. This complexity underscores the need for a multi-faceted approach to trading.
Oil prices, represented by Brent crude at $88.63 and WTI at $84.85, have seen significant declines this week, falling by over 8%. This drop in oil prices can be interpreted in several ways. On one hand, it might signal easing inflation concerns, which could be positive for equities as it might reduce pressure on central banks to hike rates aggressively. On the other hand, a sharp fall in commodity prices can sometimes indicate slowing global demand, a more bearish signal for economic growth and corporate earnings. The recent news of potential de-escalation in the Middle East, as reported by Reuters and Bloomberg, likely contributed to this oil price slump, easing geopolitical risk premiums.
Trade Scenarios and Probabilities
Bullish Scenario: Breaking the $51,234 Barrier
25% ProbabilityNeutral Scenario: Consolidation Around $51,184.50
50% ProbabilityBearish Scenario: Support Breakdown Below $50,885
25% ProbabilityThe Week Ahead: CPI Data and Market Expectations
Looking ahead, the upcoming week is dominated by the release of crucial inflation data, specifically the CPI figures. This report will be a major determinant of the Federal Reserve's future monetary policy decisions, and consequently, the direction of the Dow Jones. If inflation comes in hotter than expected, it could reignite fears of further rate hikes or a prolonged period of higher rates, which would likely be a negative catalyst for equities. Conversely, a cooler-than-expected CPI reading could bolster hopes for rate cuts later in the year, potentially fueling another leg higher for the index.
The market's reaction to this data will be heavily influenced by current expectations. As indicated by the economic calendar, there are several high-impact USD data releases leading up to and following the CPI report. While specific forecasts aren't provided in the current data snapshot, the general sentiment around inflation remains a key driver. Traders will be scrutinizing not just the headline CPI number but also the core CPI, which excludes volatile food and energy prices, as this often gives a clearer picture of underlying inflation trends. The prevailing narrative around sticky inflation versus easing price pressures will be tested by this data.
The correlation with the DXY will also be critical to monitor. If the dollar strengthens significantly on the back of inflation data or hawkish Fed commentary, it could act as a drag on the Dow Jones, even if the inflation numbers themselves are perceived as positive for the economy. The market is often sensitive to these cross-asset relationships, and a strong dollar can signal a risk-off environment, which is generally not favorable for stock indices.
The upcoming CPI data release poses a significant risk event. High volatility is expected around the announcement. Traders should exercise caution, manage their risk exposure tightly, and consider waiting for confirmation of price direction after the initial market reaction.
Final Thoughts: Patience and Precision
The Dow Jones Industrial Average stands at a critical juncture, trading at $51,184.50 as the market braces for key inflation data. The technical indicators present a mosaic of signals: a neutral to bullish RSI, bearish MACD momentum, overbought Stochastic on the 4-hour chart, and moderate trend strength indicated by the ADX. Support at $50,885 and resistance at $51,234 are the immediate battlegrounds. The interplay between these technicals, the strengthening DXY, and the upcoming CPI report will be crucial in determining the index's next move.
For those looking to trade this environment, patience and precision are key. The market is offering conflicting signals, suggesting that a period of consolidation or a clear breakout is likely on the horizon, rather than a smooth, uninterrupted trend. Understanding the probabilities associated with each scenario - bullish above $51,234, bearish below $50,885, or neutral consolidation - will be vital for risk management. The key takeaway is that while the Dow Jones has shown resilience, the coming week's economic data holds the power to significantly alter the technical landscape.
| Indicator | Value | Signal | Interpretation |
|---|---|---|---|
| RSI (14) | 57.21 | Neutral | Room for upside before overbought conditions. |
| MACD Histogram | -0.2 (Daily) | Bearish Momentum | Suggests underlying selling pressure despite recent gains. |
| Stochastic (%K/%D) | 38.31/45.83 (Daily) | Neutral | Daily Stochastic shows potential for upside, 4H is overbought. |
| ADX | 20.13 (Daily) | Moderate Trend | Indicates a present but not overwhelmingly dominant trend. |
| Bollinger Bands | Middle Band Break | Watch | Price is above the middle band, indicating potential for further upward movement. |
Frequently Asked Questions: DowJones30 Analysis
What happens if the Dow Jones breaks below $50,885 support?
A decisive close below $50,885 on the 4-hour chart, especially with negative MACD momentum, would invalidate the bullish outlook. This scenario targets the next daily support at $50,757, with a secondary target at $50,536.
Should I buy the Dow Jones at current levels of $51,184.50 given the RSI at 57?
Buying at $51,184.50 requires caution. While the daily RSI at 57.21 suggests room for upside, the 4-hour Stochastic is overbought and the daily MACD shows negative momentum. A probability of 50% suggests consolidation, so waiting for a clear trigger above $51,234 or a confirmed bounce from $50,885 might offer a better risk/reward.
Is the daily MACD histogram's negative momentum a sell signal for the Dow Jones at $51,184.50?
The negative MACD histogram on the daily chart at $51,184.50 indicates underlying selling pressure, which contrasts with the bullish leanings of the RSI. While not a direct sell signal on its own, it suggests the rally might be losing steam and traders should look for further bearish confirmation, such as a break below key support levels.
How will upcoming CPI data affect the Dow Jones's price around $51,184.50 this week?
Hotter-than-expected CPI data could pressure the Dow Jones around $51,184.50 by fueling rate hike fears, while cooler data might boost it by increasing rate cut hopes. The market's interpretation and the Fed's subsequent reaction will be key, with significant volatility expected around the announcement.
Track markets in real-time
AI-powered analysis, technical indicators and real-time price data.
Join Our Telegram Channel
Breaking market news, AI analysis and trading signals instantly.
Join Channel