The relentless ascent of USDJPY has brought it to the doorstep of a significant psychological and technical barrier around $160.54. This critical juncture arrives as traders brace for high-stakes US inflation data, a catalyst that could dramatically shape the pair's immediate trajectory. With the Dollar Index (DXY) showing renewed strength and technical indicators flashing mixed signals across various timeframes, the market is positioned for a pivotal moment. Understanding the interplay between macro drivers and chart patterns is paramount for navigating this complex landscape.
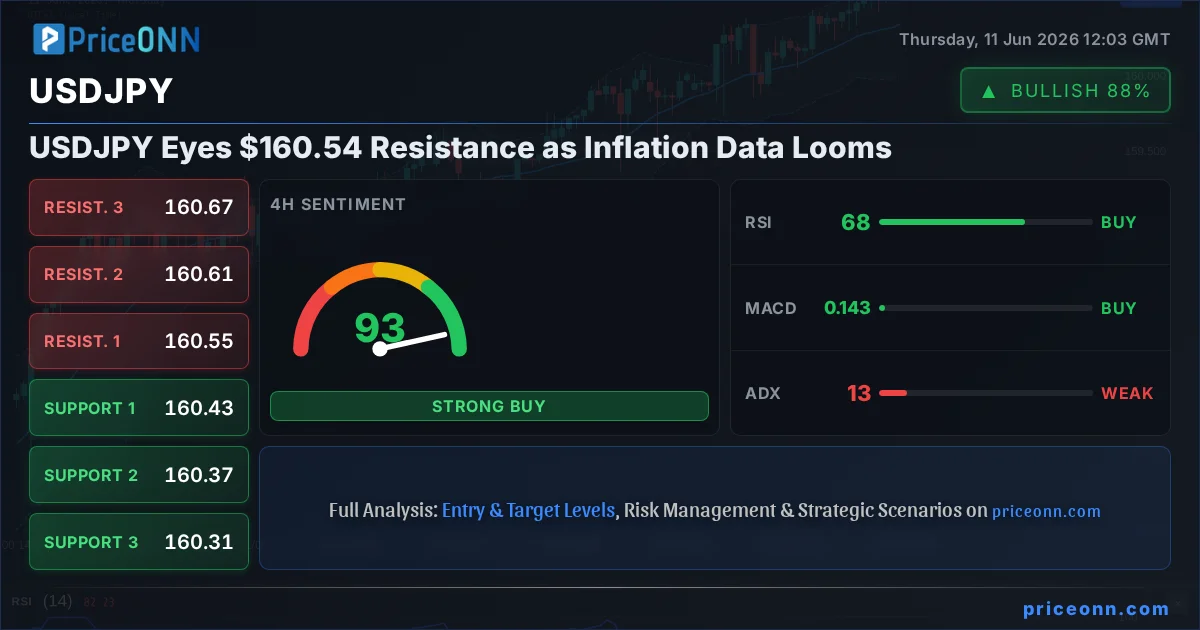
- USDJPY is currently testing resistance near $160.54, a level that has capped recent advances.
- The Dollar Index (DXY) is showing strength, trading at 99.8, which typically exerts downward pressure on major currency pairs like USDJPY.
- Technical indicators present a mixed picture: the 1-hour chart shows a bullish trend with positive MACD, while daily charts reveal a strong downtrend with RSI at 24.5, indicating potential oversold conditions.
- Upcoming US inflation data is the key event to watch, with the potential to trigger significant volatility and a clear directional move for USDJPY.
The narrative surrounding USDJPY has been dominated by the Bank of Japan's (BOJ) persistent dovish stance, contrasting sharply with the Federal Reserve's more hawkish inclinations, or at least its perceived readiness to maintain higher rates for longer. This policy divergence has been a primary engine driving the pair higher, creating significant upward pressure. However, as USDJPY approaches the $160.54 mark, the market is keenly aware that such significant moves often attract increased scrutiny and potential intervention or profit-taking. The question on every trader's mind is whether this resistance level will hold, leading to a consolidation, or if a decisive breakout will set the stage for further appreciation.
Macroeconomic Crosscurrents Shaping USDJPY
The strength of the US dollar, as reflected by the Dollar Index (DXY) currently trading at 99.8, is a significant headwind for USDJPY. Historically, a strengthening dollar tends to put downward pressure on USDJPY, as it implies a stronger US economy or higher interest rate expectations relative to Japan. The DXY's current position, hovering near its recent highs, suggests that global capital is flowing towards perceived safe-haven assets or currencies associated with higher yields. This dynamic creates a tug-of-war: the inherent weakness of the Japanese Yen due to BOJ's ultra-loose monetary policy is being countered by the broad-based strength of the US dollar.
Furthermore, the market is hypersensitive to any hints of intervention from Japanese authorities. The rapid ascent of USDJPY has, in the past, prompted verbal warnings and even direct market intervention from Tokyo to stem the yen's depreciation. While no overt action has been signaled recently, the psychological level of 160 has always been a point of heightened awareness. Traders are constantly scanning for any rhetoric or policy shifts that might signal a change in Japan's tolerance for such a weak yen, which can fuel inflation and erode purchasing power.
The upcoming US inflation data is the critical wildcard. Expectations are for inflation to remain elevated, and any figure that significantly deviates from forecasts - either higher or lower - could trigger substantial market reactions. Higher-than-expected inflation might reinforce the narrative of the Fed keeping rates higher for longer, boosting the dollar and potentially pushing USDJPY higher, provided the BOJ remains passive. Conversely, a surprisingly cool inflation report could reduce rate hike expectations, weaken the dollar, and put the brakes on USDJPY's advance, potentially leading to a sharp pullback towards support levels.
The correlation between USDJPY and the broader risk sentiment, often gauged by indices like the S&P 500 (currently at 6572.87) and Nasdaq 100 (at 28873.99), is also worth monitoring. While USDJPY has historically acted as a risk-on asset, its recent behavior has been more closely tied to interest rate differentials. However, a significant global risk-off event, perhaps triggered by geopolitical tensions or a sharp equity market selloff, could lead to a flight to safety that benefits the yen, regardless of the interest rate narrative. Currently, the S&P 500's daily trend is in a powerful downtrend according to the data, while the 1-hour chart shows a bullish trend, highlighting the choppiness and uncertainty in risk assets.
Technical Landscape: A Tale of Two Timeframes
Examining USDJPY's technical posture reveals a divergence across timeframes, underscoring the current market indecision. On the 1-hour chart, the trend is identified as bullish with a strength of 74%. The price is trading above the middle Bollinger Band, and the MACD shows positive momentum, with the MACD line above its signal line. The RSI(14) at 57.58 sits comfortably in neutral territory, suggesting room for upward movement. The ADX, however, at 8.77, indicates a weak trend, implying that this bullish momentum might lack conviction and could be susceptible to reversal. This short-term view suggests a potential for further upside towards the immediate resistance at $160.561.
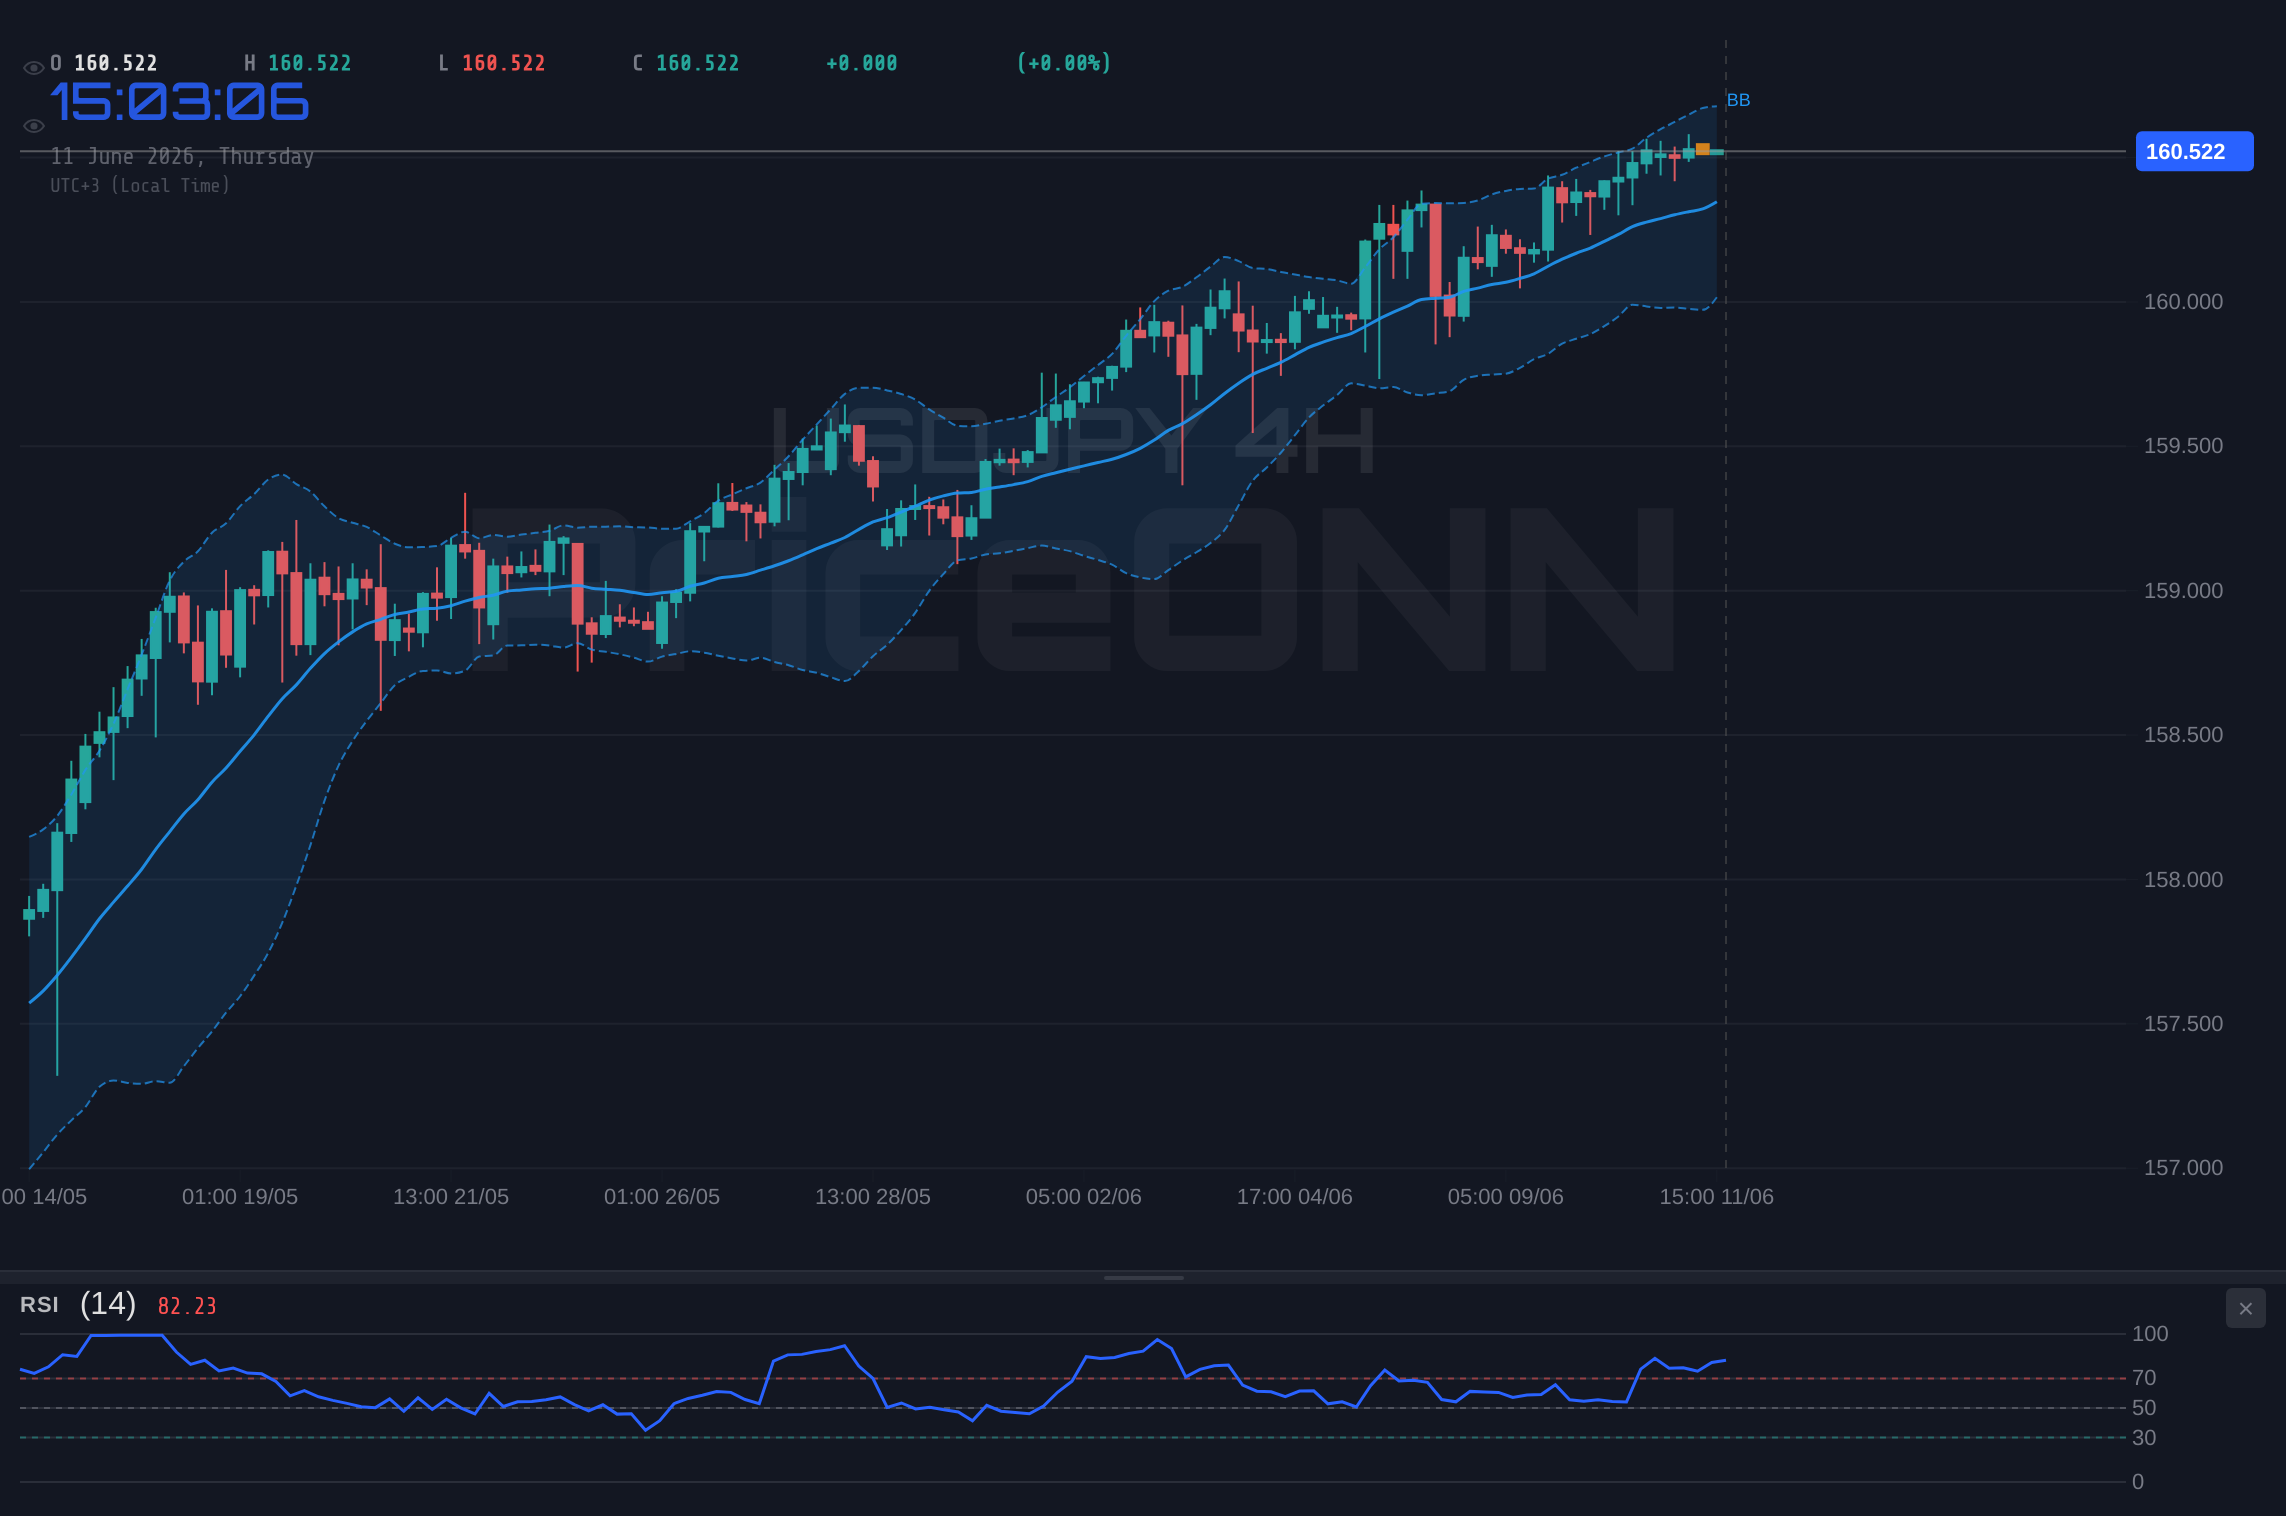
However, the picture shifts dramatically when we move to the 4-hour and daily charts. The 4-hour timeframe still shows a bullish trend (strength 82%), with the price above the middle band and RSI at a more robust 68.17, nearing overbought territory. The Stochastic indicator (K=84.19, D=86.98) is in the overbought zone, signaling potential exhaustion. The ADX at 13.29 continues to point to a weak trend. The daily chart presents an even more bearish outlook, despite the 1-hour and 4-hour bullish signals. The trend is classified as bullish with 93% strength, but the RSI(14) is at 65.97, in neutral territory suggesting upward momentum, while the Stochastic is in the overbought zone (K=90.65, D=91.92). The ADX at 16.08 still indicates a weak trend. This conflict across timeframes suggests that while short-term momentum might be upward, the longer-term trend is not yet firmly established as bullish, and the approach to the $160.54 resistance is fraught with potential reversals.
The daily chart's technical indicators paint a more cautious picture than the short-term trend suggests. While the trend is technically classified as bullish, the RSI at 65.97 is approaching the overbought threshold, and the Stochastic Oscillator is firmly in overbought territory (K=90.65, D=91.92). This overbought condition, especially on the daily timeframe, often precedes a pullback or consolidation. The ADX at 16.08 confirms the lack of a strong, committed trend, meaning the current upward move might be more of a correction within a larger, potentially sideways or even a future downward, move rather than a sustainable rally.
Crucially, the support levels provided for the 1-hour timeframe are $160.506, $160.493, and $160.472, while resistance is eyed at $160.54, $160.561, and $160.574. On the daily chart, support is seen at $160.115, $159.886, and $159.724, with resistance levels at $160.506, $160.668, and $160.897. The current price of $160.54 sits precisely at the confluence of the 1-hour resistance and the daily support level, creating a critical battleground. A decisive break above the $160.506-$160.574 zone on the 1-hour chart, sustained by strong volume and positive macroeconomic news, could propel USDJPY higher. Conversely, a failure to break through this resistance, coupled with weak inflation data or strong yen-buying, could see the pair retreat sharply towards the daily support levels, particularly $160.115.
Navigating the Inflation Data Storm
The anticipation surrounding the US inflation data release is palpable. Traders are dissecting the previous month's figures - where the Consumer Price Index (CPI) rose by 0.4% month-on-month and 1.4% year-on-year, with Core CPI at 3.8% year-on-year - to gauge potential future outcomes. Any deviation from the forecasted 0.5% m/m and 4.0% y/y for headline CPI, or a significant shift in Core CPI from the previous 3.8%, will likely inject significant volatility into USDJPY. A higher-than-expected inflation print would reinforce the 'higher for longer' narrative for Fed rates, bolstering the dollar and potentially driving USDJPY above $160.54. This scenario aligns with the bullish short-term technical signals but would need to overcome the daily chart's overbought conditions.
Conversely, a cooler inflation report could lead to a rapid reassessment of Fed policy expectations. If inflation prints below expectations, it might embolden calls for the Fed to consider rate cuts sooner rather than later. This would likely weaken the dollar significantly, causing USDJPY to pull back sharply from the $160.54 resistance. In this scenario, the daily chart's oversold conditions, with RSI at 24.5 and Stochastic in deep oversold territory, might signal a buying opportunity for those anticipating a reversal, even if the immediate trend remains choppy.
The market's reaction will also depend on how other major currencies are faring. For instance, if the Euro (EURUSD currently at 1.15388) shows weakness due to dovish ECB signals or poor European economic data, this could indirectly support USDJPY by strengthening the dollar's relative appeal. Similarly, a sharp decline in the British Pound (GBPUSD at 1.33656) on economic concerns could add to the dollar's safe-haven bid. The current data shows EURUSD and GBPUSD both in daily downtrends, which generally supports a stronger dollar environment, indirectly benefiting USDJPY.
The Japanese Yen itself is not immune to domestic factors. While the BOJ has maintained its ultra-loose policy, any shift in language or subtle hints of a future tightening could strengthen the yen independently of dollar movements. However, based on current data, the trend for USDJPY remains overwhelmingly influenced by the interest rate differential and broad dollar strength. The current technical setup, with USDJPY hovering at $160.54 resistance, means that the upcoming inflation data is not just a directional catalyst but also a critical test of the market's conviction.
Trade Scenarios for USDJPY
Bearish Scenario: Resistance Holds Strong
60% ProbabilityNeutral Scenario: Consolidation Around Resistance
25% ProbabilityBullish Scenario: Inflation Data Fuels Breakout
15% ProbabilityThe current technical setup, particularly the conflicting signals between short-term bullish momentum and longer-term bearish undertones on daily charts, suggests that the market is waiting for a decisive catalyst. The ADX values across timeframes (8.77 on 1H, 13.29 on 4H, 16.08 on 1D) consistently point to weak trending conditions, meaning that any breakout needs strong confirmation to be sustained. This suggests that a period of consolidation or a sharp, data-driven move is more likely than a steady, gradual advance or decline.
A daily close above $160.574 would be a significant technical development, potentially opening the door for USDJPY to challenge higher resistance levels. However, given the current daily chart indicators, particularly the RSI at 65.97 and Stochastic in overbought territory, any such move would likely face stiff headwinds and could be prone to sharp reversals. Conversely, a failure to break this immediate resistance, especially if accompanied by disappointing inflation data or a sudden strengthening of the yen driven by external factors, could see USDJPY fall back towards the $160.115 support level, and potentially lower.
The analysis suggests that while short-term traders might find opportunities on either side of the $160.54 level depending on the inflation data outcome, longer-term investors should exercise caution. The weak trend signals from the ADX indicate that the current market environment is not conducive to strong, sustained moves without a clear directional catalyst. Patience will be key, waiting for a confirmed break of either the immediate resistance around $160.574 or the support at $160.115 before committing to a significant position.
Frequently Asked Questions: USDJPY Analysis
What happens if USDJPY breaks above $160.574 resistance after the US inflation data?
A decisive close above $160.574, especially if supported by higher-than-expected US inflation, could trigger a bullish scenario. This might lead USDJPY towards the $161.00 psychological level and potentially extend towards $161.50, as indicated in our bullish scenario. However, given the daily chart's overbought Stochastic, such a move would need strong conviction to sustain.
Should I buy USDJPY at current levels near $160.54 given the mixed technical signals?
Entering a long position at current levels near $160.54 carries significant risk due to the strong resistance and mixed signals. The 1-hour chart shows bullish momentum, but the daily RSI (65.97) and Stochastic (90.65) are in overbought territory. A safer approach would be to wait for a confirmed breakout above $160.574 or a pullback to support near $160.115, aligning with a clearer technical setup.
Is the RSI at 65.97 on the daily chart a sell signal for USDJPY?
An RSI of 65.97 on the daily chart is approaching overbought territory but is not yet an extreme sell signal on its own. It indicates strengthening upward momentum that could lead to a pullback, especially given the Stochastic Oscillator is already in overbought territory (90.65). Confirmation from price action, such as a failure to break resistance or a bearish candlestick pattern, would be needed for a strong sell signal.
How will the upcoming US inflation data impact USDJPY this week?
Higher-than-expected inflation data could reinforce the 'higher for longer' Fed rate narrative, strengthening the dollar and potentially pushing USDJPY above $160.54. Conversely, lower inflation could lead to dollar weakness and a pullback towards $160.115 support. The market’s reaction will hinge on the magnitude of the surprise and how it influences Fed policy expectations.
Volatility creates opportunity - those prepared will be rewarded. The current technical picture for USDJPY, hovering around $160.54 resistance ahead of crucial inflation data, presents a classic market crossroads. While short-term signals hint at upward momentum, the longer-term daily indicators and the proximity to resistance suggest caution. Patience and disciplined risk management will be essential for traders seeking to navigate this pivotal juncture. Waiting for a clear directional signal, confirmed by both macro events and technical breakouts or breakdowns, will be the most prudent strategy.
Track markets in real-time
AI-powered analysis, technical indicators and real-time price data.
Join Our Telegram Channel
Breaking market news, AI analysis and trading signals instantly.
Join Channel